 RSS Feed
 by Calculated Risk on 8/11/2022 10:45:00 AM
Thursday, August 11, 2022
MBA: "Mortgage Delinquencies Decrease in the Second Quarter of 2022"
From the MBA: Mortgage Delinquencies Decrease in the Second Quarter of 2022
The delinquency rate for mortgage loans on one-to-four-unit residential properties decreased to a seasonally adjusted rate of 3.64 percent of all loans outstanding at the end of the second quarter of 2022, according to the Mortgage Bankers Association’s (MBA) National Delinquency Survey.
For the purposes of the survey, MBA asks servicers to report loans in forbearance as delinquent if the payment was not made based on the original terms of the mortgage. The delinquency rate was down 47 basis points from the first quarter of 2022 and down 183 basis points from one year ago.
“At 3.64 percent, the mortgage delinquency rate in the second quarter fell to its lowest level since MBA’s survey began in 1979 – even beating out the previous pre-pandemic, survey low of 3.77 percent in the fourth quarter of 2019,” said Marina Walsh, MBA’s Vice President of Industry Analysis. “Most of the improvement across all product types – FHA, VA, and conventional loans - resulted from a decline in the loans that were 90 days or more delinquent but not in the foreclosure process.”
According to Walsh, of all the economic indicators that can lead to mortgage delinquencies, the U.S. unemployment rate seems to be the best gauge of loan performance. Despite inflationary pressures, stock market volatility, increases in mortgage rates, and two quarters of economic contraction – often defined as a recession – the job market remains incredibly strong. The unemployment rate was 3.5 percent in July – a half-century low that tracks closely with the record-low mortgage delinquency rate.
Added Walsh, “Foreclosure inventory levels and foreclosure starts remain well below historical averages for the survey – a strong indication that servicers are able to help delinquent borrowers find alternatives to foreclosure. Such alternatives include curing, loan workouts, home sales - with possible equity to spare, or cash-for-keys and deed-in-lieu options.”
emphasis added
 Click on graph for larger image.
This graph shows the percent of loans delinquent by days past due. Overall delinquencies decreased in Q2 to a record low.
From the MBA:
Compared to last quarter, the seasonally adjusted mortgage delinquency rate decreased for all loans outstanding to 3.64 percent, the lowest level in the history of the survey dating back to 1979. By stage, the 30-day delinquency rate increased 7 basis points to 1.66 percent, the 60-day delinquency rate decreased 7 basis points to 0.49 percent, and the 90-day delinquency bucket decreased 47 basis points to 1.49 percent.This sharp increase in 2020 in the 90-day bucket was due to loans in forbearance (included as delinquent, but not reported to the credit bureaus).
...
The delinquency rate includes loans that are at least one payment past due but does not include loans in the process of foreclosure. The percentage of loans in the foreclosure process at the end of the second quarter was 0.59 percent, up 6 basis points from the first quarter of 2022 and 8 basis points higher than one year ago. The foreclosure inventory rate remains below the quarterly average of 1.43 percent dating back to 1979.
The percent of loans in the foreclosure process increased in Q2 with the end of the foreclosure moratoriums.
Weekly Initial Unemployment Claims increase to 262,000
by Calculated Risk on 8/11/2022 08:36:00 AM
The DOL reported:
In the week ending August 6, the advance figure for seasonally adjusted initial claims was 262,000, an increase of 14,000 from the previous week's revised level. The previous week's level was revised down by 12,000 from 260,000 to 248,000. The 4-week moving average was 252,000, an increase of 4,500 from the previous week's revised average. The previous week's average was revised down by 7,250 from 254,750 to 247,500.The following graph shows the 4-week moving average of weekly claims since 1971.
emphasis added
 Click on graph for larger image.
The dashed line on the graph is the current 4-week average. The four-week average of weekly unemployment claims increased to 252,000.
The previous week was revised down.
Weekly claims were at the consensus forecast.
Wednesday, August 10, 2022
Thursday: Unemployment Claims, PPI
by Calculated Risk on 8/10/2022 08:27:00 PM
Thursday:
• At 8:30 AM ET, The initial weekly unemployment claims report will be released. The consensus is for 263 thousand up from 260 thousand last week.
• Also at 8:30 AM, The Producer Price Index for July from the BLS. The consensus is for a 0.3% increase in PPI, and a 0.4% increase in core PPI.
On COVID (focus on hospitalizations and deaths):
Hospitalizations have almost quadrupled from the lows in April 2022.
 Click on graph for larger image.
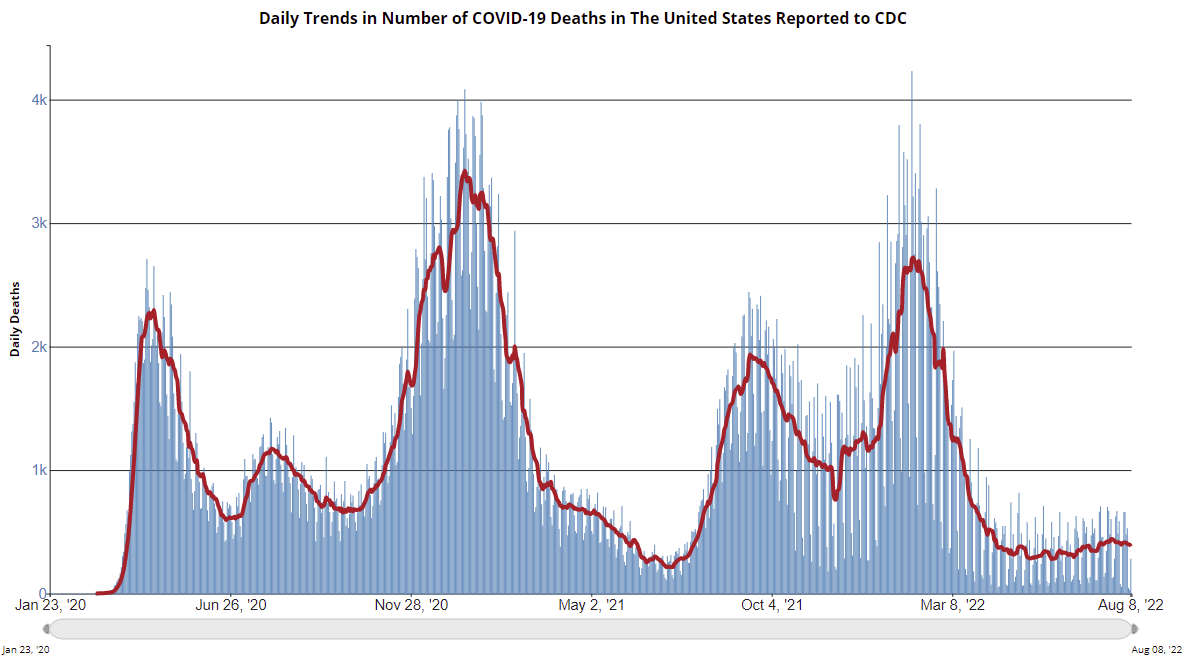
This graph shows the daily (columns) and 7-day average (line) of deaths reported.
| COVID Metrics | ||||
|---|---|---|---|---|
| Now | Week Ago | Goal | ||
| New Cases per Day2 | 107,077 | 121,260 | ≤5,0001 | |
| Hospitalized2 | 36,663 | 37,632 | ≤3,0001 | |
| Deaths per Day2 | 395 | 422 | ≤501 | |
| 1my goals to stop daily posts, 27-day average for Cases, Currently Hospitalized, and Deaths 🚩 Increasing 7-day average week-over-week for Cases, Hospitalized, and Deaths ✅ Goal met. | ||||
 Click on graph for larger image.
This graph shows the daily (columns) and 7-day average (line) of deaths reported.
Average daily deaths bottomed in July 2021 at 214 per day.
Homebuyers Hit Brakes in July, Sellers Hold Back
by Calculated Risk on 8/10/2022 01:15:00 PM
Today, in the Calculated Risk Real Estate Newsletter: Homebuyers Hit Brakes in July, Sellers Hold Back
A brief excerpt:
The big story for July existing home sales is the sharp year-over-year (YoY) decline in sales. Another key story is that new listings are down YoY in July. Of course, active listings are up sharply.There is much more in the article. You can subscribe at https://calculatedrisk.substack.com/
...
Notes for all tables:
1. New additions to table in BOLD.
2. Northwest (Seattle), Santa Clara (San Jose), Jacksonville, Source: Northeast Florida Association of REALTORS®
3. Totals do not include Atlanta, Denver (included in state totals)
And here is a table for new listings in July. For these areas, new listings were down 8.6% YoY.
Last month, new listings in these markets were up 3.9% YoY. Overall, we aren’t seeing a pickup in new listings in these markets. In most markets, new listings are down YoY.
...
Much more to come!

Cleveland Fed: Median CPI increased 0.5% and Trimmed-mean CPI increased 0.4% in July
by Calculated Risk on 8/10/2022 11:13:00 AM
The Cleveland Fed released the median CPI and the trimmed-mean CPI this morning:
According to the Federal Reserve Bank of Cleveland, the median Consumer Price Index rose 0.5% in July. The 16% trimmed-mean Consumer Price Index increased 0.4% in July. "The median CPI and 16% trimmed-mean CPI are measures of core inflation calculated by the Federal Reserve Bank of Cleveland based on data released in the Bureau of Labor Statistics’ (BLS) monthly CPI report".
Note: The Cleveland Fed released the median CPI details here: "Motor Fuel" decreased at a 61% annualized rate in July!
Note that Owners' Equivalent Rent and Rent of Primary Residence account for almost 1/3 of median CPI, and these measures were up between 3% annualized in the Northeast and almost 11% in the South with an average of close to 7.5%. The year-over-year increase was smaller in July than in June.
 Click on graph for larger image.
This graph shows the year-over-year change for these four key measures of inflation.
On a year-over-year basis, the median CPI rose 6.3%, the trimmed-mean CPI rose 7.0%, and the CPI less food and energy rose 5.9%. Core PCE is for June and increased 4.8% year-over-year.
Early Look at 2023 Cost-Of-Living Adjustments and Maximum Contribution Base
by Calculated Risk on 8/10/2022 10:15:00 AM
The BLS reported this morning:
The Consumer Price Index for Urban Wage Earners and Clerical Workers (CPI-W) increased 9.1 percent over the last 12 months to an index level of 292.219 (1982-84=100). For the month, the index declined 0.1 percent prior to seasonal adjustment.CPI-W is the index that is used to calculate the Cost-Of-Living Adjustments (COLA). The calculation dates have changed over time (see Cost-of-Living Adjustments), but the current calculation uses the average CPI-W for the three months in Q3 (July, August, September) and compares to the average for the highest previous average of Q3 months. Note: this is not the headline CPI-U and is not seasonally adjusted (NSA).
• In 2021, the Q3 average of CPI-W was 268.421.
The 2021 Q3 average was the highest Q3 average, so we only have to compare Q3 this year to last year.
 Click on graph for larger image.
This graph shows CPI-W since January 2000. The red lines are the Q3 average of CPI-W for each year.
Note: The year labeled is for the calculation, and the adjustment is effective for December of that year (received by beneficiaries in January of the following year).
CPI-W was up 9.1% year-over-year in July, and although this is early - we need the data for July, August and September - my early guess is COLA will probably be around 8.5% to 9.0% this year, the largest increase since 11.2% in 1981 (and larger than the 7.4% increase in 1982).
Contribution and Benefit Base
The contribution base will be adjusted using the National Average Wage Index. This is based on a one-year lag. The National Average Wage Index is not available for 2021 yet, but wages probably increased again in 2021. If wages increased 4% in 2021, then the contribution base next year will increase to around $153,000 in 2023, from the current $147,000.
Remember - this is an early look. What matters is average CPI-W, NSA, for all three months in Q3 (July, August and September).
BLS: CPI Unchanged in July; Core CPI increased 0.3%
by Calculated Risk on 8/10/2022 08:32:00 AM
The Consumer Price Index for All Urban Consumers (CPI-U) was unchanged in July on a seasonally adjusted basis after rising 1.3 percent in June, the U.S. Bureau of Labor Statistics reported today. Over the last 12 months, the all items index increased 8.5 percent before seasonal adjustment.The consensus was for 0.2% increase in CPI, and a 0.5% increase in core CPI. Both were below expectations. I'll post a graph later today after the Cleveland Fed releases the median and trimmed-mean CPI.
The gasoline index fell 7.7 percent in July and offset increases in the food and shelter indexes, resulting in the all items index being unchanged over the month. The energy index fell 4.6 percent over the month as the indexes for gasoline and natural gas declined, but the index for electricity increased. The food index continued to rise, increasing 1.1 percent over the month as the food at home index rose 1.3 percent.
The index for all items less food and energy rose 0.3 percent in July, a smaller increase than in April, May, or June. The indexes for shelter, medical care, motor vehicle insurance, household furnishings and operations, new vehicles, and recreation were among those that increased over the month. There were some indexes that declined in July, including those for airline fares, used cars and trucks, communication, and apparel.
The all items index increased 8.5 percent for the 12 months ending July, a smaller figure than the 9.1-percent increase for the period ending June. The all items less food and energy index rose 5.9 percent over the last 12 months. The energy index increased 32.9 percent for the 12 months ending July, a smaller increase than the 41.6-percent increase for the period ending June. The food index increased 10.9 percent over the last year, the largest 12-month increase since the period ending May 1979.
emphasis added
MBA: Mortgage Applications Increase in Latest Weekly Survey
by Calculated Risk on 8/10/2022 07:00:00 AM
From the MBA: Mortgage Applications Increase in Latest MBA Weekly Survey
Mortgage applications increased 0.2 percent from one week earlier, according to data from the Mortgage Bankers Association’s (MBA) Weekly Mortgage Applications Survey for the week ending August 5, 2022.
... The Refinance Index increased 4 percent from the previous week and was 82 percent lower than the same week one year ago. The seasonally adjusted Purchase Index decreased 1 percent from one week earlier. The unadjusted Purchase Index decreased 2 percent compared with the previous week and was 19 percent lower than the same week one year ago.
“Mortgage rates remained volatile last week – after drops in the previous two weeks, mortgage rates ended up rising four basis points. Mortgage applications were relatively flat, with a decline in purchase activity offset by an increase in refinance applications,” said Joel Kan, MBA’s Associate Vice President of Economic and Industry Forecasting. “The purchase market continues to experience a slowdown, despite the strong job market. Activity has now fallen in five of the last six weeks, as buyers remain on the sidelines due to still-challenging affordability conditions and doubts about the strength of the economy.”
Added Kan, “Refinance applications increased over three percent but remained more than 80 percent lower than a year ago in this higher rate environment.”
...
The average contract interest rate for 30-year fixed-rate mortgages with conforming loan balances ($647,200 or less) increased to 5.47 percent from 5.43 percent, with points increasing to 0.80 from 0.65 (including the origination fee) for 80 percent loan-to-value ratio (LTV) loans.
emphasis added
 Click on graph for larger image.
The first graph shows the refinance index since 1990.
With higher mortgage rates, the refinance index has declined sharply over the last several months.
The refinance index is just above the lowest level since the year 2000.
The second graph shows the MBA mortgage purchase index
 According to the MBA, purchase activity is down 19% year-over-year unadjusted.
The purchase index is now only 12% above the pandemic low.
Note: Red is a four-week average (blue is weekly).
Note: Red is a four-week average (blue is weekly).
Tuesday, August 09, 2022
Wednesday: CPI
by Calculated Risk on 8/09/2022 09:02:00 PM
Wednesday:
• At 7:00 AM ET, The Mortgage Bankers Association (MBA) will release the results for the mortgage purchase applications index.
• At 8:30 AM, The Consumer Price Index for July from the BLS. The consensus is for a 0.2% increase in CPI, and a 0.5% increase in core CPI. The consensus is for CPI to be up 8.8% year-over-year and core CPI to be up 6.1% YoY.
On COVID (focus on hospitalizations and deaths):
Hospitalizations have almost quadrupled from the lows in April 2022.
 Click on graph for larger image.
This graph shows the daily (columns) and 7-day average (line) of deaths reported.
| COVID Metrics | ||||
|---|---|---|---|---|
| Now | Week Ago | Goal | ||
| New Cases per Day2 | 107,515 | 122,190 | ≤5,0001 | |
| Hospitalized2 | 36,644 | 37,661 | ≤3,0001 | |
| Deaths per Day2 | 382 | 409 | ≤501 | |
| 1my goals to stop daily posts, 27-day average for Cases, Currently Hospitalized, and Deaths 🚩 Increasing 7-day average week-over-week for Cases, Hospitalized, and Deaths ✅ Goal met. | ||||
 Click on graph for larger image.
This graph shows the daily (columns) and 7-day average (line) of deaths reported.
Average daily deaths bottomed in July 2021 at 214 per day.
Vehicle Sales: Fleet Turnover Ratio and the Inflation Impact
by Calculated Risk on 8/09/2022 03:14:00 PM
Back in early 2009, I wrote a couple of posts arguing there would be an increase in auto sales - Vehicle Sales (Jan 2009) and Looking for the Sun (Feb 2009). This was an out-of-the-consensus call and helped me call the bottom for the US economy in mid-2009.
I wrote an update in 2014, and argued vehicle sales would "mostly move sideways" for the next few years.
Here is another update to the U.S. fleet turnover graph.
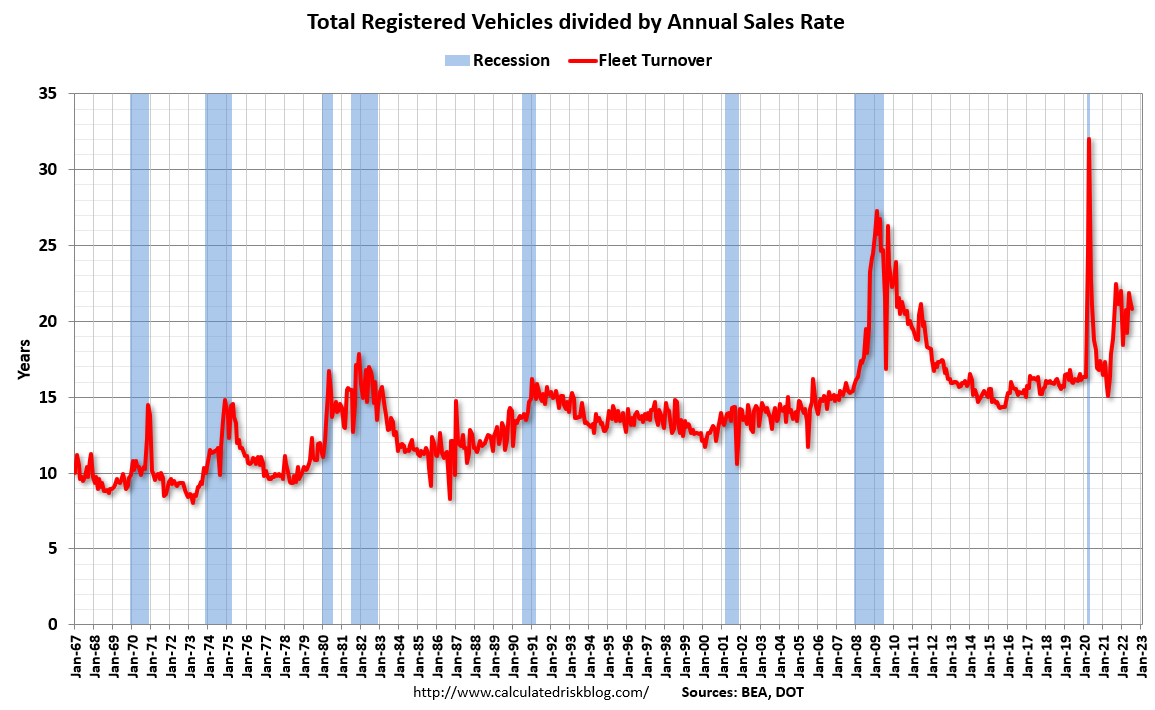
This graph shows the total number of registered vehicles in the U.S. divided by the sales rate through July 2022 - and gives a turnover ratio for the U.S. fleet (this doesn't tell you the age or the composition of the fleet). Note: the number of registered vehicles is estimated for 2021 and 2022.
The wild swings in 2009 were due to the "cash for clunkers" program.
And in April 2020, sales collapsed due to the onset of the pandemic.
 Click on graph for larger image in graph gallery.
The estimated ratio for July is close to 21 years - well above the normal level.
Note: in 2009, I argued the turnover ratio would "probably decline to 15 or so eventually" and that happened - and will likely happen again.
The second graph shows light vehicle sales since the BEA started keeping data in 1967. The dashed line is current estimated sales rate.
 The current sales rate is still low mostly due to pandemic related supply constraints.
Light vehicle sales were at a 13.35 million seasonally adjusted annual rate (SAAR) in July.
I expect vehicle sales to increase over the next couple of years.
When the Fed fights inflation, housing is the primary transmission mechanism for Fed policy, since housing is interest rate sensitive.
Usually, vehicle sales are impacted too by Fed policy, but probably not this time since sales are so low due to the supply constraints.


