by Calculated Risk on 8/19/2022 09:03:00 PM
Friday, August 19, 2022
COVID August 19, 2022, Update on Cases, Hospitalizations and Deaths
On COVID (focus on hospitalizations and deaths):
| COVID Metrics | ||||
|---|---|---|---|---|
| Now | Week Ago | Goal | ||
| New Cases per Day2 | 93,741 | 105,118 | ≤5,0001 | |
| Hospitalized2 | 34,740 | 36,762 | ≤3,0001 | |
| Deaths per Day2 | 392 | 443 | ≤501 | |
| 1my goals to stop daily posts, 27-day average for Cases, Currently Hospitalized, and Deaths 🚩 Increasing 7-day average week-over-week for Cases, Hospitalized, and Deaths ✅ Goal met. | ||||
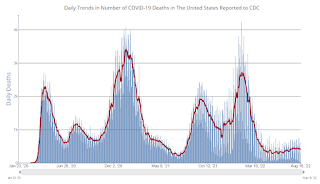 Click on graph for larger image.
This graph shows the daily (columns) and 7-day average (line) of deaths reported.
Realtor.com Reports Weekly Inventory Up 27% Year-over-year; New Listings Down 15%
by Calculated Risk on 8/19/2022 02:20:00 PM
Realtor.com has monthly and weekly data on the existing home market. Here is their weekly report released yesterday from Chief Economist Danielle Hale: Weekly Housing Trends View — Data Week Ending Aug 13, 2022. Note: They have data on list prices, new listings and more, but this focus is on inventory.
• Active inventory continued to grow, but the pace slipped to 27% above one year ago. The rate of improvement actually slipped again this week as the number of new listings continues to come in lower
...
• New listings–a measure of sellers putting homes up for sale–were again down 15% from one year ago. This week marks a sixth straight week of year over year declines in the number of new listings coming up for sale, suggesting that homeowners are less eager to list homes for sale compared to last year even though today’s median listing price is more than 13% higher.
 Here is a graph of the year-over-year change in inventory according to realtor.com.
 Note the rapid increase in the YoY change earlier this year, from down 30% at the beginning of the year, to up 29% YoY at the beginning of July.
Slowdown in Showings Suggests a Further Decline in Existing Home Sales in August
by Calculated Risk on 8/19/2022 11:30:00 AM
Today, in the Calculated Risk Real Estate Newsletter: Slowdown in Showings Suggests a Further Decline in Existing Home Sales in August
A brief excerpt:
The following data is courtesy of David Arbit, Director of Research at the Minneapolis Area REALTORS® and NorthstarMLS (posted with permission). Here is a link to their data.There is much more in the article. You can subscribe at https://calculatedrisk.substack.com/
This graph shows the 7-day average showings for the Twin Cities area for 2019, 2020, 2021, and 2022. The 7-day average showings (red) are currently off 22% from 2019.
...
Click on graph for larger image.
In the existing home sales report for July released yesterday, closed sales, not seasonally adjusted (NSA) were down 22.4% year-over-year. July sales were mostly for contracts signed in May and June. May showings were only down about 13% year-over-year.
This slowdown in showings suggests further declines in closed sales in August - since August sales will be mostly for contracts signed in June and July when showings were down sharply. This early data for August might suggest that September closed sales will see a similar year-over-year decline as in August.
Q3 GDP Forecasts: Around 1%
by Calculated Risk on 8/19/2022 09:45:00 AM
From BofA:
Data this week have been a positive for GDP tracking in 2Q and 3Q. We took our 2Q GDP tracking up to -0.3% q/q saar from -0.9% owing to a strong upward revision to May retail sales. ... Meanwhile, we initiated our 3Q GDP tracking at 0.5% q/q saar [August 19 estimate]From Goldman:
emphasis added
We left our Q3 GDP tracking estimate unchanged at +1.3% (qoq ar). [August 18 estimate]And from the Altanta Fed: GDPNow
The GDPNow model estimate for real GDP growth (seasonally adjusted annual rate) in the third quarter of 2022 is 1.6 percent on August 17, down from 1.8 percent on August 16. [August 17 estimate]
LA Port Traffic: Mostly Steady in July
by Calculated Risk on 8/19/2022 08:31:00 AM
Notes: The expansion to the Panama Canal was completed in 2016 (As I noted a few years ago), and some of the traffic that used the ports of Los Angeles and Long Beach is probably going through the canal. This might be impacting TEUs on the West Coast.
Container traffic gives us an idea about the volume of goods being exported and imported - and usually some hints about the trade report since LA area ports handle about 40% of the nation's container port traffic.
The following graphs are for inbound and outbound traffic at the ports of Los Angeles and Long Beach in TEUs (TEUs: 20-foot equivalent units or 20-foot-long cargo container).
To remove the strong seasonal component for inbound traffic, the first graph shows the rolling 12-month average.
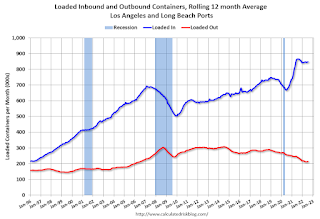
On a rolling 12-month basis, inbound traffic increased 0.5% in July compared to the rolling 12 months ending in June. Outbound traffic was increased 0.1% compared to the rolling 12 months ending the previous month.
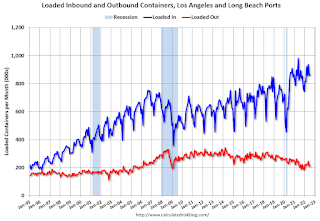
The 2nd graph is the monthly data (with a strong seasonal pattern for imports).
Thursday, August 18, 2022
Hotels: Occupancy Rate Down 4.6% Compared to Same Week in 2019
by Calculated Risk on 8/18/2022 02:50:00 PM
Showing continued alignment with seasonal patterns, U.S. hotel performance fell slightly from the previous week, but showed improved comparisons with 2019, according to STR‘s latest data through Aug. 13.The following graph shows the seasonal pattern for the hotel occupancy rate using the four-week average.
Aug. 7-13, 2022 (percentage change from comparable week in 2019*):
• Occupancy: 68.5% (-4.6%)
• Average daily rate (ADR): $152.34 (+15.8%)
• Revenue per available room (RevPAR): $104.30 (+10.5%)
*Due to the pandemic impact, STR is measuring recovery against comparable time periods from 2019.
emphasis added
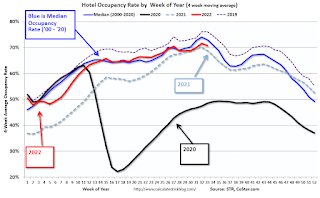 Click on graph for larger image.
The red line is for 2022, black is 2020, blue is the median, and dashed light blue is for 2021. Dashed purple is 2019 (STR is comparing to a strong year for hotels).
More Analysis on July Existing Home Sales
by Calculated Risk on 8/18/2022 10:46:00 AM
Today, in the CalculatedRisk Real Estate Newsletter: NAR: Existing-Home Sales Decreased to 4.81 million SAAR in July
Excerpt:
ales in July (4.81 million SAAR) were down 5.9% from the previous month and were 20.2% below the July 2021 sales rate. Sales are now below pre-pandemic levels and, excluding the pandemic decline, sales are the lowest level since 2014.There is much more in the article. You can subscribe at https://calculatedrisk.substack.com/ (Most content is available for free, so please subscribe).
...
The third graph shows existing home sales for each month, Not Seasonally Adjusted (NSA), for a few selected periods. Black and light Purple are the maximum sales per month during the bubble (2005) and the minimum sales during the bust (2008 - 2011). The most recent four years are shown (2019 through 2022).
Sales NSA in July (453,000) were 22.4% below sales in July 2021 (584,000). Sales NSA year-to-date are down 10.3% compared to the same period in 2021.
This decrease, NSA, was similar to change in the markets I track each month.
...
Key point on Timing of Sales
Existing home sales are reported when the transaction closes. Sales in July were mostly for contracts signed in June and July. Recent data shows a significant slowdown in activity starting in May and decelerating further in June.
My sense is contracts for sales really declined in June, and that will show up as closed sales in July and August - so we should expect a further decline in existing home sales next month.
NAR: Existing-Home Sales Decreased to 4.81 million SAAR in July
by Calculated Risk on 8/18/2022 10:12:00 AM
From the NAR: Existing-Home Sales Retreated 5.9% in July
Existing-home sales sagged for the sixth straight month in July, according to the National Association of REALTORS®. All four major U.S. regions recorded month-over-month and year-over-year sales declines.
Total existing-home sales, completed transactions that include single-family homes, townhomes, condominiums and co-ops, slipped 5.9% from June to a seasonally adjusted annual rate of 4.81 million in July. Year-over-year, sales fell 20.2% (6.03 million in July 2021).
...
Total housing inventory registered at the end of July was 1,310,000 units, an increase of 4.8% from June and unchanged from the previous year. Unsold inventory sits at a 3.3-month supply at the current sales pace, up from 2.9 months in June and 2.6 months in July 2021.
emphasis added
 Click on graph for larger image.
This graph shows existing home sales, on a Seasonally Adjusted Annual Rate (SAAR) basis since 1993.
Sales in July (4.81 million SAAR) were down 5.9% from the previous month and were 20.2% below the July 2021 sales rate.
The second graph shows nationwide inventory for existing homes.
 According to the NAR, inventory increased to 1.31 million in July from 1.25 million in June.
The last graph shows the year-over-year (YoY) change in reported existing home inventory and months-of-supply. Since inventory is not seasonally adjusted, it really helps to look at the YoY change. Note: Months-of-supply is based on the seasonally adjusted sales and not seasonally adjusted inventory.
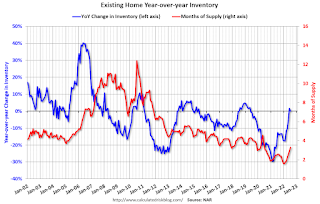 Inventory was unchanged year-over-year (blue) in July compared to July 2021.
 Months of supply (red) increased to 3.3 months in July from 2.9 months in June.
This was below the consensus forecast. I'll have more later.
Weekly Initial Unemployment Claims decrease to 250,000
by Calculated Risk on 8/18/2022 08:34:00 AM
The DOL reported:
In the week ending August 13, the advance figure for seasonally adjusted initial claims was 250,000, a decrease of 2,000 from the previous week's revised level. The previous week's level was revised down by 10,000 from 262,000 to 252,000. The 4-week moving average was 246,750, a decrease of 2,750 from the previous week's revised average. The previous week's average was revised down by 2,500 from 252,000 to 249,500.The following graph shows the 4-week moving average of weekly claims since 1971.
emphasis added
 Click on graph for larger image.
The dashed line on the graph is the current 4-week average. The four-week average of weekly unemployment claims decreased to 246,750.
The previous week was revised down.
Weekly claims were below the consensus forecast.
Wednesday, August 17, 2022
Thursday: Unemployment Claims, Philly Fed Mfg, Existing Home Sales
by Calculated Risk on 8/17/2022 09:02:00 PM
Thursday:
• At 8:30 AM ET, The initial weekly unemployment claims report will be released. The consensus is for 265 thousand up from 262 thousand last week.
• Also at 8:30 AM, the Philly Fed manufacturing survey for August. The consensus is for a reading of -5.0, up from -12.3.
• At 10:00 AM, Existing Home Sales for July from the National Association of Realtors (NAR). The consensus is for 4.88 million SAAR, down from 5.12 million last month.
On COVID (focus on hospitalizations and deaths):
| COVID Metrics | ||||
|---|---|---|---|---|
| Now | Week Ago | Goal | ||
| New Cases per Day2 | 98,940 | 107,899 | ≤5,0001 | |
| Hospitalized2 | 35,139 | 37,092 | ≤3,0001 | |
| Deaths per Day2 | 398 | 426 | ≤501 | |
| 1my goals to stop daily posts, 27-day average for Cases, Currently Hospitalized, and Deaths 🚩 Increasing 7-day average week-over-week for Cases, Hospitalized, and Deaths ✅ Goal met. | ||||
 Click on graph for larger image.
This graph shows the daily (columns) and 7-day average (line) of deaths reported.


