by Calculated Risk on 8/23/2022 08:56:00 PM
Tuesday, August 23, 2022
Wednesday: Durable Goods, Pending Home Sales, Preliminary Employment Benchmark Revision
Wednesday:
• At 7:00 AM ET, The Mortgage Bankers Association (MBA) will release the results for the mortgage purchase applications index.
• At 8:30 AM, Durable Goods Orders for July from the Census Bureau. The consensus is for a 0.5% increase in durable goods orders.
• At 10:00 AM, Pending Home Sales Index for July. The consensus is for a 3.8% decrease in the index.
• Also at 10:00 AM, the Bureau of Labor Statistics (BLS) will release the 2022 Preliminary Benchmark Revision to Establishment Survey Data.
• During the day, The AIA's Architecture Billings Index for July (a leading indicator for commercial real estate).
On COVID (focus on hospitalizations and deaths):
| COVID Metrics | ||||
|---|---|---|---|---|
| Now | Week Ago | Goal | ||
| New Cases per Day2 | 89,580 | 101,176 | ≤5,0001 | |
| Hospitalized2 | 33,379 | 35,761 | ≤3,0001 | |
| Deaths per Day2 | 387 | 443 | ≤501 | |
| 1my goals to stop daily posts, 27-day average for Cases, Currently Hospitalized, and Deaths 🚩 Increasing 7-day average week-over-week for Cases, Hospitalized, and Deaths ✅ Goal met. | ||||
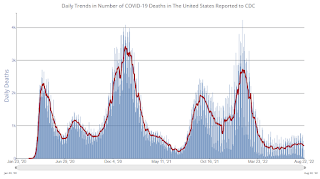 Click on graph for larger image.
This graph shows the daily (columns) and 7-day average (line) of deaths reported.
DOT: Vehicle Miles Driven Decreased year-over-year in June
by Calculated Risk on 8/23/2022 02:21:00 PM
This is something to watch with higher gasoline prices.
The Department of Transportation (DOT) reported:
Travel on all roads and streets changed by -1.7% (-4.8 billion vehicle miles) for June 2022 as compared with June 2021. Travel for the month is estimated to be 282.1 billion vehicle miles.
The seasonally adjusted vehicle miles traveled for June 2022 is 268.0 billion miles, a -1.80% ( -4.8 billion vehicle miles) change over June 2021. It also represents a -1.0% change (-2.7 billion vehicle miles) compared with May 2022.
Cumulative Travel for 2022 changed by +2.8% (+43.2 billion vehicle miles). The cumulative estimate for the year is 1,587.1 billion vehicle miles of travel.
emphasis added
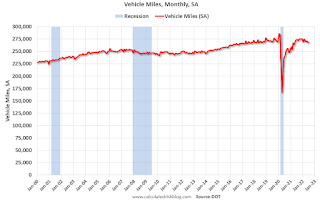 Click on graph for larger image.
This graph shows the monthly total vehicle miles driven, seasonally adjusted.
Miles driven declined sharply in March 2020, and really collapsed in April 2020. After recovering, miles driven might have softened due to higher gasoline prices.
New Home Sales Decrease Sharply, Record Months of Unsold Inventory Under Construction
by Calculated Risk on 8/23/2022 10:48:00 AM
Today, in the Calculated Risk Real Estate Newsletter: https://calculatedrisk.substack.com/p/new-home-sales-decrease-sharply-record-02a
Brief excerpt:
The next graph shows the months of supply by stage of construction. “Months of supply” is inventory at each stage, divided by the sales rate.You can subscribe at https://calculatedrisk.substack.com/.
There are 1.06 months of completed supply (red line). This is about two-thirds of the normal level.
The inventory of new homes under construction is at 7.33 months (blue line) - a new record and well above the normal level. This elevated level of homes under construction is due to supply chain constraints.
And a record 107 thousand homes have not been started - about 2.51 months of supply (grey line) - more than double the normal level. Homebuilders are probably waiting to start some homes until they have a firmer grasp on prices and demand.
...
This suggests we will see a sharp increase in completed inventory over the next several months - and that will put pressure on new home prices.
New Home Sales Decrease Sharply to 511,000 Annual Rate in July
by Calculated Risk on 8/23/2022 10:09:00 AM
The Census Bureau reports New Home Sales in July were at a seasonally adjusted annual rate (SAAR) of 511 thousand.
The previous three months were revised down slightly, combined.
Sales of new single‐family houses in July 2022 were at a seasonally adjusted annual rate of 511,000, according to estimates released jointly today by the U.S. Census Bureau and the Department of Housing and Urban Development. This is 12.6 percent below the revised June rate of 585,000 and is 29.6 percent below the July 2021 estimate of 726,000.
emphasis added
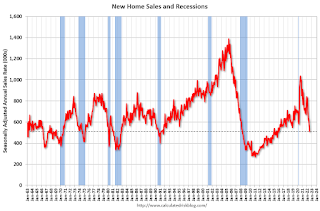 Click on graph for larger image.
The first graph shows New Home Sales vs. recessions since 1963. The dashed line is the current sales rate.
New home sales are now well below pre-pandemic levels.
The second graph shows New Home Months of Supply.
 The months of supply increased in July to 10.9 months from 9.2 months in June.
 The all-time record high was 12.1 months of supply in January 2009. The all-time record low was 3.5 months, most recently in October 2020.
This is well above the top of the normal range (about 4 to 6 months of supply is normal).
"The seasonally‐adjusted estimate of new houses for sale at the end of July was 464,000. This represents a supply of 10.9 months at the current sales rate."
 The last graph shows sales NSA (monthly sales, not seasonally adjusted annual rate).
In July 2022 (red column), 42 thousand new homes were sold (NSA). Last year, 62 thousand homes were sold in July.
The all-time high for July was 117 thousand in 2005, and the all-time low for July was 26 thousand in 2010.
This was well below expectations, and sales in the three previous months were revised down slightly, combined. I'll have more later today.
Monday, August 22, 2022
Tuesday: New Home Sales, Richmond Fed Mfg
by Calculated Risk on 8/22/2022 08:36:00 PM

The average 30yr fixed rate is back in the upper 5% range with some lenders already in the low 6's. ... Rather than view the recent rate spike as the product of one or two individual events, it's better thought of as a general correction to the overly-aggressive drop in July [30 year fixed 5.72%]Tuesday:
emphasis added
• At 10:00 AM ET, New Home Sales for July from the Census Bureau. The consensus is for 575 thousand SAAR, down from 590 thousand in June.
• Also at 10:00 AM, Richmond Fed Survey of Manufacturing Activity for August.
On COVID (focus on hospitalizations and deaths):
| COVID Metrics | ||||
|---|---|---|---|---|
| Now | Week Ago | Goal | ||
| New Cases per Day2 | 88,063 | 101,009 | ≤5,0001 | |
| Hospitalized2 | 30,764 | 36,029 | ≤3,0001 | |
| Deaths per Day2 | 390 | 443 | ≤501 | |
| 1my goals to stop daily posts, 27-day average for Cases, Currently Hospitalized, and Deaths 🚩 Increasing 7-day average week-over-week for Cases, Hospitalized, and Deaths ✅ Goal met. | ||||
 Click on graph for larger image.
This graph shows the daily (columns) and 7-day average (line) of deaths reported.
Final Look at Local Housing Markets in July
by Calculated Risk on 8/22/2022 12:32:00 PM
Today, in the Calculated Risk Real Estate Newsletter: Final Look at Local Housing Markets in July
A brief excerpt:
And a table of July sales. Sales in these areas were down 22.8% YoY, Not Seasonally Adjusted (NSA). Contracts for sales in July were mostly signed in May and June, and we are seeing the impact of higher mortgage rates on July closings.There is much more in the article. You can subscribe at https://calculatedrisk.substack.com/
In June, all local markets I track were down 15.9% YoY, NSA. So, this was another step down in sales, although there was one less selling day in July this year than in July 2021. The NAR reported July sales down 22.4% YoY NSA, and down 20.2% Seasonally Adjusted (SA).
Looking ahead: In August 2022, there is one more selling day than in August 2021, so the SA decline in sales will be larger than the NSA decline.
Here is a table comparing the year-over-year Not Seasonally Adjusted (NSA) declines in sales this year from the National Association of Realtors® (NAR) with the local markets I track. So far, these measures have tracked closely.
Housing Inventory August 22nd Update: Growth has Slowed
by Calculated Risk on 8/22/2022 09:18:00 AM
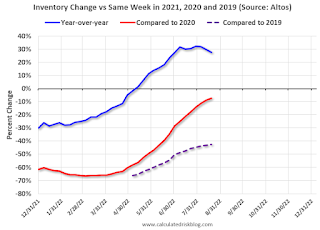
Inventory is still increasing, but the inventory build has slowed over the last month. Still, inventory is increasing faster than in 2019 at this time of year. Here are the same week inventory changes for the last four years:
 Click on graph for larger image.
This inventory graph is courtesy of Altos Research.
1. The seasonal bottom (happened on March 4th for Altos) ✅
2. Inventory up year-over-year (happened on May 13th for Altos) ✅
3. Inventory up compared to two years ago (currently down 7.1% according to Altos)
4. Inventory up compared to 2019 (currently down 42.6%).
Four High Frequency Indicators for the Economy
by Calculated Risk on 8/22/2022 08:25:00 AM
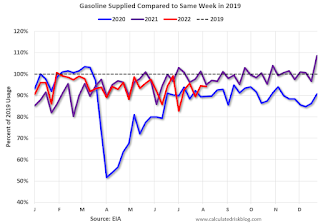
These indicators are mostly for travel and entertainment. It is interesting to watch these sectors recover as the pandemic subsides. Notes: I've added back gasoline supplied to see if there is an impact from higher gasoline prices.
The TSA is providing daily travel numbers.
This data is as of August 21st.
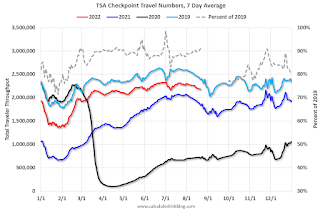 Click on graph for larger image.
This data shows the 7-day average of daily total traveler throughput from the TSA for 2019 (Light Blue), 2020 (Black), 2021 (Blue) and 2022 (Red).
The dashed line is the percent of 2019 for the seven-day average.
The 7-day average is down 9.1% from the same day in 2019 (90.9% of 2019). (Dashed line)
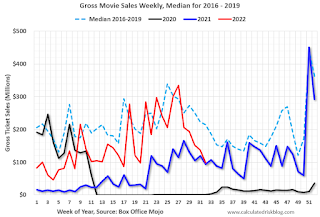 This data shows domestic box office for each week and the median for the years 2016 through 2019 (dashed light blue).
 Note that the data is usually noisy week-to-week and depends on when blockbusters are released.
Movie ticket sales were at $99 million last week, down about 54% from the median for the week.
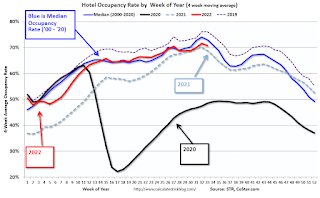 This graph shows the seasonal pattern for the hotel occupancy rate using the four-week average.
 The red line is for 2022, black is 2020, blue is the median, and dashed light blue is for 2021. Dashed purple is 2019 (STR is comparing to a strong year for hotels).
This data is through August 13th. The occupancy rate was down 4.6% compared to the same week in 2019.
Notes: Y-axis doesn't start at zero to better show the seasonal change.
Blue is for 2020. Purple is for 2021, and Red is for 2022.
As of August 12th, gasoline supplied was down 5.9% compared to the same week in 2019.
Recently gasoline supplied has been running somewhat below 2019 and 2021 levels.
Sunday, August 21, 2022
Sunday Night Futures
by Calculated Risk on 8/21/2022 07:03:00 PM
Weekend:
• Schedule for Week of August 21, 2022
Monday:
• At 8:30 AM ET, Chicago Fed National Activity Index for July. This is a composite index of other data.
From CNBC: Pre-Market Data and Bloomberg futures S&P 500 are down 11 and DOW futures are down 63 (fair value).
Oil prices were down over the last week with WTI futures at $89.62 per barrel and Brent at $95.60 per barrel. A year ago, WTI was at $62, and Brent was at $66 - so WTI oil prices are up 45% year-over-year.
Here is a graph from Gasbuddy.com for nationwide gasoline prices. Nationally prices are at $3.86 per gallon. A year ago, prices were at $3.14 per gallon, so gasoline prices are up $0.72 per gallon year-over-year.
Used Vehicle Wholesale Prices Decreased 3.6% in First Half of August; Goldman Sees Sharp Decline in User Car PCE Inflation
by Calculated Risk on 8/21/2022 11:01:00 AM
First, from Goldman Sachs economists:
One wildcard for the core goods outlook is used car prices—particularly after the 3.6% drop in Manheim used car auction prices in the first half of August (mom sa). Coupled with the July rebound in auto production to late 2020 levels, we now expect used car PCE inflation to fall from +4% in June to -11% year-on-year in DecemberFrom Manheim Consulting: Wholesale Used-Vehicle Prices Decline in First Half of August
Wholesale used-vehicle prices (on a mix-, mileage-, and seasonally adjusted basis) declined 3.6% from July in the first 15 days of August. The Manheim Used Vehicle Value Index fell to 211.6, which was up 8.8% from August 2021. The non-adjusted price change in the first half of August was a decline of 2.0% compared to July, leaving the unadjusted average price up 6.6% year over year.
emphasis added
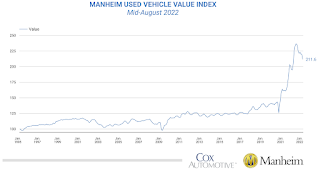 Click on graph for larger image.
This index from Manheim Consulting is based on all completed sales transactions at Manheim’s U.S. auctions.

