by Calculated Risk on 8/28/2022 08:31:00 AM
Sunday, August 28, 2022
Hotels: Occupancy Rate Down 2.8% Compared to Same Week in 2019
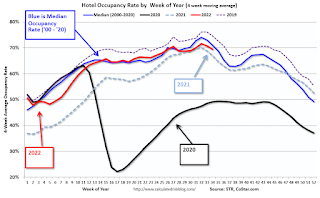
Occupancy for the week ending Aug. 20 was 67.3%, 1.2 percentage points lower than the previous week. Nominal average daily rate fell 1.1% week over week to $151, which is 17% higher than in 2019 and 10% greater than a year ago. Nominal revenue per available room contracted 2.8% week over week to $102, but remained ahead of 2019 by 12% and was up 17% from a year ago. Inflation-adjusted, or real, ADR was ahead of 2019 levels by 1%, whereas real RevPAR was below that benchmark by 3%.The following graph shows the seasonal pattern for the hotel occupancy rate using the four-week average.
...
While hotel demand — the number of room nights sold — has decreased week over week, it is only 1% lower than 2019 levels. Occupancy is 2.8 percentage points lower than in the comparable week of 2019 and 3.7 percentage points higher than a year ago. The difference between the demand and occupancy comparisons to 2019 is supply, which has increased by 2.6%. emphasis added
 Click on graph for larger image.
The red line is for 2022, black is 2020, blue is the median, and dashed light blue is for 2021. Dashed purple is 2019 (STR is comparing to a strong year for hotels).
Saturday, August 27, 2022
Real Estate Newsletter Articles this Week
by Calculated Risk on 8/27/2022 02:11:00 PM
At the Calculated Risk Real Estate Newsletter this week:
• New Home Sales Decrease Sharply, Record Months of Unsold Inventory Under Construction
• The Sellers Strike and Housing Inventory
• Update: Housing Completions will Increase Sharply in Late 2022 and Early 2023
• Final Look at Local Housing Markets in July
• Black Knight: Median House Prices Declined in July; First Decline in 32 Months
This is usually published 4 to 6 times a week and provides more in-depth analysis of the housing market.
You can subscribe at https://calculatedrisk.substack.com/
Schedule for Week of August 28, 2022
by Calculated Risk on 8/27/2022 08:11:00 AM
The key report this week is the August employment report on Friday.
Other key indicators include the August ISM manufacturing index, August auto sales, and Case-Shiller house prices for June.
10:30 AM: Dallas Fed Survey of Manufacturing Activity for August. This is the last of the regional Fed manufacturing surveys for August.
 9:00 AM: S&P/Case-Shiller House Price Index for June.
This graph shows the year-over-year change in the seasonally adjusted National Index, Composite 10 and Composite 20 indexes through the most recent report (the Composite 20 was started in January 2000).
The consensus is for a 20.6% year-over-year increase in the Comp 20 index for June.
9:00 AM: FHFA House Price Index for June. This was originally a GSE only repeat sales, however there is also an expanded index.
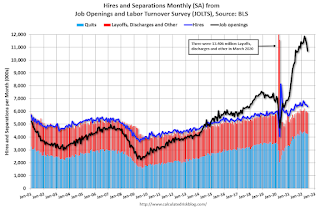 10:00 AM ET: Job Openings and Labor Turnover Survey for July from the BLS.
 This graph shows job openings (yellow line), hires (purple), Layoff, Discharges and other (red column), and Quits (light blue column) from the JOLTS.
Jobs openings decreased in June to 10.698 million from 11.303 million in May.
The number of job openings (black) were up 9% year-over-year and Quits were up 5% year-over-year.
7:00 AM ET: The Mortgage Bankers Association (MBA) will release the results for the mortgage purchase applications index.
8:15 AM: The ADP Employment Report for August. This report is for private payrolls only (no government). This is the first release of a new methodology.
9:45 AM: Chicago Purchasing Managers Index for August.
8:30 AM: The initial weekly unemployment claims report will be released. The consensus is for an increase to 250 thousand from 243 thousand last week.
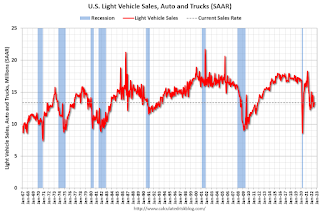 All Day: Light vehicle sales for August. The consensus is for light vehicle sales to be 13.6 million SAAR in August, up from 13.34 million in July (Seasonally Adjusted Annual Rate).
This graph shows light vehicle sales since the BEA started keeping data in 1967. The dashed line is the current sales rate.
10:00 AM: ISM Manufacturing Index for August. The consensus is for the ISM to be at 52,1, down from 52.8 in July.
10:00 AM: Construction Spending for July. The consensus is for a 0.1% decrease in construction spending.
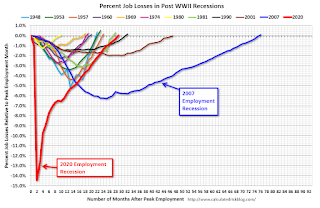 8:30 AM: Employment Report for August. The consensus is for 280,000 jobs added, and for the unemployment rate to be unchanged at 3.5%.
There were 528,000 jobs added in July, and the unemployment rate was at 3.5%.
This graph shows the job losses from the start of the employment recession, in percentage terms.
The current employment recession was by far the worst recession since WWII in percentage terms. However, 29 months after the onset of the current employment recession, all of the jobs have returned.
Friday, August 26, 2022
COVID August 26, 2022, Update on Cases, Hospitalizations and Deaths
by Calculated Risk on 8/26/2022 09:16:00 PM
On COVID (focus on hospitalizations and deaths):
| COVID Metrics | ||||
|---|---|---|---|---|
| Now | Week Ago | Goal | ||
| New Cases per Day2 | 88,594 | 95,609 | ≤5,0001 | |
| Hospitalized2 | 32,403 | 35,061 | ≤3,0001 | |
| Deaths per Day2 | 392 | 438 | ≤501 | |
| 1my goals to stop daily posts, 27-day average for Cases, Currently Hospitalized, and Deaths 🚩 Increasing 7-day average week-over-week for Cases, Hospitalized, and Deaths ✅ Goal met. | ||||
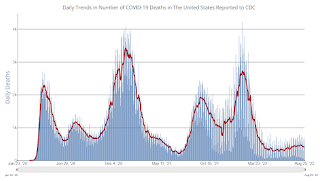 Click on graph for larger image.
This graph shows the daily (columns) and 7-day average (line) of deaths reported.
Black Knight: Median House Prices Declined in July; First Decline in 32 Months
by Calculated Risk on 8/26/2022 03:12:00 PM
Today, in the Calculated Risk Real Estate Newsletter: Black Knight: Median House Prices Declined in July; First Decline in 32 Months
A brief excerpt:
Important caveats: In normal times, median house prices flatten or decline seasonally in the 2nd half of the year. So, a decline in July isn’t unusual.There is much more in the article. You can subscribe at https://calculatedrisk.substack.com/
Also, the median price is distorted by the mix of homes sold. The repeat sales indexes - like Case-Shiller and FHFA - are better measures of house price movements, but median prices can be a leading indicator of price changes.
...
From Andy Walden at Black Knight: Something Had to Give: Home Prices Down for First Time In 32 Months
Annual home price growth still clocked in at 14.3% – more than three times the long-run average – but most of that appreciation occurred in the last months of 2021 and earlier this year. Such strong annual growth rates can hide underlying weakness. Month-over-month data gives us a much clearer picture of just how much – and how quickly – the housing market has shifted.
The median home price fell by 0.77% in July, the largest single-month drop since January 2011. On a seasonally adjusted basis, July’s dip ranked among the 10 largest monthly declines on record, dating back more than 30 years.
Q3 GDP Forecasts: Around 1%
by Calculated Risk on 8/26/2022 12:33:00 PM
From BofA:
[W]e continue to track 3Q GDP at 0.5% q/q saar [August 26 estimate]From Goldman:
emphasis added
The personal consumption details were softer than our previous assumptions, and we lowered our Q3 GDP tracking estimate by 0.2pp to +1.0% (qoq ar). [August 26 estimate]And from the Altanta Fed: GDPNow
The GDPNow model estimate for real GDP growth (seasonally adjusted annual rate) in the third quarter of 2022 is 1.6 percent on August 26, up from 1.4 percent on August 24. After this morning's releases from the US Census Bureau and the US Bureau of Economic Analysis, an increase in the nowcast of third-quarter real net exports was partially offset by a decrease in the nowcast of third-quarter real personal consumption expenditures and third-quarter real gross private domestic investment. [August 26 estimate]
Fed Chair Powell: "Higher interest rates ... will also bring some pain to households and businesses"
by Calculated Risk on 8/26/2022 10:06:00 AM
From Fed Chair Powell: Monetary Policy and Price Stability (watch on YouTube here)
Excerpt:
Restoring price stability will take some time and requires using our tools forcefully to bring demand and supply into better balance. Reducing inflation is likely to require a sustained period of below-trend growth. Moreover, there will very likely be some softening of labor market conditions. While higher interest rates, slower growth, and softer labor market conditions will bring down inflation, they will also bring some pain to households and businesses. These are the unfortunate costs of reducing inflation. But a failure to restore price stability would mean far greater pain.
...
July's increase in the target range was the second 75 basis point increase in as many meetings, and I said then that another unusually large increase could be appropriate at our next meeting. We are now about halfway through the intermeeting period. Our decision at the September meeting will depend on the totality of the incoming data and the evolving outlook. At some point, as the stance of monetary policy tightens further, it likely will become appropriate to slow the pace of increases.
Restoring price stability will likely require maintaining a restrictive policy stance for some time. The historical record cautions strongly against prematurely loosening policy.
Personal Income increased 0.2% in July; Spending increased 0.1%
by Calculated Risk on 8/26/2022 08:36:00 AM
The BEA released the Personal Income and Outlays report for July:
Personal income increased $47.0 billion (0.2 percent) in July, according to estimates released today by the Bureau of Economic Analysis. Disposable personal income (DPI) increased $37.6 billion (0.2 percent) and personal consumption expenditures (PCE) increased $23.7 billion (0.1 percent).The July PCE price index increased 6.3 percent year-over-year (YoY), down from 6.8 percent YoY in June.
The PCE price index decreased 0.1 percent. Excluding food and energy, the PCE price index increased 0.1 percent. Real DPI increased 0.3 percent in July and real PCE increased 0.2 percent; goods increased 0.2 percent and services increased 0.2 percent.
emphasis added
The following graph shows real Personal Consumption Expenditures (PCE) through July 2022 (2012 dollars). Note that the y-axis doesn't start at zero to better show the change.
 Click on graph for larger image.
The dashed red lines are the quarterly levels for real PCE.
Personal income and PCE were below expectations.
Thursday, August 25, 2022
Friday: Personal Income & Outlays, Fed Chair Powell
by Calculated Risk on 8/25/2022 09:08:00 PM
Friday:
• At 8:30 AM ET, Personal Income and Outlays, July 2022. The consensus is for a 0.6% increase in personal income, and for a 0.4% increase in personal spending. And for the Core PCE price index to increase 0.3%. PCE prices are expected to be up 6.4% YoY, and core PCE prices up 4.7% YoY.
• At 10:00 AM, Speech, Fed Chair Jerome Powell, Economic Outlook, At the Jackson Hole Economic Policy Symposium
• Also at 10:00 AM, University of Michigan's Consumer sentiment index (Final for August). The consensus is for a reading of 55.1.
On COVID (focus on hospitalizations and deaths):
| COVID Metrics | ||||
|---|---|---|---|---|
| Now | Week Ago | Goal | ||
| New Cases per Day2 | 90,675 | 97,183 | ≤5,0001 | |
| Hospitalized2 | 32,903 | 35,314 | ≤3,0001 | |
| Deaths per Day2 | 389 | 441 | ≤501 | |
| 1my goals to stop daily posts, 27-day average for Cases, Currently Hospitalized, and Deaths 🚩 Increasing 7-day average week-over-week for Cases, Hospitalized, and Deaths ✅ Goal met. | ||||
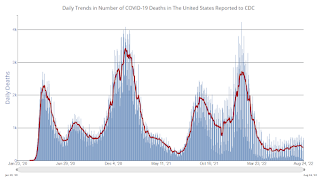 Click on graph for larger image.
This graph shows the daily (columns) and 7-day average (line) of deaths reported.
Freddie Mac: Mortgage Serious Delinquency Rate decreased in July
by Calculated Risk on 8/25/2022 07:31:00 PM
Freddie Mac reported that the Single-Family serious delinquency rate in July was 0.73%, down from 0.76% June. Freddie's rate is down year-over-year from 1.74% in July 2021.
Freddie's serious delinquency rate peaked in February 2010 at 4.20% following the housing bubble and peaked at 3.17% in August 2020 during the pandemic.
These are mortgage loans that are "three monthly payments or more past due or in foreclosure".

Mortgages in forbearance are being counted as delinquent in this monthly report but are not reported to the credit bureaus.
This is very different from the increase in delinquencies following the housing bubble. Lending standards have been fairly solid over the last decade, and most of these homeowners have equity in their homes - and they will be able to restructure their loans once they are employed.


