 RSS Feed
 by Calculated Risk on 8/31/2022 11:13:00 AM
Wednesday, August 31, 2022
Inflation Adjusted House Prices Declined in June
Today, in the Calculated Risk Real Estate Newsletter: Inflation Adjusted House Prices Declined in June
Excerpt:
It has been over 16 years since the bubble peak. In the Case-Shiller release yesterday, the seasonally adjusted National Index (SA), was reported as being 66% above the bubble peak in 2006. However, in real terms, the National index (SA) is about 16% above the bubble peak (and historically there has been an upward slope to real house prices). The composite 20, in real terms, is about 7% above the bubble peak.
People usually graph nominal house prices, but it is also important to look at prices in real terms (inflation adjusted). As an example, if a house price was $200,000 in January 2000, the price would be almost $339,000 today adjusted for inflation (69.5% increase). That is why the second graph below is important - this shows "real" prices (adjusted for inflation). ...
The second graph shows the same two indexes in real terms (adjusted for inflation using CPI less Shelter). Note: some people use other inflation measures to adjust for real prices. In real terms, the National index is 14.6% above the bubble peak, and the Composite 20 index is 6.1% above the bubble peak in early 2006.
Note that real prices declined in June, with nominal prices increasing less than inflation.

There is much more in the article. You can subscribe at https://calculatedrisk.substack.com/
ADP: Private Employment Increased 132,000 in August
by Calculated Risk on 8/31/2022 08:27:00 AM
Note: This is the first release of a new methodology. Historical data based on the new methodology is available.
From ADP: ADP National Employment Report: Private Sector Employment Increased by
132,000 Jobs in August; Annual Pay was Up 7.6%
Private sector employment increased by 132,000 jobs in August and annual pay was up 7.6% according to the August ADP® National Employment ReportTM produced by the ADP Research Institute® in collaboration with the Stanford Digital Economy Lab (“Stanford Lab”).The BLS report will be released Friday, and the consensus is for 280 thousand non-farm payroll jobs added in August.
The jobs report and pay insights use ADP’s fine-grained anonymized and aggregated payroll data of over 25 million U.S. employees to provide a representative picture of the labor market. The report details the current month’s total private employment change, and weekly job data from the previous month. ADP’s pay measure uniquely captures the earnings of a cohort of almost 10 million employees over a 12-month period.
“Our data suggests a shift toward a more conservative pace of hiring, possibly as companies try to decipher the economy's conflicting signals,” said Nela Richardson, chief economist, ADP. “We could be at an inflection point, from super-charged job gains to something more normal.”
emphasis added
MBA: Mortgage Applications Decrease in Latest Weekly Survey
by Calculated Risk on 8/31/2022 07:00:00 AM
From the MBA: Mortgage Applications Decrease in Latest MBA Weekly Survey
Mortgage applications decreased 3.7 percent from one week earlier, according to data from the Mortgage Bankers Association’s (MBA) Weekly Mortgage Applications Survey for the week ending August 26, 2022.
... The Refinance Index decreased 8 percent from the previous week and was 83 percent lower than the same week one year ago. The seasonally adjusted Purchase Index decreased 2 percent from one week earlier. The unadjusted Purchase Index decreased 4 percent compared with the previous week and was 23 percent lower than the same week one year ago.
“The 30-year fixed mortgage rate increased for the second week in a row to 5.80 percent, reaching its highest level since mid-July. Mortgage rates and Treasury yields rose last week as Federal Reserve officials indicated that short-term rates would stay higher for longer. Mortgage rates have been volatile over the past month, bouncing between 5.4 percent and 5.8 percent,” said Joel Kan, MBA’s Associate Vice President of Economic and Industry Forecasting. “In another sign that market volatility has picked up, the average rate on a jumbo loan was 5.32 percent, 48 basis points lower than for a conforming loan. This spread reached a high of over 50 basis points in July – and had narrowed – before now widening again.”
Added Kan, “Application volume dropped and remained at a multi-decade low last week, led by an 8 percent decline in refinance applications, which now make up only 30 percent of all applications. Purchase applications have declined in eight of the last nine weeks, as demand continues to shrink due to higher rates and a weaker economic outlook. However, rising inventories and slower home-price growth could potentially bring some buyers back into the market later this year.”
...
The average contract interest rate for 30-year fixed-rate mortgages with conforming loan balances ($647,200 or less) increased to 5.80 percent from 5.65 percent, with points increasing to 0.71 from 0.68 (including the origination fee) for 80 percent loan-to-value ratio (LTV) loans.
emphasis added
 Click on graph for larger image.
The first graph shows the refinance index since 1990.
With higher mortgage rates, the refinance index has declined sharply over the last several months.
The refinance index is at the lowest level since the year 2000.
The second graph shows the MBA mortgage purchase index
 According to the MBA, purchase activity is down 23% year-over-year unadjusted.
The purchase index is now only 9% above the pandemic low.
Note: Red is a four-week average (blue is weekly).
Note: Red is a four-week average (blue is weekly).
Tuesday, August 30, 2022
Wednesday: ADP Employment, Chicago PMI
by Calculated Risk on 8/30/2022 09:00:00 PM
Wednesday:
• At 7:00 AM ET, The Mortgage Bankers Association (MBA) will release the results for the mortgage purchase applications index.
• At 8:15 AM, The ADP Employment Report for August. This report is for private payrolls only (no government). This is the first release of a new methodology.
• At 9:45 AM, Chicago Purchasing Managers Index for August.
On COVID (focus on hospitalizations and deaths):
| COVID Metrics | ||||
|---|---|---|---|---|
| Now | Week Ago | Goal | ||
| New Cases per Day2 | 82,475 | 91,792 | ≤5,0001 | |
| Hospitalized2 | 31,601 | 33,900 | ≤3,0001 | |
| Deaths per Day2 | 387 | 433 | ≤501 | |
| 1my goals to stop daily posts, 27-day average for Cases, Currently Hospitalized, and Deaths 🚩 Increasing 7-day average week-over-week for Cases, Hospitalized, and Deaths ✅ Goal met. | ||||
 Click on graph for larger image.
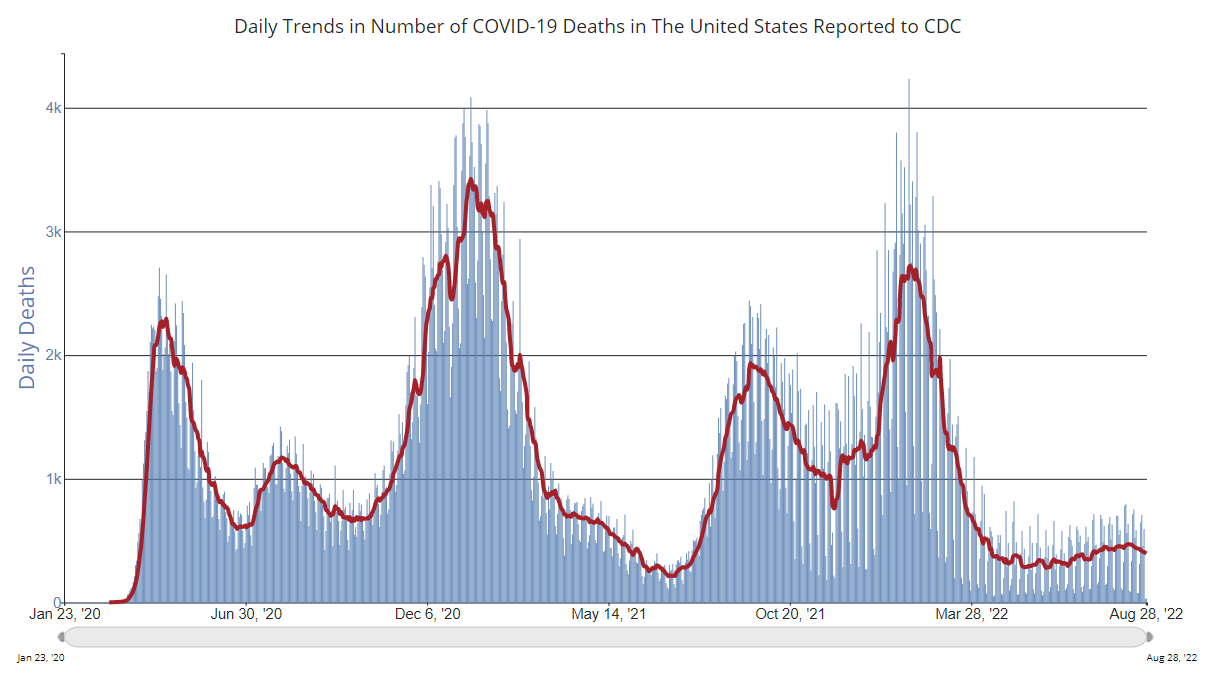
This graph shows the daily (columns) and 7-day average (line) of deaths reported.
Average daily deaths bottomed in July 2021 at 214 per day.
Las Vegas July 2022: Visitor Traffic Down 5.3% Compared to 2019
by Calculated Risk on 8/30/2022 02:08:00 PM
Note: I like using Las Vegas as a measure of recovery for both leisure (visitors) and business (conventions).
From the Las Vegas Visitor Authority: July 2022 Las Vegas Visitor Statistics
July saw the highest monthly visitation since the start of the pandemic, reaching nearly 3.5M visitors for the month, up 5.7% YoY and just 5.3% below the July 2019 tally.
Overall hotel occupancy reached 83.4%, 4.0 pts ahead of last July but down 7.7 pts vs. July 2019. Weekend occupancy exceeded 91% (up 3.0 pts YoY but down 6.1 pts vs. July 2019), while Midweek occupancy reached 79.1% (up 4.5 pts YoY but down 9.6 pts vs. July 2019).
ADR exceeded $160, 5.5% ahead of last July and over 26% above July 2019 while RevPAR approached $134 for the month, +10.8% YoY and +15.7% over July 2019
 Click on graph for larger image.
 The first graph shows visitor traffic for 2019 (dark blue), 2020 (light blue), 2021 (yellow) and 2022 (red)
Visitor traffic was down 5.3% compared to the same month in 2019.
Visitor traffic was up 5.7% compared to last July.
The second graph shows convention traffic.
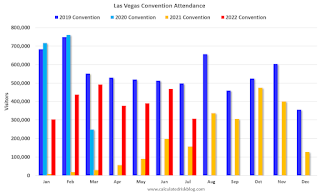
Convention traffic was down 38.4% compared to July 2019.The second graph shows convention traffic.

Note: There was almost no convention traffic from April 2020 through May 2021.
Comments on June Case-Shiller and FHFA House Price Increases
by Calculated Risk on 8/30/2022 10:16:00 AM
Today, in the Calculated Risk Real Estate Newsletter: Case-Shiller National House Price Index "Decelerated" to 18.0% year-over-year increase in June
Excerpt:
Both the Case-Shiller House Price Index (HPI) and the Federal Housing Finance Agency (FHFA) HPI for June were released today. Here is a graph of the month-over-month (MoM) change in the Case-Shiller National Index Seasonally Adjusted (SA).
The Case-Shiller Home Price Indices for “June” is a 3-month average of April, May and June closing prices. June closing prices include some contracts signed in February, so there is a significant lag to this data.
The MoM increase in Case-Shiller was at 0.33%. This was the smallest MoM increase since June 2020, and since this includes closings in April and May, this suggests price growth stalled in June.
On a seasonally adjusted basis, prices declined in 7 of the 20 Case-Shiller cities: Seattle, San Francisco, San Diego, Portland, Los Angeles, Denver and Washington, DC all saw price declines in the June report.

There is much more in the article. You can subscribe at https://calculatedrisk.substack.com/
BLS: Job Openings "Little Changed" at 11.2 million in July
by Calculated Risk on 8/30/2022 10:06:00 AM
From the BLS: Job Openings and Labor Turnover Summary
The number of job openings was little changed at 11.2 million on the last business day of July, the U.S. Bureau of Labor Statistics reported today. Hires and total separations were little changed at 6.4 million and 5.9 million, respectively. Within separations, quits (4.2 million) and layoffs and discharges (1.4 million) were little changed.The following graph shows job openings (black line), hires (dark blue), Layoff, Discharges and other (red column), and Quits (light blue column) from the JOLTS.
emphasis added
This series started in December 2000.
Note: The difference between JOLTS hires and separations is similar to the CES (payroll survey) net jobs headline numbers. This report is for July, the employment report this Friday will be for August.
 Click on graph for larger image.
Note that hires (dark blue) and total separations (red and light blue columns stacked) are usually pretty close each month. This is a measure of labor market turnover. When the blue line is above the two stacked columns, the economy is adding net jobs - when it is below the columns, the economy is losing jobs.
The spike in layoffs and discharges in March 2020 is labeled, but off the chart to better show the usual data.
Jobs openings increased in July to 11.239 million from 11.040 million in June.
The number of job openings (black) were up 4% year-over-year.
Quits were up 2% year-over-year. These are voluntary separations. (See light blue columns at bottom of graph for trend for "quits").
Case-Shiller: National House Price Index "Decelerated" to 18.0% year-over-year increase in June
by Calculated Risk on 8/30/2022 09:12:00 AM
S&P/Case-Shiller released the monthly Home Price Indices for June ("June" is a 3-month average of April, May and June closing prices).
This release includes prices for 20 individual cities, two composite indices (for 10 cities and 20 cities) and the monthly National index.
From S&P: S&P Corelogic Case-Shiller Index Decelerated in June
The S&P CoreLogic Case-Shiller U.S. National Home Price NSA Index, covering all nine U.S. census divisions, reported an 18.0% annual gain in June, down from 19.9% in the previous month. The 10-City Composite annual increase came in at 17.4%, down from 19.1% in the previous month. The 20-City Composite posted an 18.6% year-over-year gain, down from 20.5% in the previous month.
Tampa, Miami, and Dallas reported the highest year-over-year gains among the 20 cities in June. Tampa led the way with a 35.0% year-over-year price increase, followed by Miami in second with a 33.0% increase, and Dallas in third with a 28.2% increase. Only one of the 20 cities reported higher price increases in the year ending June 2022 versus the year ending May 2022.
...
Before seasonal adjustment, the U.S. National Index posted a 0.6% month-over-month increase in June, while the 10-City and 20-City Composites both posted increases of 0.4%.
After seasonal adjustment, the U.S. National Index posted a month-over-month increase of 0.3%, and the 10-City and 20-City Composites posted increases of 0.3% and 0.4%, respectively.
In June, 13 cities reported increases before and after seasonal adjustments.
“The deceleration in U.S. housing prices that we began to observe several months ago continued in June 2022, as the National Composite Index rose by 18.0% on a year-over-year basis,” says Craig J. Lazzara, Managing Director at S&P DJI. “Relative to May’s 19.9% gain (and April’s 20.6%), prices are clearly increasing at a slower rate. This pattern is consistent with our 10-City Composite (up 17.4% in June vs. 19.1% in May) and our 20-City Composite (up 18.6% in June vs. 20.5% in May). It’s important to bear in mind that deceleration and decline are two entirely different things, and that prices are still rising at a robust clip. June’s growth rates for all three composites are at or above the 95th percentile of historical experience. For the first six months of 2022, in fact, the National Composite is up 10.6%. In the last 35 years, only four complete years have witnessed increases that large."
emphasis added
 Click on graph for larger image.
 The first graph shows the nominal seasonally adjusted Composite 10, Composite 20 and National indices (the Composite 20 was started in January 2000).
The Composite 10 index is up 0.3% in June (SA).
The Composite 20 index is up 0,4% (SA) in June.
The National index is 66% above the bubble peak (SA), and up 0.3% (SA) in June. The National index is up 136% from the post-bubble low set in February 2012 (SA).
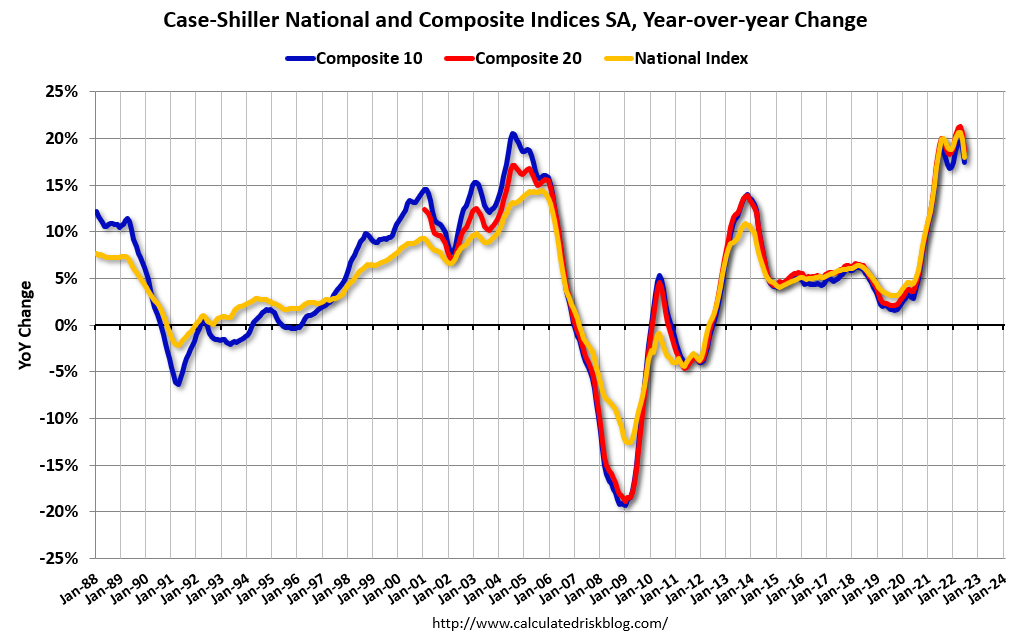 The second graph shows the year-over-year change in all three indices.
The Composite 10 SA is up 17.4% year-over-year. The Composite 20 SA is up 18.6% year-over-year.
The National index SA is up 18.0% year-over-year.
Price increases were lower than expectations. I'll have more later.
Monday, August 29, 2022
Pace of Rent Increases Continues to Slow
by Calculated Risk on 8/29/2022 11:39:00 PM
Today, in the Calculated Risk Real Estate Newsletter: Pace of Rent Increases Continues to Slow
A brief excerpt:
Here is a graph of the year-over-year (YoY) change for these measures since January 2015. All of these measures are through July 2022 (Apartment List through August 2022).There is much more in the article. You can subscribe at https://calculatedrisk.substack.com/
Note that new lease measures (Zillow, Apartment List) dipped early in the pandemic, whereas the BLS measures were steady. Then new leases took off, and the BLS measures are picking up.
...
The Zillow measure is up 13.2% YoY in July, down from 14.9% YoY in June. This is down from a peak of 17.2% YoY in February.
The ApartmentList measure is up 10.0% YoY as of August, down from 12.3% in July. This is down from the peak of 18.0% YoY last November.
Rents are still increasing, and we should expect this to continue to spill over into measures of inflation in 2022. The Owners’ Equivalent Rent (OER) was up 5.8% YoY in July, from 5.5% YoY in June - and will likely increase further in the coming months.
...
My suspicion is rent increases will slow further over the coming months as the pace of household formation slows, and more supply comes on the market. For example, the National Multifamily Housing Council (NMHC) recently reported that markets tightness only increased slightly in their July survey.

Tuesday: Case-Shiller House Prices, Job Openings
by Calculated Risk on 8/29/2022 09:01:00 PM
Tuesday:
• At 9:00 AM ET, S&P/Case-Shiller House Price Index for June. The consensus is for a 20.6% year-over-year increase in the Comp 20 index for June.
• Also at 9:00 AM, FHFA House Price Index for June. This was originally a GSE only repeat sales, however there is also an expanded index.
• At 10:00 AM, Job Openings and Labor Turnover Survey for July from the BLS.
On COVID (focus on hospitalizations and deaths):
| COVID Metrics | ||||
|---|---|---|---|---|
| Now | Week Ago | Goal | ||
| New Cases per Day2 | 82,044 | 94,012 | ≤5,0001 | |
| Hospitalized2 | 29,548 | 34,153 | ≤3,0001 | |
| Deaths per Day2 | 396 | 436 | ≤501 | |
| 1my goals to stop daily posts, 27-day average for Cases, Currently Hospitalized, and Deaths 🚩 Increasing 7-day average week-over-week for Cases, Hospitalized, and Deaths ✅ Goal met. | ||||
 Click on graph for larger image.
This graph shows the daily (columns) and 7-day average (line) of deaths reported.
Average daily deaths bottomed in July 2021 at 214 per day.


