 RSS Feed
 by Calculated Risk on 9/05/2022 08:21:00 AM
Monday, September 05, 2022
Four High Frequency Indicators for the Economy
These indicators are mostly for travel and entertainment. It is interesting to watch these sectors recover as the pandemic subsides. Notes: I've added back gasoline supplied to see if there is an impact from higher gasoline prices.
The TSA is providing daily travel numbers.
This data is as of September 4th.
 Click on graph for larger image.
This data shows the 7-day average of daily total traveler throughput from the TSA for 2019 (Light Blue), 2020 (Black), 2021 (Blue) and 2022 (Red).
The dashed line is the percent of 2019 for the seven-day average.
The 7-day average is down 3.4% from the same day in 2019 (90.9% of 2019). (Dashed line)
Air travel - as a percent of 2019 - had been moving sideways over the last several months, off about 10% from 2019. Travel has picked up recently, compared to 2019, perhaps due to the timing of Labor Day.
 This data shows domestic box office for each week and the median for the years 2016 through 2019 (dashed light blue).
 Black is 2020, Blue is 2021 and Red is 2022.
The data is from BoxOfficeMojo through September 1st.
Note that the data is usually noisy week-to-week and depends on when blockbusters are released.
Movie ticket sales were at $78 million last week, down about 53% from the median for the week.
Note that the data is usually noisy week-to-week and depends on when blockbusters are released.
Movie ticket sales were at $78 million last week, down about 53% from the median for the week.
 This graph shows the seasonal pattern for the hotel occupancy rate using the four-week average.
 The red line is for 2022, black is 2020, blue is the median, and dashed light blue is for 2021. Dashed purple is 2019 (STR is comparing to a strong year for hotels).
This data is through August 27th. The occupancy rate was down 2.5% compared to the same week in 2019.
The 4-week average of the occupancy rate is close to the median rate for the previous 20 years (Blue).
Notes: Y-axis doesn't start at zero to better show the seasonal change.
Notes: Y-axis doesn't start at zero to better show the seasonal change.

This graph, based on weekly data from the U.S. Energy Information Administration (EIA), shows gasoline supplied compared to the same week of 2019.
Blue is for 2020. Purple is for 2021, and Red is for 2022.
As of August 26th, gasoline supplied was down 13.2% compared to the same week in 2019.
Recently gasoline supplied has been running below 2019 and 2021 levels - and sometimes below 2020.
Sunday, September 04, 2022
Hotels: Occupancy Rate Down 2.5% Compared to Same Week in 2019
by Calculated Risk on 9/04/2022 09:01:00 AM
From CoStar: STR: US Hotel Performance Closes August a Bit Mixed
U.S. hotel performance came in lower than the previous week and showed mixed comparisons with 2019, according to STR‘s latest data through Aug. 27.The following graph shows the seasonal pattern for the hotel occupancy rate using the four-week average.
Aug. 21-27, 2022 (percentage change from comparable week in 2019*):
• Occupancy: 65.0% (-2.5%)
• Average daily rate (ADR): $147.16 (+15.0%)
• Revenue per available room (RevPAR): $95.62 (+12.1%)
*Due to the pandemic impact, STR is measuring recovery against comparable time periods from 2019.
emphasis added
Click on graph for larger image.The red line is for 2022, black is 2020, blue is the median, and dashed light blue is for 2021. Dashed purple is 2019 (STR is comparing to a strong year for hotels).
The 4-week average of the occupancy rate is close to the median rate for the previous 20 years (Blue).
Note: Y-axis doesn't start at zero to better show the seasonal change.
The 4-week average of the occupancy rate has peaked seasonally and will now decline into the Fall.
Saturday, September 03, 2022
Real Estate Newsletter Articles this Week
by Calculated Risk on 9/03/2022 02:11:00 PM
At the Calculated Risk Real Estate Newsletter this week:
• Case-Shiller National House Price Index "Decelerated" to 18.0% year-over-year increase in June
• Inflation Adjusted House Prices Declined in June
• Pace of Rent Increases Continues to Slow
• Will House Prices Decline Nationally?
• Active vs Total Existing Home Inventory
• 30-Year Mortgage Rates Pushing 6% Again
This is usually published 4 to 6 times a week and provides more in-depth analysis of the housing market.
You can subscribe at https://calculatedrisk.substack.com/
Most content is available for free (and no Ads), but please subscribe!
Schedule for Week of September 4, 2022
by Calculated Risk on 9/03/2022 08:11:00 AM
This will be a light week for economic data.
All US markets will be closed in observance of the Labor Day holiday.
8:00 AM ET: Corelogic House Price index for July
10:00 AM: the ISM Services Index for August. The consensus is for a reading of 55.5, down from 56.7.
7:00 AM ET: The Mortgage Bankers Association (MBA) will release the results for the mortgage purchase applications index.
 8:30 AM: Trade Balance report for July from the Census Bureau.
 This graph shows the U.S. trade deficit, with and without petroleum, through the most recent report. The blue line is the total deficit, and the black line is the petroleum deficit, and the red line is the trade deficit ex-petroleum products.
The consensus is for the U.S. trade deficit to be $70.5 billion in July, from $79.6 billion in June.
At 12:35 PM: Speech, Fed Vice Chair Brainard, Economic Outlook and Monetary Policy, At The Clearing House and Bank Policy Institute Annual Conference, New York, N.Y.
2:00 PM: the Federal Reserve Beige Book, an informal review by the Federal Reserve Banks of current economic conditions in their Districts.
8:30 AM: The initial weekly unemployment claims report will be released. The consensus is for an increase to 240 thousand from 232 thousand last week.
9:10AM: Discussion, Fed Chair Powell, At the Cato Institute’s 40th Annual Monetary Conference
12:00 PM: Q2 Flow of Funds Accounts of the United States from the Federal Reserve.
Friday, September 02, 2022
COVID Sept 2, 2022, Update on Cases, Hospitalizations and Deaths
by Calculated Risk on 9/02/2022 09:09:00 PM
On COVID (focus on hospitalizations and deaths):
| COVID Metrics | ||||
|---|---|---|---|---|
| Now | Week Ago | Goal | ||
| New Cases per Day2 | 83,939 | 91,017 | ≤5,0001 | |
| Hospitalized2 | 31,020 | 33,091 | ≤3,0001 | |
| Deaths per Day2 | 407 | 422 | ≤501 | |
| 1my goals to stop daily posts, 27-day average for Cases, Currently Hospitalized, and Deaths 🚩 Increasing 7-day average week-over-week for Cases, Hospitalized, and Deaths ✅ Goal met. | ||||
 Click on graph for larger image.
This graph shows the daily (columns) and 7-day average (line) of deaths reported.
Average daily deaths bottomed in July 2021 at 214 per day.
Will House Prices Decline Nationally?
by Calculated Risk on 9/02/2022 02:35:00 PM
Today, in the Calculated Risk Real Estate Newsletter: Will House Prices Decline Nationally?
Excerpt:
And yesterday, in an interview with Bilal Hafeez, Ivy Zelman, CEO of Zelman & Associates forecast national house price declines of 4% in 2023, and 5% in 2024: Ivy Zelman on the Coming US Housing Crisis (price discussion starts at around 20:00)There are some mortgage guard rails that could mitigate nationally a severe downturn, and yet the magnitude of the decline for us - the 4% that we are expecting in 2023, and 5% in 2024 -I feel like it is a starting point … the speed of the declines makes us feel like that maybe that could be conservative. But we could see double digit price corrections [in the] hot markets.There are some factors arguing against national price declines. ...
But there are also factors arguing for national price declines.
There is much more in the article. You can subscribe at https://calculatedrisk.substack.com/
Q3 GDP Forecasts: Just Over 1%
by Calculated Risk on 9/02/2022 01:14:00 PM
From BofA:
Our 3Q US GDP tracking estimate rose to 1.3% q/q seasonally adjusted annualized rate (SAAR), up from from 0.5% q/q saar last wee [September 2nd estimate]From Goldman:
emphasis added
[D]ata on employment, auto sales, and factory orders caused our US 3Q GDP tracking estimate to fall by two-tenths, to 1.1% q/q saar, from 1.3% previously. [September 2nd estimate]And from the Altanta Fed: GDPNow
The GDPNow model estimate for real GDP growth (seasonally adjusted annual rate) in the third quarter of 2022 is 2.6 percent on September 1, up from 1.6 percent on August 26. [September 1st estimate]
Heavy Truck Sales Decline Slightly in August; Still Solid
by Calculated Risk on 9/02/2022 11:23:00 AM
The BEA released their estimate of vehicle sales for August this morning.
This graph shows heavy truck sales since 1967 using data from the BEA. The dashed line is the August 2022 seasonally adjusted annual sales rate (SAAR).
Heavy truck sales really collapsed during the great recession, falling to a low of 180 thousand SAAR in May 2009. Then heavy truck sales increased to a new all-time high of 570 thousand SAAR in April 2019.
 Click on graph for larger image.
Note: "Heavy trucks - trucks more than 14,000 pounds gross vehicle weight."
Heavy truck sales declined sharply at the beginning of the pandemic, falling to a low of 308 thousand SAAR in May 2020.
Heavy truck sales were at 441 thousand SAAR in August, up from 468 thousand in July, and up from 417 thousand SAAR in August 2021.
Usually, heavy truck sales decline sharply prior to a recession. Sales were reasonably solid in August.
Comments on August Employment Report
by Calculated Risk on 9/02/2022 09:16:00 AM
The headline jobs number in the August employment report was above expectations, however employment for the previous two months was revised down by 107,000, combined. The participation rate increased, pushing up the unemployment rate to 3.7%. And the employment-population ratio increased slightly.
Leisure and hospitality gained 31 thousand jobs in August. At the beginning of the pandemic, in March and April of 2020, leisure and hospitality lost 8.20 million jobs, and are now down 1.12 million jobs since February 2020. So, leisure and hospitality has now added back about 85% all of the jobs lost in March and April 2020.
Construction employment increased 16 thousand and is now 84 thousand above the pre-pandemic level.
Manufacturing added 22 thousand jobs and is now 67 thousand above the pre-pandemic level.
Earlier: August Employment Report: 315 thousand Jobs, 3.7% Unemployment Rate
In August, the year-over-year employment change was 5.84 million jobs.
Prime (25 to 54 Years Old) Participation
 Since the overall participation rate has declined due to cyclical (recession) and demographic (aging population, younger people staying in school) reasons, here is the employment-population ratio for the key working age group: 25 to 54 years old.
The 25 to 54 participation rate increased in August to 82.8% from 82.4% in July, and the 25 to 54 employment population ratio increased to 80.3% from 80.0% the previous month.
Both are close to the pre-pandemic levels and indicate almost all of the prime age workers have returned to the labor force.
Part Time for Economic Reasons
 From the BLS report:
These workers are included in the alternate measure of labor underutilization (U-6) that increased to 7.0% from 6.7% in the previous month. This is down from the record high in April 22.9% for this measure since 1994. This measure is at the same level as in February 2020 (pre-pandemic).
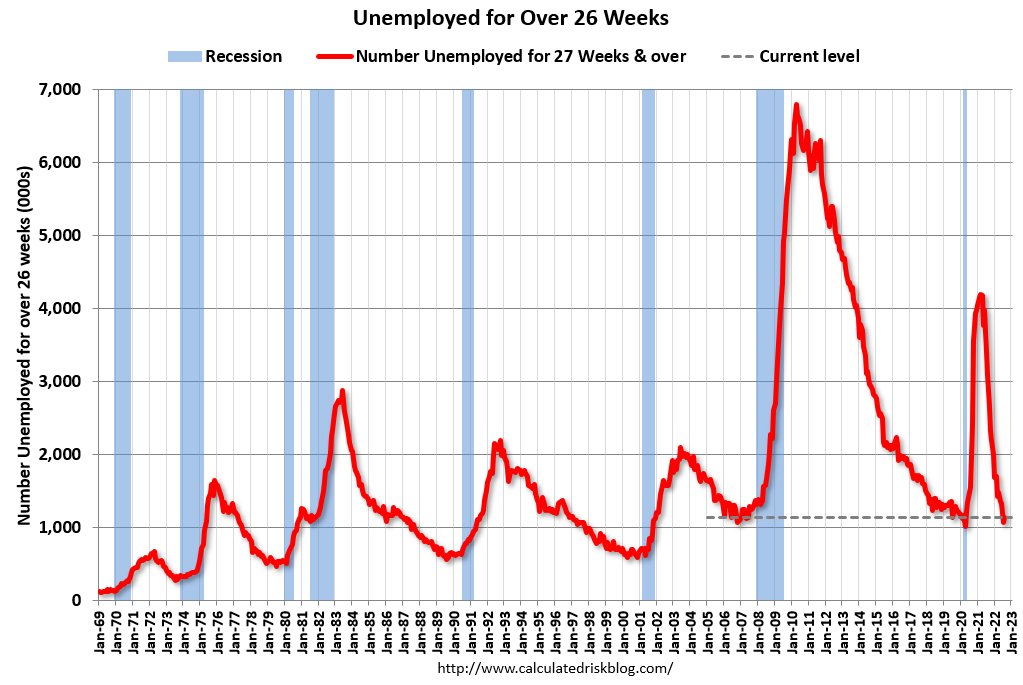
Unemployed over 26 Weeks
 This graph shows the number of workers unemployed for 27 weeks or more.
According to the BLS, there are 1.137 million workers who have been unemployed for more than 26 weeks and still want a job, up from 1.067 million the previous month.
This is back to pre-pandemic levels.
Summary:
The headline monthly jobs number was above expectations; however, employment for the previous two months was revised down by 107,000, combined.
Part Time for Economic Reasons
 From the BLS report:
"The number of persons employed part time for economic reasons was little changed at 4.1 million in August. These individuals, who would have preferred full-time employment, were working part time because their hours had been reduced or they were unable to find full- time jobs."The number of persons working part time for economic reasons increased in August to 4.149 million from 3.924 million in July. This is below pre-recession levels.
These workers are included in the alternate measure of labor underutilization (U-6) that increased to 7.0% from 6.7% in the previous month. This is down from the record high in April 22.9% for this measure since 1994. This measure is at the same level as in February 2020 (pre-pandemic).
Unemployed over 26 Weeks
 This graph shows the number of workers unemployed for 27 weeks or more.
 According to the BLS, there are 1.137 million workers who have been unemployed for more than 26 weeks and still want a job, up from 1.067 million the previous month.
This is back to pre-pandemic levels.
Summary:
The headline monthly jobs number was above expectations; however, employment for the previous two months was revised down by 107,000, combined.
The headline unemployment rate increased to 3.7% due to the increase in the participation rate.
Overall, this was another solid employment report.
August Employment Report: 315 thousand Jobs, 3.7% Unemployment Rate
by Calculated Risk on 9/02/2022 08:43:00 AM
From the BLS:
Total nonfarm payroll employment increased by 315,000 in August, and the unemployment rate rose to 3.7 percent, the U.S. Bureau of Labor Statistics reported today. Notable job gains occurred in professional and business services, health care, and retail trade.
...
The change in total nonfarm payroll employment for June was revised down by 105,000, from +398,000 to +293,000, and the change for July was revised down by 2,000, from +528,000 to +526,000. With these revisions, employment in June and July combined is 107,000 lower than previously reported.
emphasis added
 Click on graph for larger image.
The first graph shows the job losses from the start of the employment recession, in percentage terms.
The current employment recession was by far the worst recession since WWII in percentage terms.
However, 30 months after the onset of the current employment recession, all of the jobs have returned. I'll post this graph through the January 2023 report (includes the annual revision).
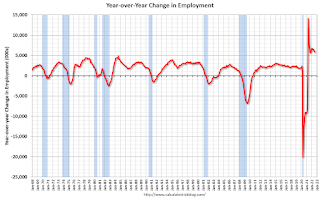 The second graph shows the year-over-year change in total non-farm employment since 1968.
In August, the year-over-year change was 5.84 million jobs. Employment was up significantly year-over-year.
Total payrolls increased by 315 thousand in August. Private payrolls increased by 308 thousand, and public payrolls increased 7 thousand.
Payrolls for June and July were revised down 107 thousand, combined.
The third graph shows the employment population ratio and the participation rate.
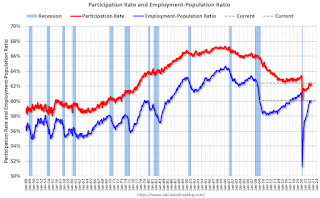 The Labor Force Participation Rate increased to 62.4% in August, from 62.1% in July. This is the percentage of the working age population in the labor force.
The Employment-Population ratio increased to 60.1% from 60.0% (blue line).
I'll post the 25 to 54 age group employment-population ratio graph later.
 The fourth graph shows the unemployment rate.
The unemployment rate was increased in August to 3.7% from 3.5% in July.
This was above consensus expectations; however, June and July payrolls were revised down by 107,000 combined.
 The second graph shows the year-over-year change in total non-farm employment since 1968.
In August, the year-over-year change was 5.84 million jobs. Employment was up significantly year-over-year.
Total payrolls increased by 315 thousand in August. Private payrolls increased by 308 thousand, and public payrolls increased 7 thousand.
Payrolls for June and July were revised down 107 thousand, combined.
The third graph shows the employment population ratio and the participation rate.
 The Labor Force Participation Rate increased to 62.4% in August, from 62.1% in July. This is the percentage of the working age population in the labor force.
 The Employment-Population ratio increased to 60.1% from 60.0% (blue line).
I'll post the 25 to 54 age group employment-population ratio graph later.
 The fourth graph shows the unemployment rate.
 The unemployment rate was increased in August to 3.7% from 3.5% in July.
This was above consensus expectations; however, June and July payrolls were revised down by 107,000 combined.
I'll have more later ...


