 RSS Feed
 by Calculated Risk on 9/07/2022 08:39:00 AM
Wednesday, September 07, 2022
Trade Deficit decreased to $70.6 Billion in July
From the Department of Commerce reported:
The U.S. Census Bureau and the U.S. Bureau of Economic Analysis announced today that the goods and services deficit was $70.6 billion in July, down $10.2 billion from $80.9 billion in June, revised.
July exports were $259.3 billion, $0.5 billion more than June exports. July imports were $329.9 billion, $9.7 billion less than June imports.
emphasis added
 Click on graph for larger image.
Exports increased and imports decreased in July.
Exports are up 21% year-over-year; imports are up 16% year-over-year.
Both imports and exports decreased sharply due to COVID-19 and have now bounced back.
The second graph shows the U.S. trade deficit, with and without petroleum.
 The blue line is the total deficit, and the black line is the petroleum deficit, and the red line is the trade deficit ex-petroleum products.
Note that net, imports and exports of petroleum products are close to zero.
The trade deficit with China increased to $34.4 billion in July, from $28.6 billion a year ago.
The trade deficit was at the consensus forecast.
MBA: Mortgage Applications Decrease in Latest Weekly Survey
by Calculated Risk on 9/07/2022 07:00:00 AM
From the MBA: Mortgage Applications Decrease in Latest MBA Weekly Survey
Mortgage applications decreased 0.8 percent from one week earlier, according to data from the Mortgage Bankers Association’s (MBA) Weekly Mortgage Applications Survey for the week ending September 2, 2022.
... The Refinance Index decreased 1 percent from the previous week and was 83 percent lower than the same week one year ago. The seasonally adjusted Purchase Index decreased 1 percent from one week earlier. The unadjusted Purchase Index decreased 3 percent compared with the previous week and was 23 percent lower than the same week one year ago.
“Mortgage rates moved higher over the course of last week as markets continued to re-assess the prospects for the economy and the path of monetary policy, with expectations for short-term rates to move and stay higher for longer,” said Mike Fratantoni, MBA Senior Vice President and Chief Economist. “With the 30-year fixed rate rising to the highest level since mid-June, application volumes for both purchase and refinance loans dropped. Recent economic data will likely prevent any significant decline in mortgage rates in the near term, but the strong job market depicted in the August data should support housing demand. There is no sign of a rebound in purchase applications yet, but the robust job market and an increase in housing inventories should lead to an eventual increase in purchase activity.”
...
The average contract interest rate for 30-year fixed-rate mortgages with conforming loan balances ($647,200 or less) increased to 5.94 percent from 5.80 percent, with points increasing to 0.79 from 0.71 (including the origination fee) for 80 percent loan-to-value ratio (LTV) loans.
emphasis added
 Click on graph for larger image.
The first graph shows the refinance index since 1990.
With higher mortgage rates, the refinance index has declined sharply over the last several months.
The refinance index is at the lowest level since the year 2000.
The second graph shows the MBA mortgage purchase index
 According to the MBA, purchase activity is down 23% year-over-year unadjusted.
The purchase index is now only 8% above the pandemic low.
Note: Red is a four-week average (blue is weekly).
Note: Red is a four-week average (blue is weekly).
Tuesday, September 06, 2022
Wednesday: Trade Deficit, Beige Book
by Calculated Risk on 9/06/2022 09:14:00 PM
Wednesday:
• At 7:00 AM ET, The Mortgage Bankers Association (MBA) will release the results for the mortgage purchase applications index.
• At 8:30 AM, Trade Balance report for July from the Census Bureau. The consensus is for the U.S. trade deficit to be $70.5 billion in July, from $79.6 billion in June.
• At At 12:35 PM, Speech, Fed Vice Chair Brainard, Economic Outlook and Monetary Policy, At The Clearing House and Bank Policy Institute Annual Conference, New York, N.Y.
• At 2:00 PM, the Federal Reserve Beige Book, an informal review by the Federal Reserve Banks of current economic conditions in their Districts.
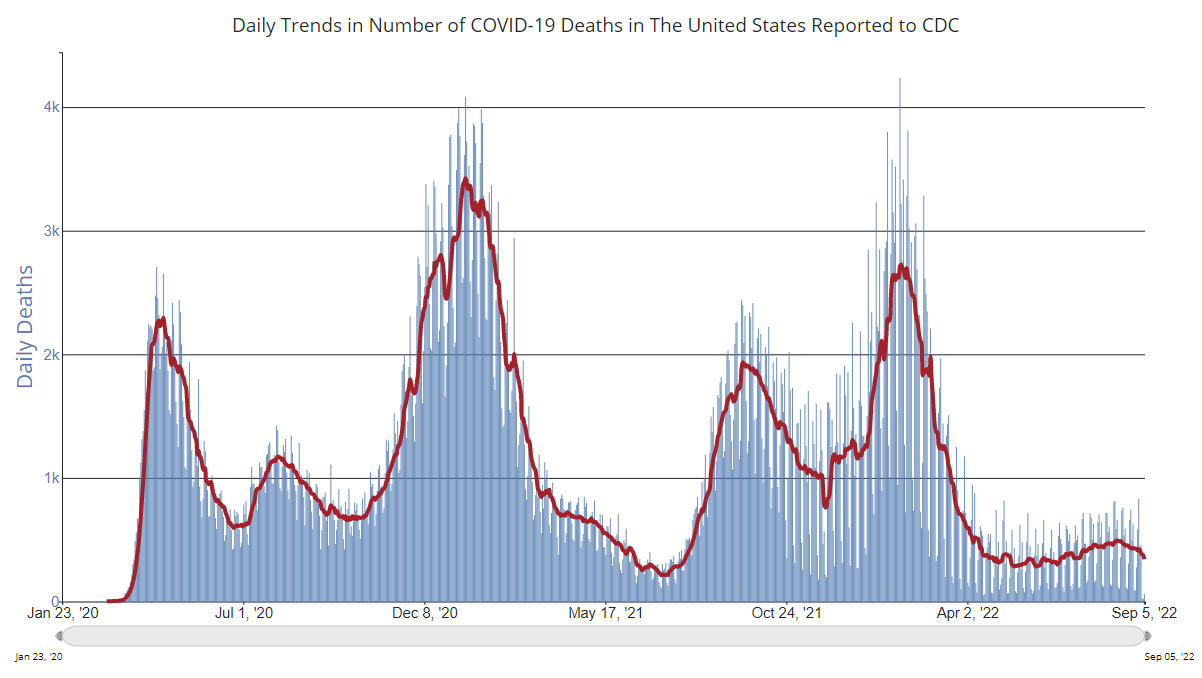
On COVID (focus on hospitalizations and deaths):
| COVID Metrics | ||||
|---|---|---|---|---|
| Now | Week Ago | Goal | ||
| New Cases per Day2 | 69,828 | 88,606 | ≤5,0001 | |
| Hospitalized2 | 26,072 | 32,120 | ≤3,0001 | |
| Deaths per Day2 | 342 | 423 | ≤501 | |
| 1my goals to stop daily posts, 27-day average for Cases, Currently Hospitalized, and Deaths 🚩 Increasing 7-day average week-over-week for Cases, Hospitalized, and Deaths ✅ Goal met. | ||||
 Click on graph for larger image.
This graph shows the daily (columns) and 7-day average (line) of deaths reported.
Average daily deaths bottomed in July 2021 at 214 per day.
Lawler: Are “National” Home Prices Already Falling?
by Calculated Risk on 9/06/2022 03:37:00 PM
Today, in the Calculated Risk Real Estate Newsletter: Lawler: Are “National” Home Prices Already Falling?
Excerpt:
A short but important note from housing economist Tom Lawler ...
However, some recent home price reports actually suggest that “national” home prices may already have started to decline, and they certainly show that home prices in some areas of the country have already begun to fall.
...
Given the lagged nature of some of these HPIs – and considering that closed transactions typically represent contract activity in the previous one or two months – it seems quite possible that home prices contemporaneously measured may in fact have already reached a peak for the year. Indeed, my own view is that a “base case” projection would be that all of these HPIs will show a December level that is below the June level.
There is more in the article. You can subscribe at https://calculatedrisk.substack.com/
The Sharp Slowdown in Year-over-year House Price Growth
by Calculated Risk on 9/06/2022 12:26:00 PM
Today, in the Calculated Risk Real Estate Newsletter: The Sharp Slowdown in Year-over-year House Price Growth
Excerpt:
And Zillow forecasts Case-Shiller a month early, and I like to check the Zillow forecasts since they have been pretty close. From Zillow Research: June 2022 Case-Shiller Results & Forecast: Moving Towards Rebalance ...
The Zillow forecast is for the year-over-year change for the Case-Shiller National index to be 15.9% in July. This would the lowest year-over-year increase since April 2021. This Case-Shiller National index was up 20.6% YoY in April, 19.9% in May, 18.0% in June, and Zillow is forecasting 15.9% in July. This is a sharp slowdown in YoY price increases.
For the most part, this deceleration was before the most recent rate increases (current 30-year mortgage rates are at 6.25%). Whether this means prices will stall on a national basis or decline something like 5% to 10% remains to be seen. It is clear there will be some double-digit regional declines, but I don’t expect cascading price declines this time since lending standards have been reasonably solid.

There is much more in the article. You can subscribe at https://calculatedrisk.substack.com/
ISM® Services Index Increased to 56.9% in August
by Calculated Risk on 9/06/2022 10:03:00 AM
(Posted with permission). The ISM® Services index was at 56.9%, up from 56.7% last month. The employment index increased to 50.2%, from 49.1%. Note: Above 50 indicates expansion, below 50 in contraction.
From the Institute for Supply Management: Services PMI® at 56.9% August 2022 Services ISM® Report On Business®
Economic activity in the services sector grew in August for the 27th month in a row — with the Services PMI® registering 56.9 percent — say the nation's purchasing and supply executives in the latest Services ISM® Report On Business®.This was above expectations.
The report was issued today by Anthony Nieves, CPSM, C.P.M., A.P.P., CFPM, Chair of the Institute for Supply Management® (ISM®) Services Business Survey Committee: “In August, the Services PMI® registered 56.9 percent, 0.2 percentage point higher than July’s reading of 56.7 percent. The Business Activity Index registered 60.9 percent, an increase of 1 percentage point compared to the reading of 59.9 percent in July. The New Orders Index figure of 61.8 percent is 1.9 percentage points higher than the July reading of 59.9 percent.
emphasis added
CoreLogic: House Prices up 15.8% YoY in July
by Calculated Risk on 9/06/2022 08:00:00 AM
Notes: This CoreLogic House Price Index report is for July. The recent Case-Shiller index release was for June. The CoreLogic HPI is a three-month weighted average and is not seasonally adjusted (NSA).
From CoreLogic: CoreLogic: US Year-Over-Year Home Price Growth Dips Again in July as Higher Mortgage Rates Cool Demand
CoreLogic® ... today released the CoreLogic Home Price Index (HPI™) and HPI Forecast™ for July 2022.
Annual home price growth slowed for the third consecutive month in July but remained elevated at 15.8%. As 30-year, fixed-rate mortgages neared 6% this summer, some prospective homebuyers pulled back, helping ease overheated and unsustainable price growth. Notably, home prices declined by 0.3% from June to July, a trend not seen between 2010 and 2019, when price increases averaged 0.5% between those two months, according to CoreLogic’s historic data. Looking ahead, CoreLogic expects to see a more balanced housing market, with year-over-year appreciation slowing to 3.8% by July 2023.
“Following June’s surge in mortgage rates and the resulting dampening effect on housing demand, price growth is taking a decisive turn,” said Selma Hepp, interim lead of the Office of the Chief Economist at CoreLogic. “And even though annual price growth remains in double digits, the month-over-month decline suggests further deceleration on the horizon. The higher cost of homeownership has clearly eroded affordability, as inflation-adjusted monthly mortgage expenses are now even higher than they were at their former peak in 2006.”
emphasis added
Monday, September 05, 2022
Tuesday: CoreLogic House Prices, ISM Services
by Calculated Risk on 9/05/2022 07:03:00 PM
Weekend:
• Schedule for Week of September 4, 2022
Tuesday:
• At 8:00 AM ET, Corelogic House Price index for July
• At 10:00 AM, the ISM Services Index for August. The consensus is for a reading of 55.5, down from 56.7.
From CNBC: Pre-Market Data and Bloomberg futures S&P 500 are up 19 and DOW futures are up 162 (fair value).
Oil prices were down over the last week with WTI futures at $88.93 per barrel and Brent at $95.74 per barrel. A year ago, WTI was at $69, and Brent was at $73 - so WTI oil prices are up 40% year-over-year.
Here is a graph from Gasbuddy.com for nationwide gasoline prices. Nationally prices are at $3.75 per gallon. A year ago, prices were at $3.17 per gallon, so gasoline prices are up $0.58 per gallon year-over-year.
Summer Teen Employment
by Calculated Risk on 9/05/2022 01:40:00 PM
Here is a look at the change in teen employment over time.
The graph below shows the employment-population ratio for teens (6 to 19 years old) since 1948.
The graph is Not Seasonally Adjusted (NSA), to show the seasonal hiring of teenagers during the summer.
A few observations:
1) Although teen employment has recovered some since the great recession, overall teen employment had been trending down. This is probably because more people are staying in school (a long term positive for the economy).
2) Teen employment was significantly impacted in 2020 by the pandemic.
 Click on graph for larger image.
3) A smaller percentage of teenagers are obtaining summer employment. The seasonal spikes are smaller than in previous decades.
The teen employment-population ratio was 36.5% in August 2022, up from 34.7% in August 2021. The teen participation rate was 40.6% in August 2022, up from 38.9% the previous July.
In general, a smaller percentage of teenagers are joining the labor force during the summer as compared to previous years. This could be because of fewer employment opportunities, or because teenagers are pursuing other activities during the summer.
3) The decline in teenager participation is one of the reasons the overall participation rate has declined (of course, the retiring baby boomers is the main reason the overall participation rate has declined over the last 20+ years).
3) The decline in teenager participation is one of the reasons the overall participation rate has declined (of course, the retiring baby boomers is the main reason the overall participation rate has declined over the last 20+ years).
Housing September 5th Update: Inventory Dips Slightly
by Calculated Risk on 9/05/2022 10:42:00 AM
Inventory decreased slightly last week. Still, inventory decreased less than in 2019 at this time of year. Here are the same week inventory changes for the last four years:
2022: -2.2K
2021: +6.2K
2020: -7.6K
2019: -6.5K
Inventory bottomed seasonally at the beginning of March 2022 and is now up 129% since then. More than double! Altos reports inventory is up 26.3% year-over-year. Note: Inventory peaked this week in 2021.
 Click on graph for larger image.
This inventory graph is courtesy of Altos Research.
 Click on graph for larger image.
This inventory graph is courtesy of Altos Research.
As of September 2nd, inventory was at 553 thousand (7-day average), compared to 555 thousand the prior week. Inventory was down 0.4% from the previous week.
Inventory is still historically low. Compared to the same week in 2021, inventory is up 26.3% from 437 thousand, however compared to the same week in 2020 inventory is down 5.4% from 584 thousand. Compared to 3 years ago, inventory is down 42.2% from 956 thousand.
Here are the inventory milestones I’m watching for with the Altos data:
1. The seasonal bottom (happened on March 4th for Altos) ✅
2. Inventory up year-over-year (happened on May 13th for Altos) ✅
3. Inventory up compared to two years ago (currently down 5.4% according to Altos)
4. Inventory up compared to 2019 (currently down 42.2%).
1. The seasonal bottom (happened on March 4th for Altos) ✅
2. Inventory up year-over-year (happened on May 13th for Altos) ✅
3. Inventory up compared to two years ago (currently down 5.4% according to Altos)
4. Inventory up compared to 2019 (currently down 42.2%).

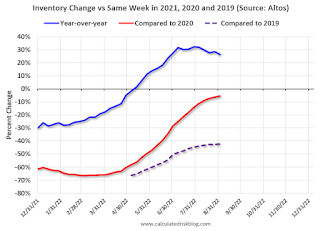
Here is a graph of the inventory change vs 2021, 2020 (milestone 3 above) and 2019 (milestone 4).
The blue line is the year-over-year data, the red line is compared to two years ago, and dashed purple is compared to 2019.
Two years ago (in 2020) inventory was declining all year, so the two-year comparison will get easier all year.
Based on the recent changes in inventory, my current estimate is inventory will be up compared to 2020 in October of this year.
A key will be if inventory increases in September.
Mike Simonsen discusses this data regularly on Youtube.


