 RSS Feed
 by Calculated Risk on 9/09/2022 08:26:00 AM
Friday, September 09, 2022
1st Look at Local Housing Markets in August, Sales and New Listings Down Sharpy Year-over-year
Today, in the Calculated Risk Real Estate Newsletter: 1st Look at Local Housing Markets in August
A brief excerpt:
This is the first look at local markets in August. I’m tracking about 35 local housing markets in the US. Some of the 35 markets are states, and some are metropolitan areas. I’ll update these tables throughout the month as additional data is released.There is much more in the article. You can subscribe at https://calculatedrisk.substack.com/
We are seeing a sharp decline in closed sales, and inventory is up significantly year-over-year. Also, new listings are down as the sellers’ strike continues. The increase in inventory so far has been due to softer demand - likely because of higher mortgage rates.
In August, sales were down 26.1%. In July, these same markets were down 31.3% YoY.
Note that in August 2022, there was one more selling day than in August 2021, so the SA decline in August sales will be larger than the NSA decline. The opposite was true in July (one more selling day in July 2021 than in July 2022). So, seasonally adjusted, this is probably close to the same YoY decline as in July.
Many more local markets to come!

Thursday, September 08, 2022
Friday: Q2 Flow of Funds
by Calculated Risk on 9/08/2022 07:42:00 PM
Friday:
• At 12:00 PM ET, Q2 Flow of Funds Accounts of the United States from the Federal Reserve.
On COVID (focus on hospitalizations and deaths):
| COVID Metrics | ||||
|---|---|---|---|---|
| Now | Week Ago | Goal | ||
| New Cases per Day2 | 70,488 | 86,852 | ≤5,0001 | |
| Hospitalized2 | 29,359 | 31,574 | ≤3,0001 | |
| Deaths per Day2 | 313 | 436 | ≤501 | |
| 1my goals to stop daily posts, 27-day average for Cases, Currently Hospitalized, and Deaths 🚩 Increasing 7-day average week-over-week for Cases, Hospitalized, and Deaths ✅ Goal met. | ||||
 Click on graph for larger image.
This graph shows the daily (columns) and 7-day average (line) of deaths reported.
Average daily deaths bottomed in July 2021 at 214 per day.
Leading Index for Commercial Real Estate "Dips" in August
by Calculated Risk on 9/08/2022 05:32:00 PM
From Dodge Data Analytics: Dodge Momentum Index Dips in August
The Dodge Momentum Index (DMI) ticked down by 1.2% in August to 171.9 from the revised July figure of 174.0.
The Momentum Index, issued by Dodge Construction Network, is a monthly measure of the initial report for nonresidential building projects in planning, shown to lead construction spending for nonresidential buildings by a full year. In August, the commercial component of the Momentum Index rose 1%, while the institutional component fell 5.6%.
Commercial planning in August was led by an increase in hotel projects, while fewer healthcare projects drove the institutional component lower. Compared to August 2021, the Momentum Index was up 14%. The commercial component was 16% higher, and the institutional component was 10% higher than a year ago.
emphasis added
 Click on graph for larger image.
This graph shows the Dodge Momentum Index since 2002. The index was at 171.9 in August, down from 174.0 in July.
According to Dodge, this index leads "construction spending for nonresidential buildings by a full year". This index suggests a solid pickup in commercial real estate construction at the end of this year and into 2023.
FDIC: Problem Banks Unchanged, Residential REO Decreased Slightly in Q2 2022
by Calculated Risk on 9/08/2022 12:39:00 PM
The FDIC released the Quarterly Banking Profile for Q2 2022 this morning:
Quarterly net income totaled $64.4 billion in second quarter 2022, a reduction of $6.0 billion (8.5 percent) from the same quarter a year ago.
...
Loans and leases that are 30-89 days past due (past-due loan balances) increased from the year-ago quarter (up $11.4 billion, or 25.0 percent). Past-due consumer loans drove the increase from the year-ago quarter. The increase in past-due loan balances lifted the past due rate 6 basis points from the year-ago quarter to 0.48 percent. The past-due rate remained unchanged from the previous quarter, however, as loan growth outpaced the quarterly growth in past due loans. Despite the recent increase, the past-due rate remains below the pre-pandemic average of 0.66 percent.
emphasis added
 Click on graph for larger image.
The FDIC reported the number of problem banks was unchanged at 40.
The number of FDIC-insured institutions declined from 4,796 in first quarter 2022 to 4,771. In second quarter, 6 banks opened and 28 institutions merged with other FDIC-insured institutions. The number of banks on the FDIC’s “Problem Bank List” remained unchanged from first quarter at 40, the lowest level since QBP data collection began in 1984. Total assets of problem banks declined $2.7 billion to $170.4 billion. No banks failed in the second quarter.This graph from the FDIC shows the number of problem banks and assets at problem institutions.
Note: The number of assets for problem banks increased significantly back in 2018 when Deutsche Bank Trust Company Americas was added to the list. An even larger bank was added to the list last year, although the identity of the bank is unclear.
 The dollar value of 1-4 family residential Real Estate Owned (REOs, foreclosure houses) decreased slightly from $788 million in Q1 2022 to $784 million in Q2 2022.
 This graph shows the nominal dollar value of Residential REO for FDIC insured institutions. Note: The FDIC reports the dollar value and not the total number of REOs.
"Wholesale Used-Vehicle Prices Decline Substantially in August"
by Calculated Risk on 9/08/2022 10:41:00 AM
From Manheim Consulting today: Wholesale Used-Vehicle Prices Decline Substantially in August
Wholesale used-vehicle prices (on a mix, mileage, and seasonally adjusted basis) decreased 4.0% in August from July. The Manheim Used Vehicle Value Index declined to 210.8 but is up 8.4% from a year ago. The non-adjusted price change in August was a decline of 2.6% compared to July, leaving the unadjusted average price up 5.9% year over year.
emphasis added
 Click on graph for larger image.
This index from Manheim Consulting is based on all completed sales transactions at Manheim’s U.S. auctions.
The Manheim index suggests used car prices decreased in August and are up 8.4% year-over-year (YoY).
The YoY change is mostly getting smaller. This index was up 45% YoY in January. It is likely this index will be down YoY in September.
Homebuilder Comments in August: Increased Incentives Helping Sales, "Construction cycle time has improved"
by Calculated Risk on 9/08/2022 09:17:00 AM
Today, in the Calculated Risk Real Estate Newsletter: Homebuilder Comments in August: Increased Incentives Helping Sales
A brief excerpt:
Here are some interesting homebuilder comments from around the country. In August, builders have cut prices and increased incentives. And cycle times are improving with less demand.There many more comments in the article. You can subscribe at https://calculatedrisk.substack.com/
Homebuilder comments courtesy of Rick Palacios Jr., Director of Research at John Burns Real Estate Consulting (a must follow for housing on twitter!):
#Austin builder: “A lot of spec inventory to work through. August was a very poor month for sales across the board. Cancellations spiked from July and buyers showed no sense of urgency.”
#Baltimore builder: “Jumbo loan rates below 5% are helping buyers move forward in that segment.”
#Boise builder: “Construction cycle time has improved over the last 30 days.”
#Charlotte builder: “Sales were fairly strong in August. Increased incentives to help with closing costs and a buy down rate appear to be helping.”
#Cleveland builder: “Build cycle times have been improving over the last 4 or 5 months. Appointments have completely dropped off and traffic is very sparse at the models.”
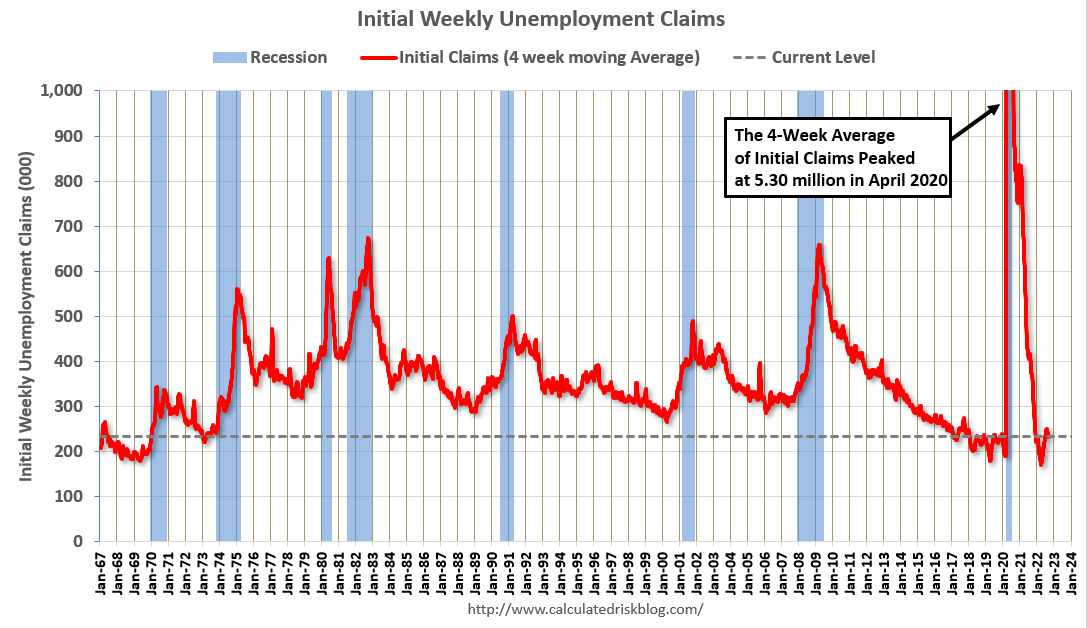
Weekly Initial Unemployment Claims decrease to 222,000
by Calculated Risk on 9/08/2022 08:33:00 AM
The DOL reported:
In the week ending September 3, the advance figure for seasonally adjusted initial claims was 222,000, a decrease of 6,000 from the previous week's revised level. The previous week's level was revised down by 4,000 from 232,000 to 228,000. The 4-week moving average was 233,000, a decrease of 7,500 from the previous week's revised average. The previous week's average was revised down by 1,000 from 241,500 to 240,500.The following graph shows the 4-week moving average of weekly claims since 1971.
emphasis added
 Click on graph for larger image.
The dashed line on the graph is the current 4-week average. The four-week average of weekly unemployment claims decreased to 233,000.
The previous week was revised down.
Weekly claims were below the consensus forecast.
Wednesday, September 07, 2022
Thursday: Unemployment Claims, Fed Chair Powell
by Calculated Risk on 9/07/2022 08:56:00 PM
Thursday:
• At 8:30 AM ET, The initial weekly unemployment claims report will be released. The consensus is for an increase to 240 thousand from 232 thousand last week.
• At 9:10 AM, Discussion, Fed Chair Powell, At the Cato Institute’s 40th Annual Monetary Conference
On COVID (focus on hospitalizations and deaths):
| COVID Metrics | ||||
|---|---|---|---|---|
| Now | Week Ago | Goal | ||
| New Cases per Day2 | 74,803 | 88,644 | ≤5,0001 | |
| Hospitalized2 | 29,491 | 31,842 | ≤3,0001 | |
| Deaths per Day2 | 336 | 414 | ≤501 | |
| 1my goals to stop daily posts, 27-day average for Cases, Currently Hospitalized, and Deaths 🚩 Increasing 7-day average week-over-week for Cases, Hospitalized, and Deaths ✅ Goal met. | ||||
 Click on graph for larger image.
This graph shows the daily (columns) and 7-day average (line) of deaths reported.
Average daily deaths bottomed in July 2021 at 214 per day.
Fed's Beige Book: "Residential real estate conditions weakened noticeably as home sales fell in all twelve Districts"
by Calculated Risk on 9/07/2022 02:06:00 PM
Fed's Beige Book "This report was prepared at the Federal Reserve Bank of San Francisco based on information collected on or before August 29, 2022."
Economic activity was unchanged, on balance, since early July, with five Districts reporting slight to modest growth in activity and five others reporting slight to modest softening. Most Districts reported steady consumer spending as households continued to trade down and to shift spending away from discretionary goods and toward food and other essential items. Auto sales remained muted across most Districts, reflecting limited inventories and elevated prices. Hospitality and tourism contacts highlighted overall solid leisure travel activity with some reporting an uptick in business and group travel. Manufacturing activity grew in several Districts, although there were some reports of declining output as supply chain disruptions and labor shortages continued to hamper production. Despite some reports of strong leasing activity, residential real estate conditions weakened noticeably as home sales fell in all twelve Districts and residential construction remained constrained by input shortages. Commercial real estate activity softened, particularly demand for office space. Loan demand was mixed; while financial institutions reported generally strong demand for credit cards and commercial and industrial loans, residential loan demand was weak amid elevated mortgage interest rates. Nonfinancial services firms experienced stable to slightly higher demand. Demand for transportation services was mixed and reports on agriculture conditions across reporting Districts varied. While demand for energy products was robust, production remained constrained by supply chain bottlenecks for critical components. The outlook for future economic growth remained generally weak, with contacts noting expectations for further softening of demand over the next six to twelve months.
emphasis added
Black Knight Mortgage Monitor: "Total market leverage was just 42% of mortgaged homes’ values, the lowest on record"
by Calculated Risk on 9/07/2022 10:43:00 AM
Today, in the Calculated Risk Real Estate Newsletter: Black Knight Mortgage Monitor: "Total market leverage was just 42% of mortgaged homes’ values, the lowest on record"
A brief excerpt:
Most homeowners have a significant amount of equity and will not be “underwater” if house prices decline. This is an important difference compared to the housing bubble when many millions of borrowers had little or no equity even before house prices declined. As Black Knight notes in their monthly Mortgage Monitor report released this morning:There is much more in the article. You can subscribe at https://calculatedrisk.substack.com/Overall, the market is on strong footing to weather a correction; total market leverage as of Q2 – including both first and second liens – was just 42% of mortgaged homes’ values, the lowest on recordThe first graph shows Black Knight’s estimate of tappable equity.
• Tappable equity – the amount a homeowner can borrow against while keeping a 20% equity stake – hit its 10th consecutive quarterly record high in Q2 2022 at $11.5T but appears to have peaked in May of this year
• Escalating declines in June and July have total tappable equity down 5% over the past two months, suggesting a sizeable reduction is likely in Q3, which would mark the first quarterly decline in three years


