 RSS Feed
 by Calculated Risk on 9/12/2022 10:20:00 AM
Monday, September 12, 2022
Housing September 12th Update: Inventory Decreased 1.0% Last Week
Active inventory decreased 1.0% last week. Here are the same week inventory changes for the last four years (the increase in 2019 was a one-week surge):
2022: -5.4K
2021: -6.2K
2020: -5.0K
2019: +7.2K
Inventory bottomed seasonally at the beginning of March 2022 and is now up 127% since then. More than double! Altos reports inventory is up 26.9% year-over-year.
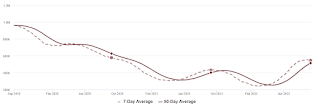 Click on graph for larger image.
This inventory graph is courtesy of Altos Research.
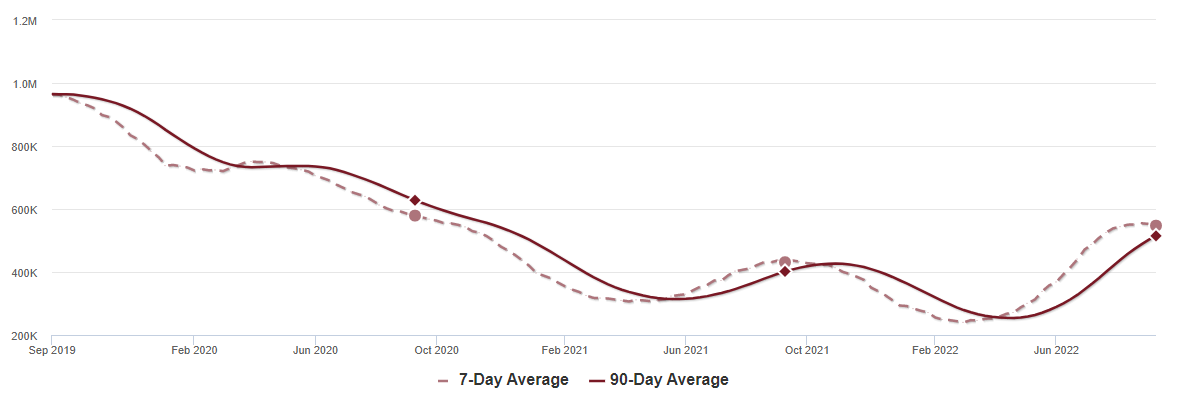 Click on graph for larger image.
This inventory graph is courtesy of Altos Research.
As of September 9th, inventory was at 547 thousand (7-day average), compared to 553 thousand the prior week. Inventory was down 1.0% from the previous week.
Inventory is still historically low. Compared to the same week in 2021, inventory is up 26.9% from 431 thousand, however compared to the same week in 2020 inventory is down 5.5% from 579 thousand. Compared to 3 years ago, inventory is down 43.2% from 964 thousand.
Here are the inventory milestones I’m watching for with the Altos data:
1. The seasonal bottom (happened on March 4th for Altos) ✅
2. Inventory up year-over-year (happened on May 13th for Altos) ✅
3. Inventory up compared to two years ago (currently down 5.5% according to Altos)
4. Inventory up compared to 2019 (currently down 43.2%).
1. The seasonal bottom (happened on March 4th for Altos) ✅
2. Inventory up year-over-year (happened on May 13th for Altos) ✅
3. Inventory up compared to two years ago (currently down 5.5% according to Altos)
4. Inventory up compared to 2019 (currently down 43.2%).
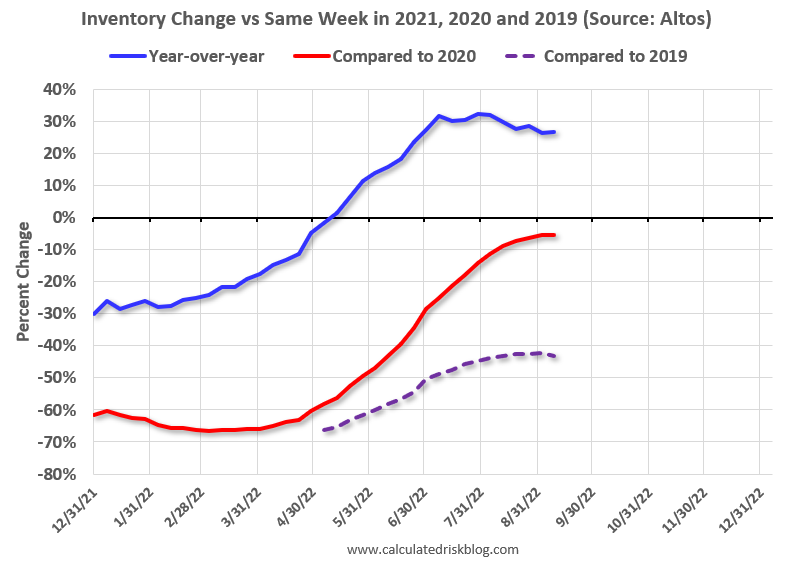
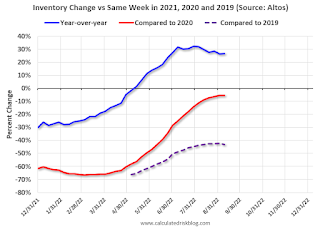
Here is a graph of the inventory change vs 2021, 2020 (milestone 3 above) and 2019 (milestone 4).
The blue line is the year-over-year data, the red line is compared to two years ago, and dashed purple is compared to 2019.
Two years ago (in 2020) inventory was declining all year, so the two-year comparison will get easier all year.
Based on the recent changes in inventory, my current estimate is inventory will be up compared to 2020 in Q4 of this year.
A key will be if inventory increases this month - so far inventory has decreased.
Mike Simonsen discusses this data regularly on Youtube.
Four High Frequency Indicators for the Economy
by Calculated Risk on 9/12/2022 08:30:00 AM
These indicators are mostly for travel and entertainment. It is interesting to watch these sectors recover as the pandemic subsides. Notes: I've added back gasoline supplied to see if there is an impact from higher gasoline prices.
The TSA is providing daily travel numbers.
This data is as of September 11th.
 Click on graph for larger image.
This data shows the 7-day average of daily total traveler throughput from the TSA for 2019 (Light Blue), 2020 (Black), 2021 (Blue) and 2022 (Red).
The dashed line is the percent of 2019 for the seven-day average.
The 7-day average is down 4.9% from the same day in 2019 (90.9% of 2019). (Dashed line)
Air travel - as a percent of 2019 - had been moving sideways over the last several months, off about 10% from 2019. Travel has picked up recently, compared to 2019, perhaps due to the timing of Labor Day.
 This data shows domestic box office for each week and the median for the years 2016 through 2019 (dashed light blue).
 Black is 2020, Blue is 2021 and Red is 2022.
The data is from BoxOfficeMojo through September 8th.
Note that the data is usually noisy week-to-week and depends on when blockbusters are released.
Movie ticket sales were at $82 million last week, down about 44% from the median for the week.
Note that the data is usually noisy week-to-week and depends on when blockbusters are released.
Movie ticket sales were at $82 million last week, down about 44% from the median for the week.
 This graph shows the seasonal pattern for the hotel occupancy rate using the four-week average.
 The red line is for 2022, black is 2020, blue is the median, and dashed light blue is for 2021. Dashed purple is 2019 (STR is comparing to a strong year for hotels).
This data is through Sept 3rd. The occupancy rate was up 3.1% compared to the same week in 2019. This was the first week, since the onset of the pandemic, with the occupancy higher than the comparable week in 2019.
The 4-week average of the occupancy rate is above the median rate for the previous 20 years (Blue).
Notes: Y-axis doesn't start at zero to better show the seasonal change.
Notes: Y-axis doesn't start at zero to better show the seasonal change.
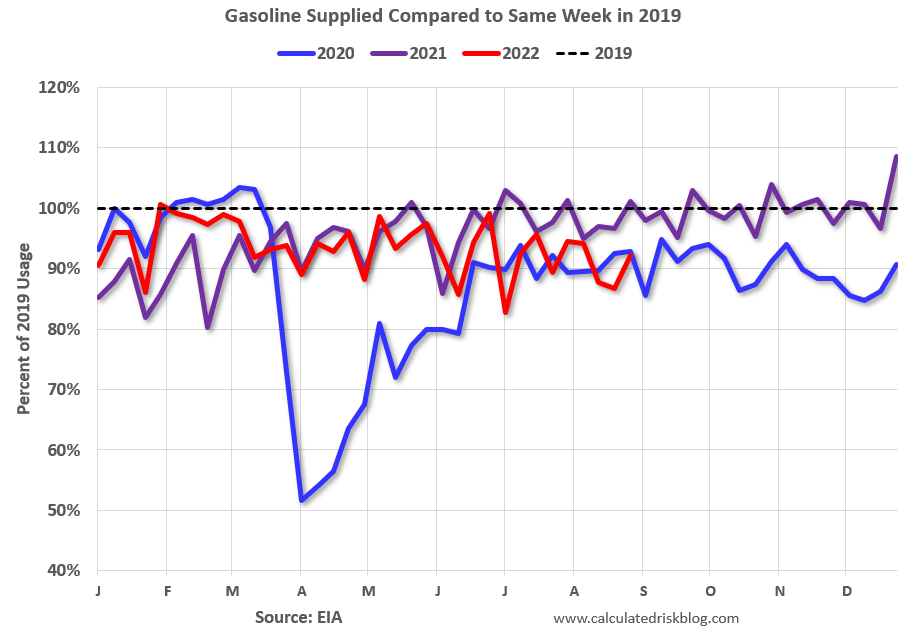
This graph, based on weekly data from the U.S. Energy Information Administration (EIA), shows gasoline supplied compared to the same week of 2019.
Blue is for 2020. Purple is for 2021, and Red is for 2022.
As of September 2nd, gasoline supplied was down 7.9% compared to the same week in 2019.
Recently gasoline supplied has been running below 2019 and 2021 levels - and sometimes below 2020.
Sunday, September 11, 2022
Sunday Night Futures
by Calculated Risk on 9/11/2022 07:27:00 PM
Weekend:
• Schedule for Week of September 11, 2022
Monday:
• No major economic releases scheduled.
From CNBC: Pre-Market Data and Bloomberg futures S&P 500 are up 12 and DOW futures are up 79 (fair value).
Oil prices were down over the last week with WTI futures at $86.45 per barrel and Brent at $92.61 per barrel. A year ago, WTI was at $70, and Brent was at $73 - so WTI oil prices are up 23% year-over-year.
Here is a graph from Gasbuddy.com for nationwide gasoline prices. Nationally prices are at $3.67 per gallon. A year ago, prices were at $3.15 per gallon, so gasoline prices are up $0.52 per gallon year-over-year.
Hotels: Occupancy Rate UP 3.1% Compared to Same Week in 2019
by Calculated Risk on 9/11/2022 08:11:00 AM
Note: This is the first week, since the onset of the pandemic, with the occupancy higher than the comparable week in 2019.
U.S. hotel performance dipped from the previous week but continued to improve in comparison with 2019, according to STR‘s latest data through Sept. 3.The following graph shows the seasonal pattern for the hotel occupancy rate using the four-week average.
Aug. 28 through Sept. 3, 2022 (percentage change from comparable week in 2019*):
• Occupancy: 62.8% (+3.1%)
• Average daily rate (ADR): $147.14 (+20.9%)
• Revenue per available room (RevPAR): $92.45 (+24.6%)
*Due to the pandemic impact, STR is measuring recovery against comparable time periods from 2019.
emphasis added
Click on graph for larger image.The red line is for 2022, black is 2020, blue is the median, and dashed light blue is for 2021. Dashed purple is 2019 (STR is comparing to a strong year for hotels).
The 4-week average of the occupancy rate is above the median rate for the previous 20 years (Blue).
Note: Y-axis doesn't start at zero to better show the seasonal change.
The 4-week average of the occupancy rate will increase during the Fall business travel period, and then decline in to the Winter.
Saturday, September 10, 2022
Real Estate Newsletter Articles this Week
by Calculated Risk on 9/10/2022 02:11:00 PM
At the Calculated Risk Real Estate Newsletter this week:
• 1st Look at Local Housing Markets in August
• Homebuilder Comments in August: Increased Incentives Helping Sales
• Black Knight Mortgage Monitor: "Total market leverage was just 42% of mortgaged homes’ values, the lowest on record"
• Lawler: Are “National” Home Prices Already Falling?
• The Sharp Slowdown in Year-over-year House Price Growth
This is usually published 4 to 6 times a week and provides more in-depth analysis of the housing market.
You can subscribe at https://calculatedrisk.substack.com/
Most content is available for free (and no Ads), but please subscribe!
Schedule for Week of September 11, 2022
by Calculated Risk on 9/10/2022 08:11:00 AM
The key economic reports this week are August Consumer Price Index (CPI) and Retail Sales.
For manufacturing, August Industrial Production, and the September New York and Philly Fed surveys, will be released this week.
No major economic releases scheduled.
6:00 AM: NFIB Small Business Optimism Index for August.
8:30 AM: The Consumer Price Index for August from the BLS. The consensus is for a 0.1% decrease in CPI, and a 0.3% increase in core CPI. The consensus is for CPI to be up 8.1% year-over-year and core CPI to be up 6.1% YoY.
7:00 AM ET: The Mortgage Bankers Association (MBA) will release the results for the mortgage purchase applications index.
8:30 AM: The Producer Price Index for August from the BLS. The consensus is for a 0.1% decrease in PPI, and a 0.3% increase in core PPI.
8:30 AM: The initial weekly unemployment claims report will be released. The consensus is for an increase to 225 thousand from 222 thousand last week.
 8:30 AM ET: Retail sales for August will be released. The consensus is for a 0.2% increase in retail sales.
This graph shows retail sales since 1992. This is monthly retail sales and food service, seasonally adjusted (total and ex-gasoline).
8:30 AM: the Philly Fed manufacturing survey for September. The consensus is for a reading of 3.5, down from 6.2.
8:30 AM ET: The New York Fed Empire State manufacturing survey for September. The consensus is for a reading of -13.9, up from -31.3.
 9:15 AM: The Fed will release Industrial Production and Capacity Utilization for August.
This graph shows industrial production since 1967.
The consensus is for a 0.2% increase in Industrial Production, and for Capacity Utilization to increase to 80.3%.
10:00 AM: State Employment and Unemployment (Monthly) for August 2022
0:00 AM: University of Michigan's Consumer sentiment index (Preliminary for September).
Friday, September 09, 2022
COVID Sept 9, 2022, Update on Cases, Hospitalizations and Deaths
by Calculated Risk on 9/09/2022 08:58:00 PM
On COVID (focus on hospitalizations and deaths):
| COVID Metrics | ||||
|---|---|---|---|---|
| Now | Week Ago | Goal | ||
| New Cases per Day2 | 67,400 | 85,866 | ≤5,0001 | |
| Hospitalized2 | 28,999 | 31,368 | ≤3,0001 | |
| Deaths per Day2 | 318 | 435 | ≤501 | |
| 1my goals to stop daily posts, 27-day average for Cases, Currently Hospitalized, and Deaths 🚩 Increasing 7-day average week-over-week for Cases, Hospitalized, and Deaths ✅ Goal met. | ||||
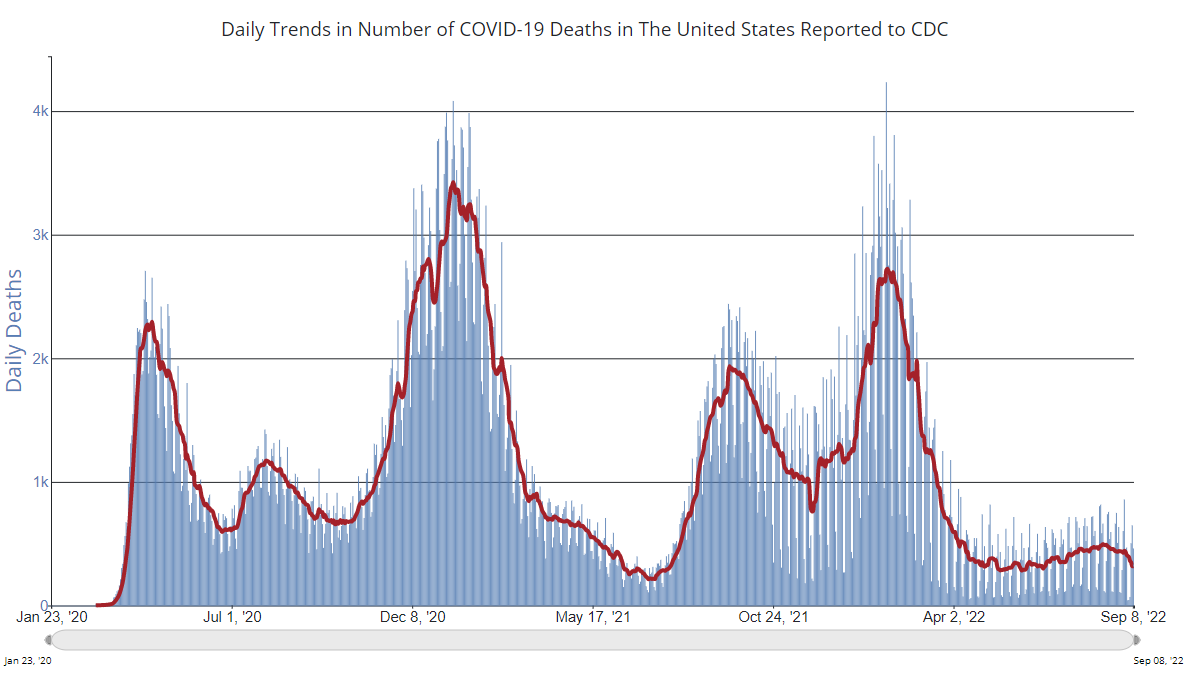 Click on graph for larger image.
This graph shows the daily (columns) and 7-day average (line) of deaths reported.
Average daily deaths bottomed in July 2021 at 214 per day.
AAR: August Rail Carloads Up Year-over-year, Intermodal Down
by Calculated Risk on 9/09/2022 04:55:00 PM
From the Association of American Railroads (AAR) Rail Time Indicators. Graphs and excerpts reprinted with permission.
If you were expecting August rail traffic to provide a definitive statement regarding the state of the economy, well, get used to disappointment. As in June and July, rail traffic in August was relatively evenly balanced between categories with carload gains and those with declines.
emphasis added
 Click on graph for larger image.
This graph from the Rail Time Indicators report shows the six-week average of U.S. Carloads in 2020, 2021 and 2022:
U.S. railroads originated an average of 237,978 total carloads per week in August 2022. That’s the best weekly average for any month since May 2021 and up 2.3% over August 2021. The 2.3% gain was the biggest year-over-year gain since February 2022 (which isn’t a fair comparison because rail traffic in February 2021 was decimated by severe winter storms).
 The second graph shows the six-week average (not monthly) of U.S. intermodal in 2020, 2021 and 2022: (using intermodal or shipping containers):
Intermodal originations (which are not included in carloads) averaged 267,124 units per week in August 2022, down 1.2% from August 2021. August was the 12th decline in the past 13 months (February 2022 was the exception) but 1.2% is the smallest percentage decline in those 13 months. The weekly average in August 2022 was the third highest in the eight months so far this year. For the year to date through August, intermodal was down 5.1% from last year’s record, up 7.4% over 2020, and down 0.9% from 2019.
Q3 GDP Tracking: Just Over 1%
by Calculated Risk on 9/09/2022 02:14:00 PM
From BofA:
We updated our 3Q US GDP (Gross Domestic Product) [1.1% q/q saar] tracking estimate from July trade data, where the narrowing of the trade deficit to $70.6bn was broadly in line with our expectation, although the goods deficit was revised slightly higher from the advance estimate. Net trade is poised to make a substantial contribution to growth in 3Q. [September 9th estimate]From Goldman:
emphasis added
We left our Q3 GDP tracking estimate unchanged at +1.1% (qoq ar). [September 9th estimate]And from the Altanta Fed: GDPNow
The GDPNow model estimate for real GDP growth (seasonally adjusted annual rate) in the third quarter of 2022 is 1.3 percent on September 9, down from 1.4 percent on September 7. After this morning's wholesale trade report from the US Census Bureau, the nowcast of third-quarter real gross private domestic investment growth decreased from -5.8 percent to -6.1 percent. [September 9th estimate]
Fed's Flow of Funds: Household Net Worth Decreased $6.1 Trillion in Q2
by Calculated Risk on 9/09/2022 12:41:00 PM
The Federal Reserve released the Q2 2022 Flow of Funds report today: Financial Accounts of the United States.
The net worth of households and nonprofits fell to $143.8 trillion during the second quarter of 2022. The value of directly and indirectly held corporate equities decreased $7.7 trillion and the value of real estate increased $1.4 trillion
...
Household debt increased 7.4 percent at an annual rate in the second quarter of 2022. Consumer credit grew at an annual rate of 8.5 percent, while mortgage debt (excluding charge-offs) grew at an annual rate of 8.8 percent.
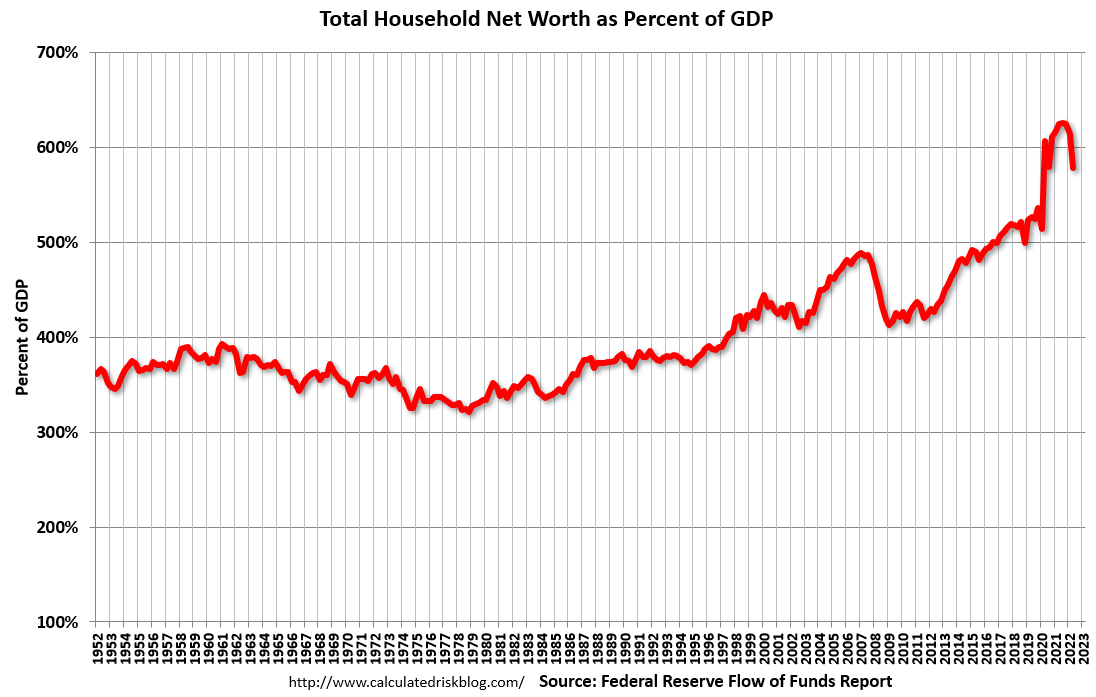 Click on graph for larger image.
The first graph shows Households and Nonprofit net worth as a percent of GDP.
Net worth as a percent of GDP is down from the all-time high in Q4.
This includes real estate and financial assets (stocks, bonds, pension reserves, deposits, etc) net of liabilities (mostly mortgages). Note that this does NOT include public debt obligations.
 The second graph shows homeowner percent equity since 1952.
Household percent equity (as measured by the Fed) collapsed when house prices fell sharply in 2007 and 2008.
In Q2 2022, household percent equity (of household real estate) was at 70.5% - up from 70.1% in Q1, 2022. This is the highest percent equity since the early 1980s.
Note: This includes households with no mortage debt.
 The third graph shows household real estate assets and mortgage debt as a percent of GDP. Note this graph was impacted by the sharp decline in Q2 2020 GDP.
Mortgage debt increased by $263 billion in Q2.
Mortgage debt is up $1.46 trillion from the peak during the housing bubble, but, as a percent of GDP is at 48.9% - up slightly from Q1 - and down from a peak of 73.3% of GDP during the housing bust.
The value of real estate, as a percent of GDP, increased in Q2, and is well above the average of the last 30 years.
 The second graph shows homeowner percent equity since 1952.
 Household percent equity (as measured by the Fed) collapsed when house prices fell sharply in 2007 and 2008.
In Q2 2022, household percent equity (of household real estate) was at 70.5% - up from 70.1% in Q1, 2022. This is the highest percent equity since the early 1980s.
Note: This includes households with no mortage debt.
 The third graph shows household real estate assets and mortgage debt as a percent of GDP. Note this graph was impacted by the sharp decline in Q2 2020 GDP.
Mortgage debt increased by $263 billion in Q2.
Mortgage debt is up $1.46 trillion from the peak during the housing bubble, but, as a percent of GDP is at 48.9% - up slightly from Q1 - and down from a peak of 73.3% of GDP during the housing bust.
The value of real estate, as a percent of GDP, increased in Q2, and is well above the average of the last 30 years.


