RSS Feed
 by Calculated Risk on 9/14/2022 11:20:00 AM
Wednesday, September 14, 2022
2nd Look at Local Housing Markets in August
Today, in the Calculated Risk Real Estate Newsletter: 2nd Look at Local Housing Markets in August
A brief excerpt:
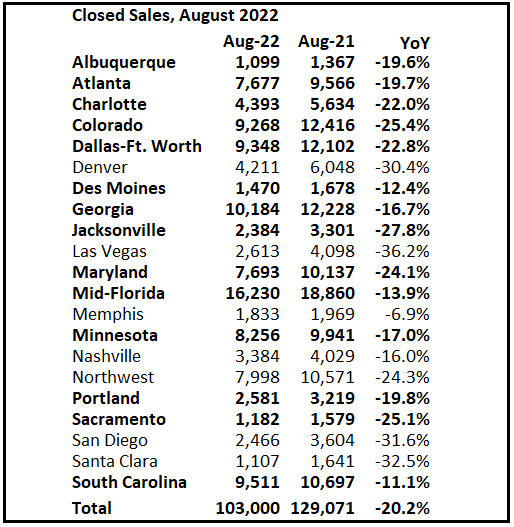
This is the second look at local markets in August. I’m tracking about 35 local housing markets in the US. Some of the 35 markets are states, and some are metropolitan areas. I’ll update these tables throughout the month as additional data is released.There is much more in the article. You can subscribe at https://calculatedrisk.substack.com/
The big story for August existing home sales is the sharp year-over-year (YoY) decline in sales. Another key story is that new listings are down YoY in August as the sellers’ strike continues. Of course, active listings are up sharply YoY, but inventory growth has stalled. The increase in inventory so far has been due to softer demand, likely because of higher mortgage rates.
In August, sales in these markets were down 20.2%.
Note that in August 2022, there was one more selling day than in August 2021, so the SA decline in August sales will be larger than the NSA decline.
The opposite was true in July (one more selling day in July 2021 than in July 2022). So, seasonally adjusted, this is probably close to the same YoY decline as in July.
Many more local markets to come!
MBA: Mortgage Applications Decrease in Latest Weekly Survey
by Calculated Risk on 9/14/2022 07:00:00 AM
From the MBA: Mortgage Applications Decrease in Latest MBA Weekly Survey
Mortgage applications decreased 1.2 percent from one week earlier, according to data from the Mortgage Bankers Association’s (MBA) Weekly Mortgage Applications Survey for the week ending September 9, 2022. This week’s results include an adjustment for the observance of Labor Day.
... The Refinance Index decreased 4 percent from the previous week and was 83 percent lower than the same week one year ago. The seasonally adjusted Purchase Index increased 0.2 percent from one week earlier. The unadjusted Purchase Index decreased 12 percent compared with the previous week and was 29 percent lower than the same week one year ago.
“The 30-year fixed mortgage rate hit the six percent mark for the first time since 2008 – rising to 6.01 percent – which is essentially double what it was a year ago,” said Joel Kan, MBA’s Associate Vice President of Economic and Industry Forecasting. “Higher mortgage rates have pushed refinance activity down more than 80 percent from last year and have contributed to more homebuyers staying on the sidelines. Government loans, which tend to be favored by first-time buyers, bucked this trend and increased over the week, driven mainly by VA and USDA lending activity.”
Added Kan, “The spread between the conforming 30-year fixed mortgage rate and both ARM and jumbo loans remained wide last week, at 118 and 45 basis points, respectively. The wide spread underscores the volatility in capital markets due to uncertainty about the Fed’s next policy moves.”
...
The average contract interest rate for 30-year fixed-rate mortgages with conforming loan balances ($647,200 or less) increased to 6.01 percent from 5.94 percent, with points decreasing to 0.76 from 0.79 (including the origination fee) for 80 percent loan-to-value ratio (LTV) loans.
emphasis added
 Click on graph for larger image.
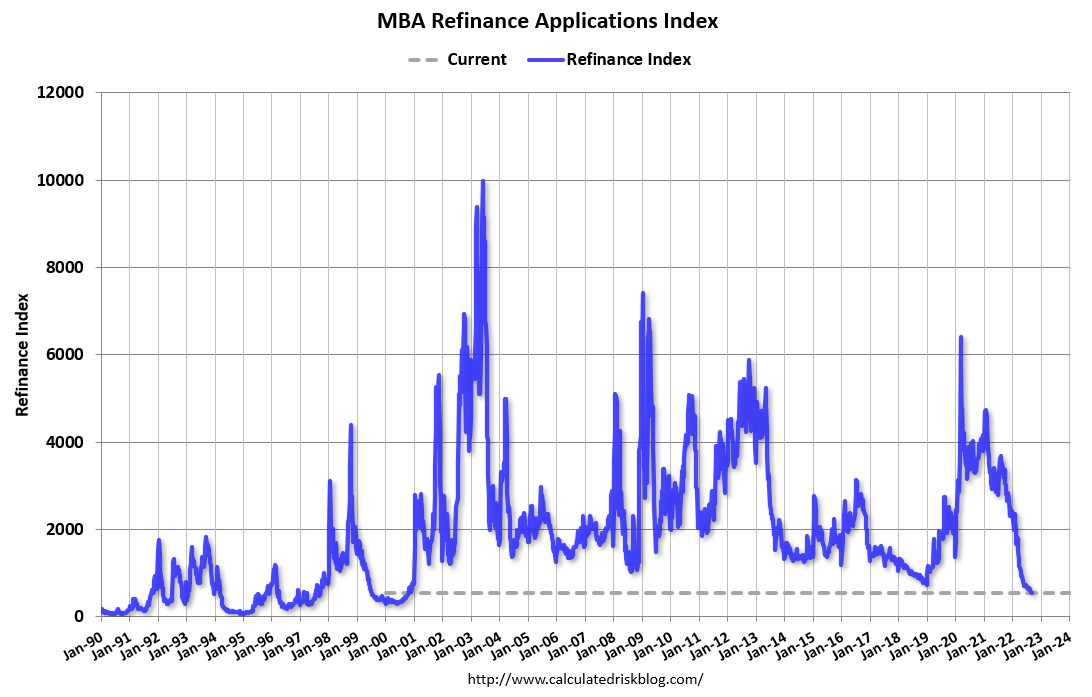
The first graph shows the refinance index since 1990.
With higher mortgage rates, the refinance index has declined sharply this year.
The refinance index is at the lowest level since the year 2000.
The second graph shows the MBA mortgage purchase index
 According to the MBA, purchase activity is down 29% year-over-year unadjusted.
The purchase index is now only 8% above the pandemic low.
Note: Red is a four-week average (blue is weekly).
Note: Red is a four-week average (blue is weekly).
Tuesday, September 13, 2022
Wednesday: PPI
by Calculated Risk on 9/13/2022 09:13:00 PM
 Wednesday:
• At 7:00 AM ET, The Mortgage Bankers Association (MBA) will release the results for the mortgage purchase applications index.
• At 8:30 AM, The Producer Price Index for August from the BLS. The consensus is for a 0.1% decrease in PPI, and a 0.3% increase in core PPI.
On COVID (focus on hospitalizations and deaths):
| COVID Metrics | ||||
|---|---|---|---|---|
| Now | Week Ago | Goal | ||
| New Cases per Day2 | 67,342 | 74,627 | ≤5,0001 | |
| Hospitalized2 | 28,138 | 30,161 | ≤3,0001 | |
| Deaths per Day2 | 358 | 365 | ≤501 | |
| 1my goals to stop daily posts, 27-day average for Cases, Currently Hospitalized, and Deaths 🚩 Increasing 7-day average week-over-week for Cases, Hospitalized, and Deaths ✅ Goal met. | ||||
 Click on graph for larger image.
This graph shows the daily (columns) and 7-day average (line) of deaths reported.
Average daily deaths bottomed in July 2021 at 214 per day.
Current State of the Housing Market; Overview for mid-September
by Calculated Risk on 9/13/2022 01:24:00 PM
Today, in the Calculated Risk Real Estate Newsletter: Current State of the Housing Market
A brief excerpt:
There have been three recent key changes in the housing market:There is much more in the article. You can subscribe at https://calculatedrisk.substack.com/
1. New listings have declined significantly year-over-year.
2. This “Sellers’ Strike” has led to inventory growth stalling.
3. And homeowners have continued to borrow against their home equity, shifting from cash-out refinance to home equity loans (so they can keep their low interest 1st mortgage).
...
In July, inventory was still low, but increasing quickly. However, the decline in new listings has led to inventory growth stalling recently.
Here is a graph from Realtor.com’s August Housing Trends Report.
...
Next week, existing home sales will likely show another sharp year-over-year decline in sales for August - with sales solidly below 5 million SAAR again. Housing starts will probably show further declines (and still a near record number of homes under construction).

Cleveland Fed: Median CPI increased 0.7% and Trimmed-mean CPI increased 0.6% in August
by Calculated Risk on 9/13/2022 11:19:00 AM
The Cleveland Fed released the median CPI and the trimmed-mean CPI this morning:
According to the Federal Reserve Bank of Cleveland, the median Consumer Price Index rose 0.7% in August. The 16% trimmed-mean Consumer Price Index increased 0.6% in August. "The median CPI and 16% trimmed-mean CPI are measures of core inflation calculated by the Federal Reserve Bank of Cleveland based on data released in the Bureau of Labor Statistics’ (BLS) monthly CPI report".
Note: The Cleveland Fed released the median CPI details here: "Motor Fuel" decreased at a 73% annualized rate in August!
Note that Owners' Equivalent Rent and Rent of Primary Residence account for almost 1/3 of median CPI, and these measures were up between 7.5% annualized in the Midwest and almost 11% in the South with an average of close to 8.7%. The year-over-year increase was larger in August than in July.
 Click on graph for larger image.
This graph shows the year-over-year change for these four key measures of inflation.
On a year-over-year basis, the median CPI rose 6.7%, the trimmed-mean CPI rose 7.2%, and the CPI less food and energy rose 6.3%. Core PCE is for July and increased 4.6% year-over-year.
Early Look at 2023 Cost-Of-Living Adjustments and Maximum Contribution Base
by Calculated Risk on 9/13/2022 08:48:00 AM
The BLS reported this morning:
The Consumer Price Index for Urban Wage Earners and Clerical Workers (CPI-W) increased 8.7 percent over the last 12 months to an index level of 291.629 (1982-84=100). For the month, the index declined 0.2 percent prior to seasonal adjustment.CPI-W is the index that is used to calculate the Cost-Of-Living Adjustments (COLA). The calculation dates have changed over time (see Cost-of-Living Adjustments), but the current calculation uses the average CPI-W for the three months in Q3 (July, August, September) and compares to the average for the highest previous average of Q3 months. Note: this is not the headline CPI-U and is not seasonally adjusted (NSA).
• In 2021, the Q3 average of CPI-W was 268.421.
The 2021 Q3 average was the highest Q3 average, so we only have to compare Q3 this year to last year.
 Click on graph for larger image.
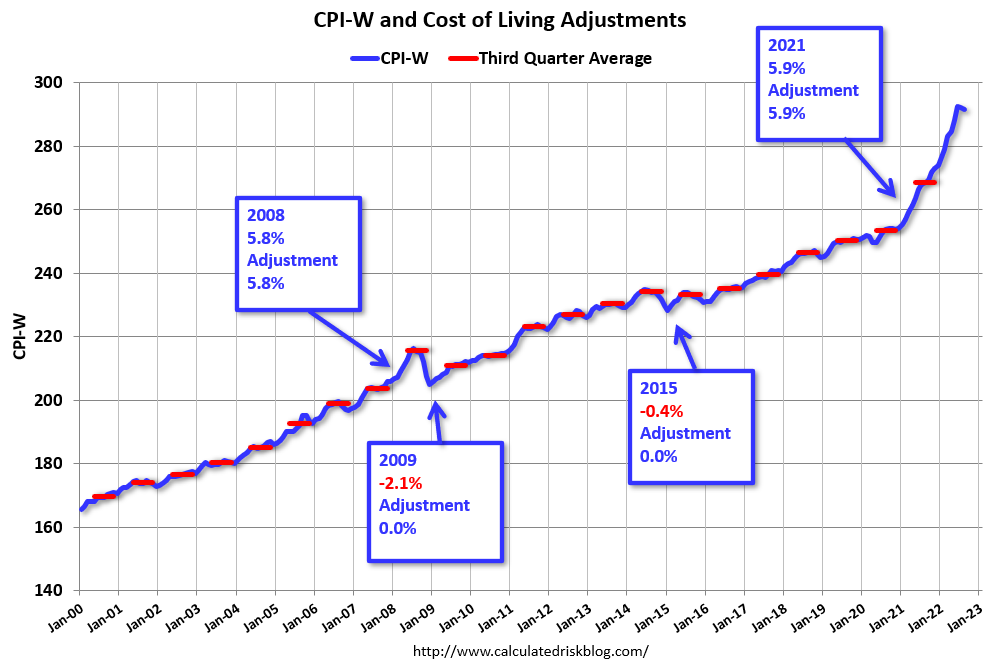
This graph shows CPI-W since January 2000. The red lines are the Q3 average of CPI-W for each year.
Note: The year labeled is for the calculation, and the adjustment is effective for December of that year (received by beneficiaries in January of the following year).
CPI-W was up 8.7% year-over-year in August, and although this is early - we need the data for September - my guess is COLA will probably be around 8.6% to 8.8% this year, the largest increase since 11.2% in 1981 (and larger than the 7.4% increase in 1982).
Contribution and Benefit Base
The contribution base will be adjusted using the National Average Wage Index. This is based on a one-year lag. The National Average Wage Index is not available for 2021 yet, but wages probably increased again in 2021. If wages increased 4% in 2021, then the contribution base next year will increase to around $153,000 in 2023, from the current $147,000.
Remember - this is an early look. What matters is average CPI-W, NSA, for all three months in Q3 (July, August and September).
BLS: CPI increased 0.1% in August; Core CPI increased 0.6%
by Calculated Risk on 9/13/2022 08:32:00 AM
The Consumer Price Index for All Urban Consumers (CPI-U) rose 0.1 percent in August on a seasonally adjusted basis after being unchanged in July, the U.S. Bureau of Labor Statistics reported today. Over the last 12 months, the all items index increased 8.3 percent before seasonal adjustment.Both CPI and core CPI were above expectations. I'll post a graph later today after the Cleveland Fed releases the median and trimmed-mean CPI.
Increases in the shelter, food, and medical care indexes were the largest of many contributors to the broad-based monthly all items increase. These increases were mostly offset by a 10.6-percent decline in the gasoline index. The food index continued to rise, increasing 0.8 percent over the month as the food at home index rose 0.7 percent. The energy index fell 5.0 percent over the month as the gasoline index declined, but the electricity and natural gas indexes increased.
The index for all items less food and energy rose 0.6 percent in August, a larger increase than in July. The indexes for shelter, medical care, household furnishings and operations, new vehicles, motor vehicle insurance, and education were among those that increased over the month. There were some indexes that declined in August, including those for airline fares, communication, and used cars and trucks.
The all items index increased 8.3 percent for the 12 months ending August, a smaller figure than the 8.5-percent increase for the period ending July. The all items less food and energy index rose 6.3 percent over the last 12 months. The energy index increased 23.8 percent for the 12 months ending August, a smaller increase than the 32.9-percent increase for the period ending July. The food index increased 11.4 percent over the last year, the largest 12-month increase since the period ending May 1979.
emphasis added
Monday, September 12, 2022
Tuesday: CPI
by Calculated Risk on 9/12/2022 08:44:00 PM
 From Matthew Graham at Mortgage News Daily: Rates Edge Up; Deep Dive on Mortgages vs 10yr Treasury and Fed Funds Rate
Mortgage rates moved slightly higher today, but only after moving slightly lower earlier this morning. [30 year fixed 5.98%]Tuesday:
emphasis added
• At 6:00 AM ET, NFIB Small Business Optimism Index for August.
• At 8:30 AM, The Consumer Price Index for August from the BLS. The consensus is for a 0.1% decrease in CPI, and a 0.3% increase in core CPI. The consensus is for CPI to be up 8.1% year-over-year and core CPI to be up 6.1% YoY.
On COVID (focus on hospitalizations and deaths):
| COVID Metrics | ||||
|---|---|---|---|---|
| Now | Week Ago | Goal | ||
| New Cases per Day2 | 60,185 | 83,434 | ≤5,0001 | |
| Hospitalized2 | 26,145 | 30,503 | ≤3,0001 | |
| Deaths per Day2 | 328 | 394 | ≤501 | |
| 1my goals to stop daily posts, 27-day average for Cases, Currently Hospitalized, and Deaths 🚩 Increasing 7-day average week-over-week for Cases, Hospitalized, and Deaths ✅ Goal met. | ||||
 Click on graph for larger image.
This graph shows the daily (columns) and 7-day average (line) of deaths reported.
Average daily deaths bottomed in July 2021 at 214 per day.
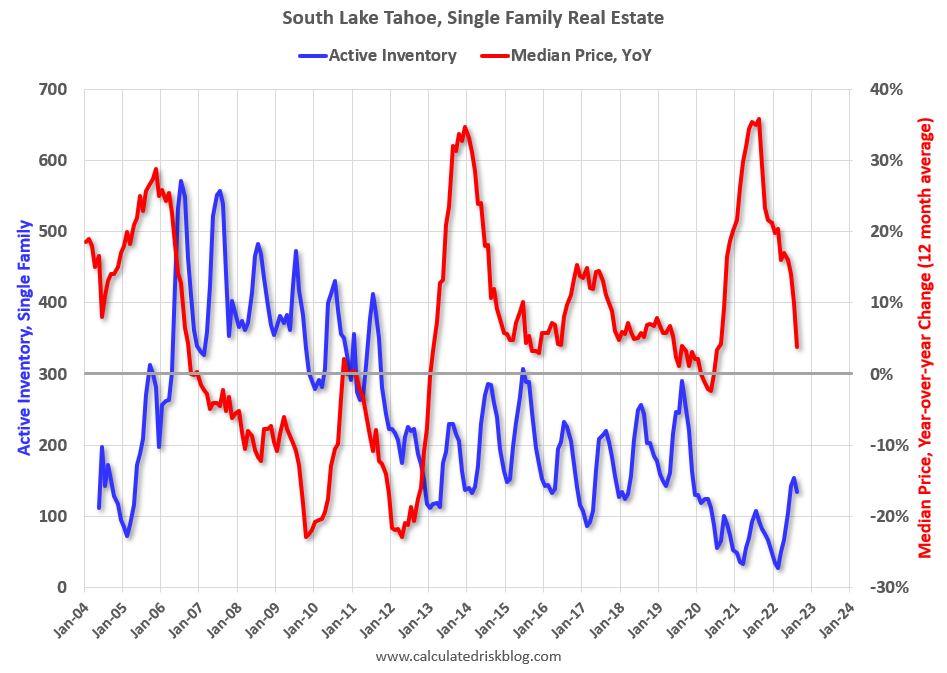
Second Home Market: South Lake Tahoe in August
by Calculated Risk on 9/12/2022 02:52:00 PM
With the pandemic, there was a surge in 2nd home buying.
I'm looking at data for some second home markets - and I'm tracking those markets to see if there is an impact from lending changes, rising mortgage rates or the easing of the pandemic.
This graph is for South Lake Tahoe since 2004 through August 2022, and shows inventory (blue), and the year-over-year (YoY) change in the median price (12-month average).
Note: The median price is distorted by the mix, but this is the available data.
 Click on graph for larger image.
Following the housing bubble, prices declined for several years in South Lake Tahoe, with the median price falling about 50% from the bubble peak.
Currently inventory is still very low, but up 5-fold from the record low set in February 2022, and up 44% year-over-year. Prices are up 3.8% YoY (and the YoY change has been trending down).
It is possible that the YoY change will turn negative soon - even with inventory at historically fairly low levels.
Mortgage Equity Withdrawal Still Strong in Q2; Homeowners now relying on Home Equity lines to extract equity
by Calculated Risk on 9/12/2022 12:26:00 PM
Today, in the Real Estate Newsletter: Mortgage Equity Withdrawal Still Strong in Q2
Excerpt:
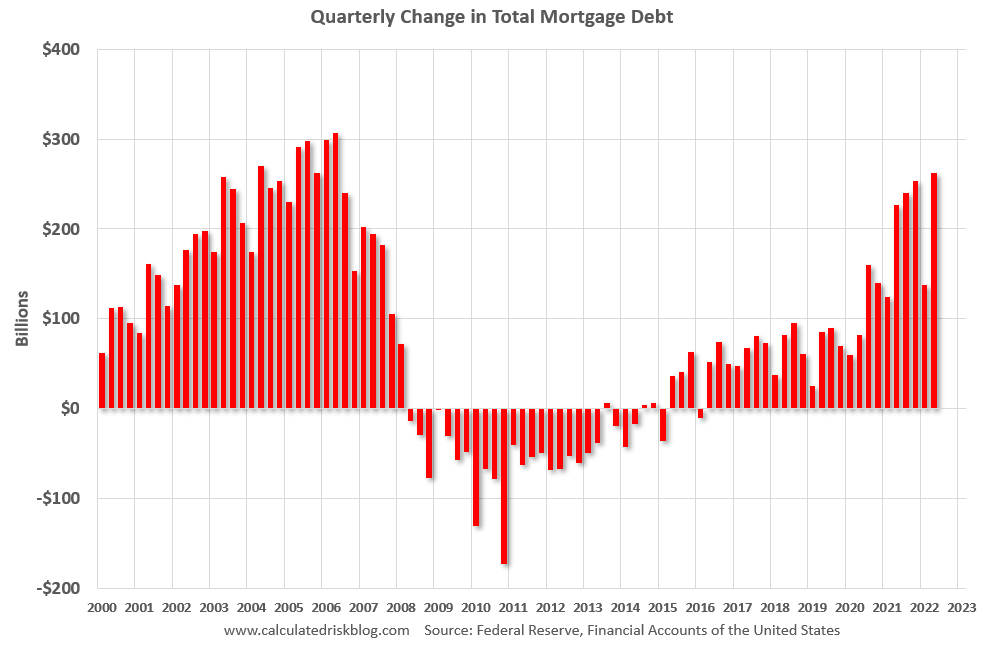
Here is the quarterly increase in mortgage debt from the Federal Reserve’s Financial Accounts of the United States - Z.1 (sometimes called the Flow of Funds report) released on Friday. In the mid ‘00s, there was a large increase in mortgage debt associated with the housing bubble.There is much more in the article. You can subscribe at https://calculatedrisk.substack.com/ (All ad free, most content free).
In Q2 2022, mortgage debt increased $263 billion, the most since 2006. Note the almost 7 years of declining mortgage debt as distressed sales (foreclosures and short sales) wiped out a significant amount of debt.
However, some of this debt is being used to increase the housing stock (purchase new homes), so this isn’t all Mortgage Equity Withdrawal (MEW).