by Calculated Risk on 9/15/2022 09:30:00 AM
Thursday, September 15, 2022
Q2 Update: Delinquencies, Foreclosures and REO
Today, in the Calculated Risk Real Estate Newsletter: Q2 Update: Delinquencies, Foreclosures and REO
A brief excerpt:
Last year, I pointed out that the foreclosure moratorium, combined with the expiration of a large number of forbearance plans, would NOT lead to a surge in foreclosures and impact house prices (as happened following the housing bubble).There is much more in the article. You can subscribe at https://calculatedrisk.substack.com/
...
Here is some data on REOs through Q2 2022 …
...
We will probably see an increase in REOs in late 2022 and into 2023 following the end of the moratoriums.
This graph shows the nominal dollar value of Residential REO for FDIC insured institutions. Note: The FDIC reports the dollar value and not the total number of REOs.
The dollar value of 1-4 family residential Real Estate Owned (REOs, foreclosure houses) decreased slightly from $788 million in Q1 2022 to $784 million in Q2 2022. (Probably declined in 2020 and 2021 due to foreclosure moratoriums, forbearance programs and house price increases).
...
The bottom line is there will be an increase in foreclosures late this year and next (from record low levels), but it will not be a huge wave of foreclosures as happened following the housing bubble. The distressed sales during the housing bust led to cascading price declines, and that will not happen this time.
Industrial Production Decreased 0.2 Percent in August
by Calculated Risk on 9/15/2022 09:21:00 AM
From the Fed: Industrial Production and Capacity Utilization
Industrial production decreased 0.2 percent in August. Manufacturing output edged up 0.1 percent after increasing 0.6 percent in July. The index for mining was unchanged, and the index for utilities decreased 2.3 percent. At 104.5 percent of its 2017 average, total industrial production in August was 3.7 percent above its year-earlier level. Capacity utilization declined 0.2 percentage point in August to 80.0 percent, a rate that is 0.4 percentage point above its long-run (1972–2021) average.
emphasis added
 Click on graph for larger image.
This graph shows Capacity Utilization. This series is up from the record low set in April 2020, and above the level in February 2020 (pre-pandemic).
Capacity utilization at 80.0% is 0.4% above the average from 1972 to 2021. This was below consensus expectations.
Note: y-axis doesn't start at zero to better show the change.
 The second graph shows industrial production since 1967.
Industrial production decreased in August to 104.5. This is above the pre-pandemic level.
The change in industrial production was below consensus expectations.
Retail Sales Increase 0.3% in August
by Calculated Risk on 9/15/2022 08:43:00 AM
On a monthly basis, retail sales were up 0.3% from July to August (seasonally adjusted), and sales were up 9.1 percent from July 2021.
From the Census Bureau report:
Advance estimates of U.S. retail and food services sales for August 2022, adjusted for seasonal variation and holiday and trading-day differences, but not for price changes, were $683.3 billion, an increase of 0.3 percent from the previous month, and 9.1 percent above August 2021. ... The June 2022 to July 2022 percent change was revised from virtually unchanged to down 0.4 percent.
emphasis added
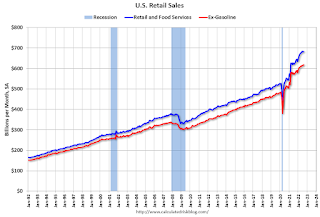 Click on graph for larger image.
This graph shows retail sales since 1992. This is monthly retail sales and food service, seasonally adjusted (total and ex-gasoline).
Retail sales ex-gasoline were up 0.8% in August.
The second graph shows the year-over-year change in retail sales and food service (ex-gasoline) since 1993.
Retail and Food service sales, ex-gasoline, increased by 7.6% on a YoY basis.
 Sales in August were slightly above expectations, and sales in May, June and July were revised up, combined.
Weekly Initial Unemployment Claims decrease to 213,000
by Calculated Risk on 9/15/2022 08:32:00 AM
The DOL reported:
In the week ending September 10, the advance figure for seasonally adjusted initial claims was 213,000, a decrease of 5,000 from the previous week's revised level. The previous week's level was revised down by 4,000 from 222,000 to 218,000. The 4-week moving average was 224,000, a decrease of 8,000 from the previous week's revised average. The previous week's average was revised down by 1,000 from 233,000 to 232,000.The following graph shows the 4-week moving average of weekly claims since 1971.
emphasis added
 Click on graph for larger image.
The dashed line on the graph is the current 4-week average. The four-week average of weekly unemployment claims decreased to 224,000.
The previous week was revised down.
Weekly claims were below the consensus forecast.
Wednesday, September 14, 2022
Thursday: Retail Sales, Unemployment Claims, Industrial Production, Philly Fed Mfg, NY Fed Mfg
by Calculated Risk on 9/14/2022 08:33:00 PM
Thursday:
• At 8:30 AM: The initial weekly unemployment claims report will be released. The consensus is for an increase to 225 thousand from 222 thousand last week.
• Also, at 8:30 AM ET: Retail sales for August will be released. The consensus is for a 0.2% increase in retail sales.
• Also, at 8:30 AM: the Philly Fed manufacturing survey for September. The consensus is for a reading of 3.5, down from 6.2.
• Also, at 8:30 AM ET: The New York Fed Empire State manufacturing survey for September. The consensus is for a reading of -13.9, up from -31.3.
• At 9:15 AM: The Fed will release Industrial Production and Capacity Utilization for August. The consensus is for a 0.2% increase in Industrial Production, and for Capacity Utilization to increase to 80.3%.
On COVID (focus on hospitalizations and deaths):
| COVID Metrics | ||||
|---|---|---|---|---|
| Now | Week Ago | Goal | ||
| New Cases per Day2 | 60,558 | 75,629 | ≤5,0001 | |
| Hospitalized2 | 28,238 | 29,848 | ≤3,0001 | |
| Deaths per Day2 | 350 | 352 | ≤501 | |
| 1my goals to stop daily posts, 27-day average for Cases, Currently Hospitalized, and Deaths 🚩 Increasing 7-day average week-over-week for Cases, Hospitalized, and Deaths ✅ Goal met. | ||||
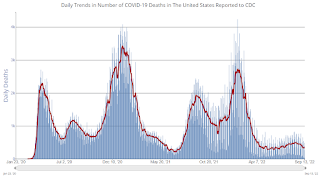 Click on graph for larger image.
This graph shows the daily (columns) and 7-day average (line) of deaths reported.
30-Year Mortgage Rates at 6.30%; 14 Year High
by Calculated Risk on 9/14/2022 05:38:00 PM
From Matthew Graham at MortgageNewsDaily: Boring Day For Rates, But Not "Good" Boring
The mortgage market is no stranger to excitement in 2022. Unfortunately, it hasn't been the good kind of excitement. That's especially true of the past few weeks as rates pushed back up to long term highs. After yesterday's upside surprise in the Consumer Price Index (a key inflation report that frequently causes volatility in markets), rates surged up to match the highest levels in 14 years.
...
Lenders continue to offer rates in the low to mid 6% range. Many loans continue to require a historically high amount of upfront cost due to pricing constraints in the mortgage bond market (i.e. investors aren't offering premiums to buy loans that run a high risk of being paid off the moment rates drop enough for a refi to make sense).
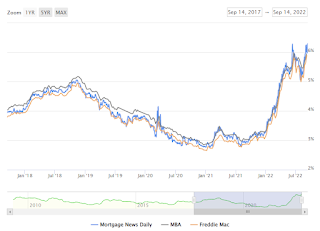 Click on graph for larger image.
This is a graph from Mortgage News Daily (MND) showing 30-year fixed rates from three sources (MND, MBA, Freddie Mac) over the last 5 years.
2nd Look at Local Housing Markets in August
by Calculated Risk on 9/14/2022 11:20:00 AM
Today, in the Calculated Risk Real Estate Newsletter: 2nd Look at Local Housing Markets in August
A brief excerpt:
This is the second look at local markets in August. I’m tracking about 35 local housing markets in the US. Some of the 35 markets are states, and some are metropolitan areas. I’ll update these tables throughout the month as additional data is released.There is much more in the article. You can subscribe at https://calculatedrisk.substack.com/
The big story for August existing home sales is the sharp year-over-year (YoY) decline in sales. Another key story is that new listings are down YoY in August as the sellers’ strike continues. Of course, active listings are up sharply YoY, but inventory growth has stalled. The increase in inventory so far has been due to softer demand, likely because of higher mortgage rates.
In August, sales in these markets were down 20.2%.
Note that in August 2022, there was one more selling day than in August 2021, so the SA decline in August sales will be larger than the NSA decline.
The opposite was true in July (one more selling day in July 2021 than in July 2022). So, seasonally adjusted, this is probably close to the same YoY decline as in July.
Many more local markets to come!
MBA: Mortgage Applications Decrease in Latest Weekly Survey
by Calculated Risk on 9/14/2022 07:00:00 AM
From the MBA: Mortgage Applications Decrease in Latest MBA Weekly Survey
Mortgage applications decreased 1.2 percent from one week earlier, according to data from the Mortgage Bankers Association’s (MBA) Weekly Mortgage Applications Survey for the week ending September 9, 2022. This week’s results include an adjustment for the observance of Labor Day.
... The Refinance Index decreased 4 percent from the previous week and was 83 percent lower than the same week one year ago. The seasonally adjusted Purchase Index increased 0.2 percent from one week earlier. The unadjusted Purchase Index decreased 12 percent compared with the previous week and was 29 percent lower than the same week one year ago.
“The 30-year fixed mortgage rate hit the six percent mark for the first time since 2008 – rising to 6.01 percent – which is essentially double what it was a year ago,” said Joel Kan, MBA’s Associate Vice President of Economic and Industry Forecasting. “Higher mortgage rates have pushed refinance activity down more than 80 percent from last year and have contributed to more homebuyers staying on the sidelines. Government loans, which tend to be favored by first-time buyers, bucked this trend and increased over the week, driven mainly by VA and USDA lending activity.”
Added Kan, “The spread between the conforming 30-year fixed mortgage rate and both ARM and jumbo loans remained wide last week, at 118 and 45 basis points, respectively. The wide spread underscores the volatility in capital markets due to uncertainty about the Fed’s next policy moves.”
...
The average contract interest rate for 30-year fixed-rate mortgages with conforming loan balances ($647,200 or less) increased to 6.01 percent from 5.94 percent, with points decreasing to 0.76 from 0.79 (including the origination fee) for 80 percent loan-to-value ratio (LTV) loans.
emphasis added
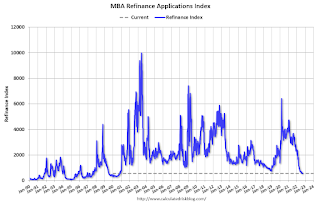 Click on graph for larger image.
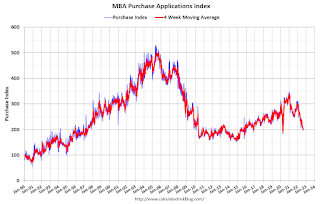
The first graph shows the refinance index since 1990.
Note: Red is a four-week average (blue is weekly).
Tuesday, September 13, 2022
Wednesday: PPI
by Calculated Risk on 9/13/2022 09:13:00 PM

• At 7:00 AM ET, The Mortgage Bankers Association (MBA) will release the results for the mortgage purchase applications index.
• At 8:30 AM, The Producer Price Index for August from the BLS. The consensus is for a 0.1% decrease in PPI, and a 0.3% increase in core PPI.
On COVID (focus on hospitalizations and deaths):
| COVID Metrics | ||||
|---|---|---|---|---|
| Now | Week Ago | Goal | ||
| New Cases per Day2 | 67,342 | 74,627 | ≤5,0001 | |
| Hospitalized2 | 28,138 | 30,161 | ≤3,0001 | |
| Deaths per Day2 | 358 | 365 | ≤501 | |
| 1my goals to stop daily posts, 27-day average for Cases, Currently Hospitalized, and Deaths 🚩 Increasing 7-day average week-over-week for Cases, Hospitalized, and Deaths ✅ Goal met. | ||||
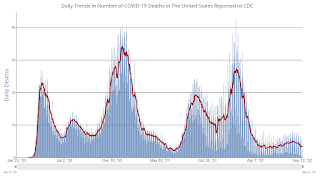 Click on graph for larger image.
This graph shows the daily (columns) and 7-day average (line) of deaths reported.
Current State of the Housing Market; Overview for mid-September
by Calculated Risk on 9/13/2022 01:24:00 PM
Today, in the Calculated Risk Real Estate Newsletter: Current State of the Housing Market
A brief excerpt:
There have been three recent key changes in the housing market:There is much more in the article. You can subscribe at https://calculatedrisk.substack.com/
1. New listings have declined significantly year-over-year.
2. This “Sellers’ Strike” has led to inventory growth stalling.
3. And homeowners have continued to borrow against their home equity, shifting from cash-out refinance to home equity loans (so they can keep their low interest 1st mortgage).
...
In July, inventory was still low, but increasing quickly. However, the decline in new listings has led to inventory growth stalling recently.
Here is a graph from Realtor.com’s August Housing Trends Report.
...
Next week, existing home sales will likely show another sharp year-over-year decline in sales for August - with sales solidly below 5 million SAAR again. Housing starts will probably show further declines (and still a near record number of homes under construction).

