 RSS Feed
 by Calculated Risk on 9/16/2022 09:34:00 PM
Friday, September 16, 2022
COVID Sept 16, 2022, Update on Cases, Hospitalizations and Deaths
On COVID (focus on hospitalizations and deaths):
| COVID Metrics | ||||
|---|---|---|---|---|
| Now | Week Ago | Goal | ||
| New Cases per Day2 | 60,831 | 68,949 | ≤5,0001 | |
| Hospitalized2 | 27,336 | 29,482 | ≤3,0001 | |
| Deaths per Day2🚩 | 391 | 342 | ≤501 | |
| 1my goals to stop daily posts, 27-day average for Cases, Currently Hospitalized, and Deaths 🚩 Increasing 7-day average week-over-week for Cases, Hospitalized, and Deaths ✅ Goal met. | ||||
 Click on graph for larger image.
This graph shows the daily (columns) and 7-day average (line) of deaths reported.
Average daily deaths bottomed in July 2021 at 214 per day.
California Home Sales off 24% YoY in August, Prices Up Only 1.4% YoY; August Existing Home Sales Forecast
by Calculated Risk on 9/16/2022 03:24:00 PM
Today, in the Calucalated Risk Newsletter: California Home Sales off 24% YoY in August, Prices Up Only 1.4% YoY; August Existing Home Sales Forecast
On California:August’s sales pace was up 6.1 percent on a monthly basis from 295,460 in July and down 24.4 percent from a year ago, when 414,860 homes were sold on an annualized basis. ... The statewide median price edged up 0.7 percent in August to $839,460 from the $833,910 recorded in July and was up 1.4 percent from the $827,940 recorded last August. The year-over-year price gain was the smallest in more than two years.From housing economist Tom Lawler:I project that existing home sales as estimated by the National Association of Realtors ran at a seasonally adjusted annual rate of 4.84 million in August, up 0.6% from July’s preliminary pace and down 19.2% from last August’s seasonally adjusted pace.
Q3 GDP Tracking: Close to 1%
by Calculated Risk on 9/16/2022 01:31:00 PM
From BofA:
On net, the data on retail trade and IP helped push our 3Q US GDP tracking estimate lower by 0.3pp to 0.8% qoq saar. Activity appears to be rebounding in the second half of the year off its first-half decline, but not by much. [September 16th estimate]From Goldman:
emphasis added
We left our Q3 GDP tracking estimate unchanged at +1.1% (qoq ar). [September 15th estimate]And from the Altanta Fed: GDPNow
The GDPNow model estimate for real GDP growth (seasonally adjusted annual rate) in the third quarter of 2022 is 0.5 percent on September 15, down from 1.3 percent on September 9. After this week's releases from the US Department of the Treasury's Bureau of the Fiscal Service, the US Bureau of Labor Statistics, the US Census Bureau, and the Federal Reserve Board of Governors, decreases in the nowcasts of third-quarter real personal consumption expenditures growth and third-quarter real gross private domestic investment growth from 1.7 percent and -6.1 percent, respectively, to 0.4 percent and -6.4 percent, respectively, was slightly offset by an increase in the nowcast of third-quarter real government spending growth from 1.3 percent to 2.0 percent.[September 15th estimate]
Predicting the Next Recession
by Calculated Risk on 9/16/2022 09:29:00 AM
The recession callers were back in the first half of 2022, and some like ARK's Cathie Wood and Home Depot's Ken Langone claimed the US was already in a recession. I disagreed and noted I wasn't even on recession watch!
We did see negative real GDP growth in Q1 and in Q2 - but that didn't mean the US economy was in a recession (and this has never been the definition of a US recession). For a discussion of recessions, see NBER's What is a recession?
In that 2013 post, I wrote:
 Click on graph for larger image.
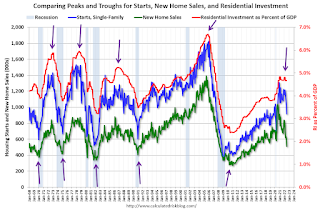
The arrows point to some of the earlier peaks and troughs for these three measures - and the most recent peak.
The purpose of this graph is to show that these three indicators generally reach peaks and troughs together. Note that Residential Investment is quarterly and single-family starts and new home sales are monthly.
New home sales and single-family starts turned down last year, but that was partly due to the huge surge in sales during the pandemic - and then rebounded somewhat. Now both new home sales and single-family starts have turned down in response to higher mortgage rates. Residential investment has also peaked.
 The second graph shows the YoY change in New Home Sales from the Census Bureau. Currently new home sales (based on 3-month average) are down 10% year-over-year.
Note: the New Home Sales data is smoothed using a three month centered average before calculating the YoY change. The Census Bureau data starts in 1963.
Some observations:
1) When the YoY change in New Home Sales falls about 20%, usually a recession will follow. An exception for this data series was the mid '60s when the Vietnam buildup kept the economy out of recession. Another exception was in late 2021 - we saw a significant YoY decline in new home sales related to the pandemic and the surge in new home sales in the second half of 2020. I ignored that pandemic distortion.
Also, there are two measures of economic growth - Gross Domestic Product (GDP), and Gross Domestic Income (GDI). See: Better Measure of Output: GDP or GDI?
The Bureau of Economic Analysis (BEA) produces two measures of national output which, in theory, should be equivalent. In practice, however, there are often substantive differences.
And when there are differences, GDP is usually revised towards GDI. And guess what? GDI was positive in both Q1 and Q2. And other measures of the economy were also positive, especially employment. So, it is extremely unlikely there was a recession.
Way back in 2013, I wrote a post "Predicting the Next Recession. This post was in response to several recession forecasts (that were also incorrect).
In that 2013 post, I wrote:
The next recession will probably be caused by one of the following (from least likely to most likely):Unfortunately, in 2020, one of those low probability events happened (pandemic), and that led to a recession in 2020.
3) An exogenous event such as a pandemic, significant military conflict, disruption of energy supplies for any reason, a major natural disaster (meteor strike, super volcano, etc), and a number of other low probability reasons. All of these events are possible, but they are unpredictable, and the probabilities are low that they will happen in the next few years or even decades.
emphasis added
2) Significant policy error. Two examples: not reaching a fiscal agreement and going off the "fiscal cliff" probably would have led to a recession, and Congress refusing to "pay the bills" would have been a policy error that would have taken the economy into recession.We've seen several policy errors, mostly related to immigration and trade during the previous administration, but none that would lead the economy into a recession.
1) Most of the post-WWII recessions were caused by the Fed tightening monetary policy to slow inflation. I think this is the most likely cause of the next recession. Usually, when inflation starts to become a concern, the Fed tries to engineer a "soft landing", and frequently the result is a recession.And this most common cause of a recession is the current concern. Since inflation picked up, mostly due to the pandemic (stimulus spending, supply constraints) and due to the invasion of Ukraine, the Fed has embarked on a tightening cycle to slow inflation.
The Fed cannot ease pandemic related supply constraints (except by curbing demand), and the Fed cannot stop the war. So, there is a possibility that the Fed will tighten too much and that will lead to a "hard landing" (aka recession).
The key will be to watch housing. Housing is the main transmission mechanism for Fed policy. One of my favorite models for business cycle forecasting uses new home sales (also housing starts and residential investment). I also look at the yield curve, but I've found new home sales is generally more useful. (See my post in 2019: Don't Freak Out about the Yield Curve)
For the economy, what I focus on is single family starts and new home sales. For the bottoms and tops of key housing activity, here is a graph of Single-family housing starts, New Home Sales, and Residential Investment (RI) as a percent of GDP.
Note: The pandemic has distorted the economic data, and as I've noted many times, we can't be a slave to any model.
 Click on graph for larger image.
The arrows point to some of the earlier peaks and troughs for these three measures - and the most recent peak.
The purpose of this graph is to show that these three indicators generally reach peaks and troughs together. Note that Residential Investment is quarterly and single-family starts and new home sales are monthly.
New home sales and single-family starts turned down last year, but that was partly due to the huge surge in sales during the pandemic - and then rebounded somewhat. Now both new home sales and single-family starts have turned down in response to higher mortgage rates. Residential investment has also peaked.
 The second graph shows the YoY change in New Home Sales from the Census Bureau. Currently new home sales (based on 3-month average) are down 10% year-over-year.
Note: the New Home Sales data is smoothed using a three month centered average before calculating the YoY change. The Census Bureau data starts in 1963.
Some observations:
1) When the YoY change in New Home Sales falls about 20%, usually a recession will follow. An exception for this data series was the mid '60s when the Vietnam buildup kept the economy out of recession. Another exception was in late 2021 - we saw a significant YoY decline in new home sales related to the pandemic and the surge in new home sales in the second half of 2020. I ignored that pandemic distortion.
Also note that the sharp decline in 2010 was related to the housing tax credit policy in 2009 - and was just a continuation of the housing bust.
2) It is also interesting to look at the '86/'87 and the mid '90s periods. New Home sales fell in both of these periods, although not quite 20%. As I noted in earlier posts, the mid '80s saw a surge in defense spending and MEW that more than offset the decline in New Home sales. In the mid '90s, nonresidential investment remained strong.
If the Fed tightening cycle will lead to a recession, we should see housing turn down first (new home sales, single family starts, residential investment). This is now happening, but this usually leads the economy by a year or more. So, we might be looking at a recession in 2023.
There are other indicators too - such as the yield curve and heavy truck sales - but mostly I'll be watching housing.
Note: I will look at comparing to 2019 to remove the pandemic distortions.
Thursday, September 15, 2022
Q2 Update: Delinquencies, Foreclosures and REO
by Calculated Risk on 9/15/2022 09:30:00 AM
Today, in the Calculated Risk Real Estate Newsletter: Q2 Update: Delinquencies, Foreclosures and REO
A brief excerpt:
Last year, I pointed out that the foreclosure moratorium, combined with the expiration of a large number of forbearance plans, would NOT lead to a surge in foreclosures and impact house prices (as happened following the housing bubble).There is much more in the article. You can subscribe at https://calculatedrisk.substack.com/
...
Here is some data on REOs through Q2 2022 …
...
We will probably see an increase in REOs in late 2022 and into 2023 following the end of the moratoriums.
This graph shows the nominal dollar value of Residential REO for FDIC insured institutions. Note: The FDIC reports the dollar value and not the total number of REOs.
The dollar value of 1-4 family residential Real Estate Owned (REOs, foreclosure houses) decreased slightly from $788 million in Q1 2022 to $784 million in Q2 2022. (Probably declined in 2020 and 2021 due to foreclosure moratoriums, forbearance programs and house price increases).
...
The bottom line is there will be an increase in foreclosures late this year and next (from record low levels), but it will not be a huge wave of foreclosures as happened following the housing bubble. The distressed sales during the housing bust led to cascading price declines, and that will not happen this time.

Industrial Production Decreased 0.2 Percent in August
by Calculated Risk on 9/15/2022 09:21:00 AM
From the Fed: Industrial Production and Capacity Utilization
Industrial production decreased 0.2 percent in August. Manufacturing output edged up 0.1 percent after increasing 0.6 percent in July. The index for mining was unchanged, and the index for utilities decreased 2.3 percent. At 104.5 percent of its 2017 average, total industrial production in August was 3.7 percent above its year-earlier level. Capacity utilization declined 0.2 percentage point in August to 80.0 percent, a rate that is 0.4 percentage point above its long-run (1972–2021) average.
emphasis added
 Click on graph for larger image.
This graph shows Capacity Utilization. This series is up from the record low set in April 2020, and above the level in February 2020 (pre-pandemic).
Capacity utilization at 80.0% is 0.4% above the average from 1972 to 2021. This was below consensus expectations.
Note: y-axis doesn't start at zero to better show the change.
 The second graph shows industrial production since 1967.
Industrial production decreased in August to 104.5. This is above the pre-pandemic level.
The change in industrial production was below consensus expectations.
Retail Sales Increase 0.3% in August
by Calculated Risk on 9/15/2022 08:43:00 AM
On a monthly basis, retail sales were up 0.3% from July to August (seasonally adjusted), and sales were up 9.1 percent from July 2021.
From the Census Bureau report:
Advance estimates of U.S. retail and food services sales for August 2022, adjusted for seasonal variation and holiday and trading-day differences, but not for price changes, were $683.3 billion, an increase of 0.3 percent from the previous month, and 9.1 percent above August 2021. ... The June 2022 to July 2022 percent change was revised from virtually unchanged to down 0.4 percent.
emphasis added
 Click on graph for larger image.
This graph shows retail sales since 1992. This is monthly retail sales and food service, seasonally adjusted (total and ex-gasoline).
Retail sales ex-gasoline were up 0.8% in August.
The second graph shows the year-over-year change in retail sales and food service (ex-gasoline) since 1993.
Retail and Food service sales, ex-gasoline, increased by 7.6% on a YoY basis.
 Sales in August were slightly above expectations, and sales in May, June and July were revised up, combined.
Weekly Initial Unemployment Claims decrease to 213,000
by Calculated Risk on 9/15/2022 08:32:00 AM
The DOL reported:
In the week ending September 10, the advance figure for seasonally adjusted initial claims was 213,000, a decrease of 5,000 from the previous week's revised level. The previous week's level was revised down by 4,000 from 222,000 to 218,000. The 4-week moving average was 224,000, a decrease of 8,000 from the previous week's revised average. The previous week's average was revised down by 1,000 from 233,000 to 232,000.The following graph shows the 4-week moving average of weekly claims since 1971.
emphasis added
 Click on graph for larger image.
The dashed line on the graph is the current 4-week average. The four-week average of weekly unemployment claims decreased to 224,000.
The previous week was revised down.
Weekly claims were below the consensus forecast.
Wednesday, September 14, 2022
Thursday: Retail Sales, Unemployment Claims, Industrial Production, Philly Fed Mfg, NY Fed Mfg
by Calculated Risk on 9/14/2022 08:33:00 PM
Thursday:
• At 8:30 AM: The initial weekly unemployment claims report will be released. The consensus is for an increase to 225 thousand from 222 thousand last week.
• Also, at 8:30 AM ET: Retail sales for August will be released. The consensus is for a 0.2% increase in retail sales.
• Also, at 8:30 AM: the Philly Fed manufacturing survey for September. The consensus is for a reading of 3.5, down from 6.2.
• Also, at 8:30 AM ET: The New York Fed Empire State manufacturing survey for September. The consensus is for a reading of -13.9, up from -31.3.
• At 9:15 AM: The Fed will release Industrial Production and Capacity Utilization for August. The consensus is for a 0.2% increase in Industrial Production, and for Capacity Utilization to increase to 80.3%.
On COVID (focus on hospitalizations and deaths):
| COVID Metrics | ||||
|---|---|---|---|---|
| Now | Week Ago | Goal | ||
| New Cases per Day2 | 60,558 | 75,629 | ≤5,0001 | |
| Hospitalized2 | 28,238 | 29,848 | ≤3,0001 | |
| Deaths per Day2 | 350 | 352 | ≤501 | |
| 1my goals to stop daily posts, 27-day average for Cases, Currently Hospitalized, and Deaths 🚩 Increasing 7-day average week-over-week for Cases, Hospitalized, and Deaths ✅ Goal met. | ||||
Click on graph for larger image.This graph shows the daily (columns) and 7-day average (line) of deaths reported.
Average daily deaths bottomed in July 2021 at 214 per day.
30-Year Mortgage Rates at 6.30%; 14 Year High
by Calculated Risk on 9/14/2022 05:38:00 PM
From Matthew Graham at MortgageNewsDaily: Boring Day For Rates, But Not "Good" Boring
The mortgage market is no stranger to excitement in 2022. Unfortunately, it hasn't been the good kind of excitement. That's especially true of the past few weeks as rates pushed back up to long term highs. After yesterday's upside surprise in the Consumer Price Index (a key inflation report that frequently causes volatility in markets), rates surged up to match the highest levels in 14 years.
...
Lenders continue to offer rates in the low to mid 6% range. Many loans continue to require a historically high amount of upfront cost due to pricing constraints in the mortgage bond market (i.e. investors aren't offering premiums to buy loans that run a high risk of being paid off the moment rates drop enough for a refi to make sense).
 Click on graph for larger image.
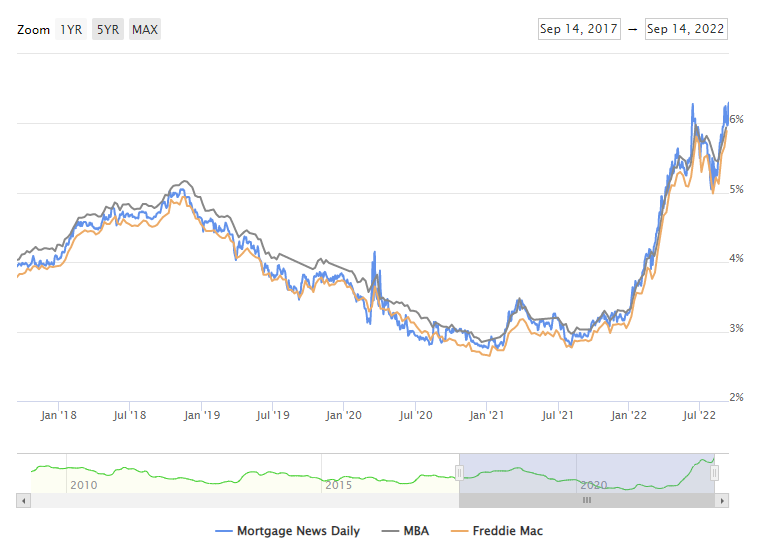
This is a graph from Mortgage News Daily (MND) showing 30-year fixed rates from three sources (MND, MBA, Freddie Mac) over the last 5 years.
The 30-year fixed rate for top tier scenarios was 6.30% today, up from the recent low of 5.05% on August 1st.
Go to MND and you can adjust the graph for different time periods.


