by Calculated Risk on 9/21/2022 10:51:00 AM
Wednesday, September 21, 2022
More Analysis on August Existing Home Sales
Today, in the CalculatedRisk Real Estate Newsletter: NAR: Existing-Home Sales Decreased Slightly to 4.80 million SAAR in August
Excerpt:
On prices, the NAR reported:There is much more in the article. You can subscribe at https://calculatedrisk.substack.com/ (Most content is available for free, so please subscribe).The median existing-home price for all housing types in August was $389,500, a 7.7% jump from August 2021 ($361,500), as prices ascended in all regions. This marks 126 consecutive months of year-over-year increases, the longest-running streak on record. However, it was the second month in a row that the median sales price retracted after reaching a record high of $413,800 in June, the usual seasonal trend of prices declining after peaking in the early summer.Median prices are distorted by the mix (repeat sales indexes like Case-Shiller and FHFA are probably better for measuring prices).
The YoY change in the median price peaked at 25.2% in May 2021 and has now slowed to 7.7%. The YoY increase in August was smaller than in July (9.5%) and suggests the Case-Shiller index will slow sharply soon. Note that the median price usually starts falling seasonally in July, so the 2.4% decline from July to August in the median price was partially seasonal (but the decline over the last two months has been much larger than the usual decline).
NAR: Existing-Home Sales Decreased to 4.80 million SAAR in August
by Calculated Risk on 9/21/2022 10:13:00 AM
From the NAR: Existing-Home Sales Slipped 0.4% in August
Existing-home sales experienced a slight dip in August, marking the seventh consecutive month of declines, according to the National Association of REALTORS®. Month-over-month sales varied across the four major U.S. regions as two regions recorded increases, one was unchanged and the other posted a drop. On a year-over-year basis, however, sales fell in all regions.
Total existing-home sales, completed transactions that include single-family homes, townhomes, condominiums and co-ops, notched a minor contraction of 0.4% from July to a seasonally adjusted annual rate of 4.80 million in August. Year-over-year, sales faded by 19.9% (5.99 million in August 2021).
...
Total housing inventory registered at the end of August was 1,280,000 units, a decrease of 1.5% from July and unchanged from the previous year. Unsold inventory sits at a 3.2-month supply at the current sales pace – identical to July and up from 2.6 months in August 2021.
emphasis added
 Click on graph for larger image.
This graph shows existing home sales, on a Seasonally Adjusted Annual Rate (SAAR) basis since 1993.
Sales in August (4.80 million SAAR) were down 0.4% from the previous month and were 19.9% below the August 2021 sales rate.
The second graph shows nationwide inventory for existing homes.
 According to the NAR, inventory decreased to 1.28 million in August from 1.30 million in July.
The last graph shows the year-over-year (YoY) change in reported existing home inventory and months-of-supply. Since inventory is not seasonally adjusted, it really helps to look at the YoY change. Note: Months-of-supply is based on the seasonally adjusted sales and not seasonally adjusted inventory.
 Inventory was unchanged year-over-year (blue) in August compared to August 2021.
 Months of supply (red) was unchanged at 3.2 months in August from 3.2 months in July.
This was above the consensus forecast. I'll have more later.
AIA: Architecture Billings Index shows "Demand for design services accelerates" in August
by Calculated Risk on 9/21/2022 08:59:00 AM
Note: This index is a leading indicator primarily for new Commercial Real Estate (CRE) investment.
From the AIA: Demand for design services accelerates
Demand for design services from U.S. architecture firms grew at an accelerated pace in August, according to a new report today from The American Institute of Architects (AIA).
AIA’s Architecture Billings Index (ABI) score for August rose to 53.3 compared to 51.0 in July (any score above 50 indicates an increase in billings). During August, the score for new project inquiries rose to 57.9 from 56.1 the previous month, while the design contracts score softened slightly with a score of 52.3, down from 52.9 in July.
“While a strengthening billings score is encouraging, the flat scoring across regions and sectors is indicative of a nationwide deceleration over the next several months, said AIA Chief Economist, Kermit Baker, Hon. AIA, PhD. “A variety of economic storm clouds continue to gather, but since design activity continues to increase, we can expect at least another 9–12-month runway before building construction activity is negatively affected.”
...
• Regional averages: South (52.9); Midwest (51.4); West (50.2); Northeast (49.8)
• Sector index breakdown: multi-family residential (52.0); institutional (52.0); commercial/industrial (51.2); mixed practice (51.2)
emphasis added
 Click on graph for larger image.
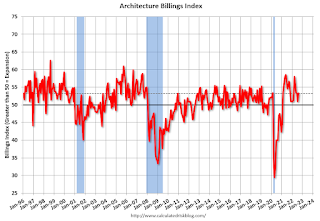
This graph shows the Architecture Billings Index since 1996. The index was at 53.3 in August, up from 51.0 in July. Anything above 50 indicates expansion in demand for architects' services.
Note: This includes commercial and industrial facilities like hotels and office buildings, multi-family residential, as well as schools, hospitals and other institutions.
This index has been positive for 19 consecutive months. This index usually leads CRE investment by 9 to 12 months, so this index suggests a pickup in CRE investment into 2023.
MBA: Mortgage Applications Increase in Latest Weekly Survey
by Calculated Risk on 9/21/2022 07:00:00 AM
From the MBA: Mortgage Applications Increase in Latest MBA Weekly Survey
Mortgage applications increased 3.8 percent from one week earlier, according to data from the Mortgage Bankers Association’s (MBA) Weekly Mortgage Applications Survey for the week ending September 16, 2022. Last week’s results include an adjustment for the Labor Day holiday.
... The Refinance Index increased 10 percent from the previous week and was 83 percent lower than the same week one year ago. The seasonally adjusted Purchase Index increased 1 percent from one week earlier. The unadjusted Purchase Index increased 11 percent compared with the previous week and was 30 percent lower than the same week one year ago.
“Treasury yields continued to climb higher last week in anticipation of the Federal Reserve’s September meeting, where it is expected that they will announce – in their efforts to slow inflation – another sizable short-term rate hike. Mortgage rates followed suit last week, increasing across the board, with the 30-year fixed rate jumping 24 basis points to 6.25 percent – the highest since October 2008,” said Joel Kan, MBA’s Associate Vice President of Economic and Industry Forecasting. “As with the swings in rates and other uncertainties around the housing market and broader economy, mortgage applications increased for the first time in six weeks but remained well below last year’s levels, with purchase applications 30 percent lower and refinance activity down 83 percent. The weekly gain in applications, despite higher rates, underscores the overall volatility right now as well as Labor Day-adjusted results the prior week.”
...
The average contract interest rate for 30-year fixed-rate mortgages with conforming loan balances ($647,200 or less) increased to 6.25 percent from 6.01 percent, with points decreasing to 0.71 from 0.76 (including the origination fee) for 80 percent loan-to-value ratio (LTV) loans.
emphasis added
 Click on graph for larger image.
The first graph shows the refinance index since 1990.
Note: Red is a four-week average (blue is weekly).
Tuesday, September 20, 2022
Wednesday: Existing Home Sales, FOMC Statement
by Calculated Risk on 9/20/2022 09:00:00 PM

• At 7:00 AM ET, The Mortgage Bankers Association (MBA) will release the results for the mortgage purchase applications index.
• At 10:00 AM, Existing Home Sales for August from the National Association of Realtors (NAR). The consensus is for 4.70 million SAAR, down from 4.81 million in July.
• At 2:00 PM, FOMC Meeting Announcement. The FOMC is expected to raise the Fed Funds rate by 75bp at this meeting.
• At 2:00 PM, FOMC Forecasts This will include the Federal Open Market Committee (FOMC) participants' projections of the appropriate target federal funds rate along with the quarterly economic projections.
• At 2:30 PM, Fed Chair Jerome Powell holds a press briefing following the FOMC announcement.
On COVID (focus on hospitalizations and deaths):
| COVID Metrics | ||||
|---|---|---|---|---|
| Now | Week Ago | Goal | ||
| New Cases per Day2 | 54,152 | 69,550 | ≤5,0001 | |
| Hospitalized2 | 25,644 | 28,773 | ≤3,0001 | |
| Deaths per Day2 | 355 | 374 | ≤501 | |
| 1my goals to stop daily posts, 27-day average for Cases, Currently Hospitalized, and Deaths 🚩 Increasing 7-day average week-over-week for Cases, Hospitalized, and Deaths ✅ Goal met. | ||||
 Click on graph for larger image.
This graph shows the daily (columns) and 7-day average (line) of deaths reported.
3rd Look at Local Housing Markets in August
by Calculated Risk on 9/20/2022 01:30:00 PM
Today, in the Calculated Risk Real Estate Newsletter: 3rd Look at Local Housing Markets in August
A brief excerpt:
The big story for August existing home sales is the sharp year-over-year (YoY) decline in sales. Another key story is that new listings are down YoY in August as the sellers’ strike continues. Of course, active listings are up sharply YoY, but inventory growth has stalled. The increase in inventory so far has been due to softer demand, likely because of higher mortgage rates.There is much more in the article. You can subscribe at https://calculatedrisk.substack.com/
...
Here is a table comparing the year-over-year Not Seasonally Adjusted (NSA) declines in sales this year from the National Association of Realtors® (NAR) with the local markets I track. So far, these measures have tracked closely, and the preliminary data below suggests a sharp decline in sales in August.
Note that in August 2022, there was one more selling day than in August 2021, so the SA decline in August sales will be larger than the NSA decline. The opposite was true in July (one more selling day in July 2021 than in July 2022). So, seasonally adjusted, this is probably close to the same YoY decline as in July.
...
More local markets to come!
August Housing Starts: Record Number of Housing Units Under Construction
by Calculated Risk on 9/20/2022 09:14:00 AM
Today, in the CalculatedRisk Real Estate Newsletter: August Housing Starts: Record Number of Housing Units Under Construction
Excerpt:
The fourth graph shows housing starts under construction, Seasonally Adjusted (SA).There is much more in the post. You can subscribe at https://calculatedrisk.substack.com/ (Most content is available for free, so please subscribe).
Red is single family units. Currently there are 812 thousand single family units under construction (SA). This is below the previous four months, and 16 thousand below the peak in April and May. Single family units under construction have peaked since single family starts are now declining. The reason there are so many homes under construction is probably due to supply constraints.
Blue is for 2+ units. Currently there are 890 thousand multi-family units under construction. This is the highest level since February 1974! For multi-family, construction delays are probably also a factor. The completion of these units should help with rent pressure.
Combined, there are 1.702 million units under construction. This is the all-time record number of units under construction.
Housing Starts Increased to 1.575 million Annual Rate in August
by Calculated Risk on 9/20/2022 08:37:00 AM
From the Census Bureau: Permits, Starts and Completions
Housing Starts:
Privately‐owned housing starts in August were at a seasonally adjusted annual rate of 1,575,000. This is 12.2 percent above the revised July estimate of 1,404,000, but is 0.1 percent below the August 2021 rate of 1,576,000. Single‐family housing starts in August were at a rate of 935,000; this is 3.4 percent above the revised July figure of 904,000. The August rate for units in buildings with five units or more was 621,000.
Building Permits:
Privately‐owned housing units authorized by building permits in August were at a seasonally adjusted annual rate of 1,517,000. This is 10.0 percent below the revised July rate of 1,685,000 and is 14.4 percent below the August 2021 rate of 1,772,000. Single‐family authorizations in August were at a rate of 899,000; this is 3.5 percent below the revised July figure of 932,000. Authorizations of units in buildings with five units or more were at a rate of 571,000 in August.
emphasis added
 Click on graph for larger image.
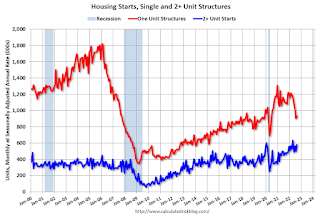
The first graph shows single and multi-family housing starts for the last several years.
Multi-family starts (blue, 2+ units) increased in August compared to July. Multi-family starts were up 33.1% year-over-year in August.
Single-family starts (red) increased in August and were down 14.6% year-over-year.
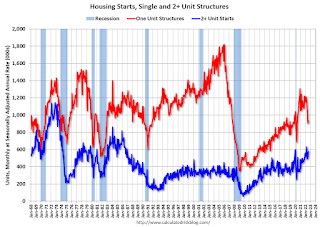
 The second graph shows single and multi-family housing starts since 1968.
 This shows the huge collapse following the housing bubble, and then the eventual recovery.
Total housing starts in August were above expectations, however, starts in June and July were revised down, combined.
I'll have more later …
Monday, September 19, 2022
Bloomberg: Home-Flipper Opendoor Hit With Losses in Echo of Zillow Collapse
by Calculated Risk on 9/19/2022 10:55:00 AM
From Bloomberg: Home-Flipper Opendoor Hit With Losses in Echo of Zillow Collapse excerpt:
The company, which sells thousands of homes in a typical month, lost money on 42% of its transactions in August, according to research from YipitData. Opendoor’s performance — as measured by the prices at which it bought and sold properties — was even worse in key markets such as Los Angeles, where the company lost money on 55% of sales, and Phoenix, where the share was 76%.
A representative for Opendoor declined to comment on the figures, which don’t include fees charged to customers or expenses incurred in renovating and marketing homes. Opendoor’s rocky summer is reminiscent of the pricing problems that doomed Zillow Group Inc.’s iBuying business last year, according to a research note from Mike DelPrete, a scholar-in-residence at the University of Colorado Boulder. That doesn’t mean Opendoor is going to shut down the business, but it demonstrates the depth of the losses — and September is likely to be even worse than August, DelPrete’s analysis shows. “Opendoor’s metrics are in the danger zone,” DelPrete said in an interview. “They are very close to where Zillow was in its worst moments.”
NAHB: Builder Confidence Declined in September
by Calculated Risk on 9/19/2022 10:11:00 AM
The National Association of Home Builders (NAHB) reported the housing market index (HMI) was at 46, down from 49 in August. Any number below 50 indicates that more builders view sales conditions as poor than good.
From the NAHB: Builder Confidence Falls for Ninth Straight Month as Housing Slowdown Continues
In another sign that the slowdown in the housing market continues, builder sentiment fell for the ninth straight month in September as the combination of elevated interest rates, persistent building material supply chain disruptions and high home prices continue to take a toll on affordability.This was below the consensus forecast, and below 50.
Builder confidence in the market for newly built single-family homes fell three points in September to 46, the lowest level since May 2014 with the exception of the spring of 2020, according to the National Association of Home Builders (NAHB)/Wells Fargo Housing Market Index (HMI) released today.
“Buyer traffic is weak in many markets as more consumers remain on the sidelines due to high mortgage rates and home prices that are putting a new home purchase out of financial reach for many households,” said NAHB Chairman Jerry Konter, a home builder and developer from Savannah, Ga. “In another indicator of a weakening market, 24% of builders reported reducing home prices, up from 19% last month.”
“Builder sentiment has declined every month in 2022, and the housing recession shows no signs of abating as builders continue to grapple with elevated construction costs and an aggressive monetary policy from the Federal Reserve that helped pushed mortgage rates above 6% last week, the highest level since 2008,” said NAHB Chief Economist Robert Dietz. “In this soft market, more than half of the builders in our survey reported using incentives to bolster sales, including mortgage rate buydowns, free amenities and price reductions.” …
All three HMI components posted declines in September. Current sales conditions dropped three points to 54, sales expectations in the next six months declined one point to 46 and traffic of prospective buyers fell one point to 31.
Looking at the three-month moving averages for regional HMI scores, the Northeast fell five points to 51, the Midwest dropped five points to 44, the South fell seven points to 56 and the West posted a 10-point decline to 41.
emphasis added


