 RSS Feed
 by Calculated Risk on 9/22/2022 09:32:00 AM
Thursday, September 22, 2022
Final Look at Local Housing Markets in August
Today, in the Calculated Risk Real Estate Newsletter: Final Look at Local Housing Markets in August
A brief excerpt:
The big story for August existing home sales was the sharp year-over-year (YoY) decline in sales. Another key story was that new listings were down YoY in August as the sellers’ strike continued. And active listings were up. Also, median prices are falling nationally (more than normal seasonally).There is much more in the article. You can subscribe at https://calculatedrisk.substack.com/
This is the final look at local markets in August. I’m tracking about 35 local housing markets in the US. Some of the 35 markets are states, and some are metropolitan areas. I update these tables throughout the month as additional data is released.
...
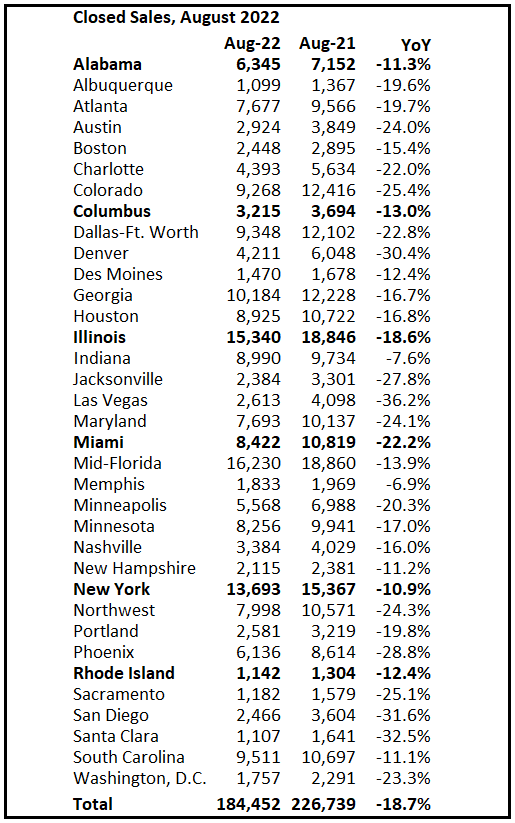
And a table of August sales. In August, sales in these markets were down 18.7% YoY. The NAR reported sales were down 17.4% NSA YoY. Contracts for sales in August were mostly signed in June and July, and we are seeing the impact of higher mortgage rates on August closings.
...
Looking ahead: In September 2022, there were the same number of working days as in September 2021, so the SA and NSA declines in sales will be similar.
Weekly Initial Unemployment Claims at 213,000
by Calculated Risk on 9/22/2022 08:32:00 AM
The DOL reported:
In the week ending September 17, the advance figure for seasonally adjusted initial claims was 213,000, an increase of 5,000 from the previous week's revised level. The previous week's level was revised down by 5,000 from 213,000 to 208,000. The 4-week moving average was 216,750, a decrease of 6,000 from the previous week's revised average. The previous week's average was revised down by 1,250 from 224,000 to 222,750.The following graph shows the 4-week moving average of weekly claims since 1971.
emphasis added
 Click on graph for larger image.
The dashed line on the graph is the current 4-week average. The four-week average of weekly unemployment claims decreased to 216,750.
The previous week was revised down.
Weekly claims were close to the consensus forecast.
Wednesday, September 21, 2022
Thursday: Unemployment Claims
by Calculated Risk on 9/21/2022 08:44:00 PM
 Thursday:
• At 8:30 AM ET, The initial weekly unemployment claims report will be released. The consensus is for an increase to 218 thousand from 213 thousand last week.
• At 11:00 AM, the Kansas City Fed manufacturing survey for September.
On COVID (focus on hospitalizations and deaths):
| COVID Metrics | ||||
|---|---|---|---|---|
| Now | Week Ago | Goal | ||
| New Cases per Day2 | 55,332 | 60,783 | ≤5,0001 | |
| Hospitalized2 | 25,406 | 28,571 | ≤3,0001 | |
| Deaths per Day2 | 356 | 381 | ≤501 | |
| 1my goals to stop daily posts, 27-day average for Cases, Currently Hospitalized, and Deaths 🚩 Increasing 7-day average week-over-week for Cases, Hospitalized, and Deaths ✅ Goal met. | ||||
 Click on graph for larger image.
This graph shows the daily (columns) and 7-day average (line) of deaths reported.
NOTE: Cases have declined by more than half, and deaths lag cases - so we might see average daily deaths in the 200s soon (good news, but still too high).
Average daily deaths bottomed in July 2021 at 214 per day.
FOMC Projections and Press Conference
by Calculated Risk on 9/21/2022 02:18:00 PM
Statement here.
Fed Chair Powell press conference video here or on YouTube here, starting at 2:30 PM ET.
Here are the projections. In June, most participants expected thirteen 25bp rate hikes in 2022. The FOMC raised rates 25 bp in March, 50 bp in May, 75 bp in June, 75 bp in July and 75 bp in September. That is twelve 25 bp increases so far, and the Fed expects rates to rise another 150 bp. So, it now appears the FOMC is expecting eighteen 25bp rate hikes this year.
Wall Street forecasts have been revised down further since June due to the ongoing negative impacts from the pandemic, the war in Ukraine and financial tightening. The FOMC also lowered their 2022 and 2023 projections down significantly.
| GDP projections of Federal Reserve Governors and Reserve Bank presidents, Change in Real GDP1 | ||||
|---|---|---|---|---|
| Projection Date | 2022 | 2023 | 2024 | |
| Sept 2022 | 0.1 to 0.3 | 0.5 to 1.5 | 1.4 to 2.0 | |
| June 2022 | 1.5 to 1.9 | 1.3 to 2.0 | 1.5 to 2.0 | |
The unemployment rate was at 3.7% in August. The FOMC increased their projections for the unemployment rate for Q4 2022. And are now projecting an employment recession in 2023.
| Unemployment projections of Federal Reserve Governors and Reserve Bank presidents, Unemployment Rate2 | ||||
|---|---|---|---|---|
| Projection Date | 2022 | 2023 | 2024 | |
| Sept 2022 | 3.8 to 3.9 | 4.1 to 4.5 | 4.0 to 4.6 | |
| June 2022 | 3.6 to 3.8 | 3.8 to 4.1 | 3.9 to 4.1 | |
As of July 2022, PCE inflation was up 6.3% from July 2021. The FOMC revised up their inflation projections for 2022.
| Inflation projections of Federal Reserve Governors and Reserve Bank presidents, PCE Inflation1 | ||||
|---|---|---|---|---|
| Projection Date | 2022 | 2023 | 2024 | |
| Sept 2022 | 5.3 to 5.7 | 2.6 to 3.5 | 2.1 to 2.6 | |
| June 2022 | 5.0 to 5.3 | 2.4 to 3.0 | 2.0 to 2.5 | |
PCE core inflation was up 4.6% in July year-over-year. And the FOMC revised up their projections.
| Core Inflation projections of Federal Reserve Governors and Reserve Bank presidents, Core Inflation1 | ||||
|---|---|---|---|---|
| Projection Date | 2022 | 2023 | 2024 | |
| Sept 2022 | 4.4 to 4.6 | 3.0 to 3.4 | 2.2 to 2.5 | |
| June 2022 | 4.2 to 4.5 | 2.5 to 3.2 | 2.1 to 2.5 | |
FOMC Statement: Raise Rates 75 bp; "Ongoing increases appropriate"
by Calculated Risk on 9/21/2022 02:02:00 PM
Fed Chair Powell press conference video here or on YouTube here, starting at 2:30 PM ET.
FOMC Statement:
Recent indicators point to modest growth in spending and production. Job gains have been robust in recent months, and the unemployment rate has remained low. Inflation remains elevated, reflecting supply and demand imbalances related to the pandemic, higher food and energy prices, and broader price pressures.
Russia's war against Ukraine is causing tremendous human and economic hardship. The war and related events are creating additional upward pressure on inflation and are weighing on global economic activity. The Committee is highly attentive to inflation risks.
The Committee seeks to achieve maximum employment and inflation at the rate of 2 percent over the longer run. In support of these goals, the Committee decided to raise the target range for the federal funds rate to 3 to 3-1/4 percent and anticipates that ongoing increases in the target range will be appropriate. In addition, the Committee will continue reducing its holdings of Treasury securities and agency debt and agency mortgage-backed securities, as described in the Plans for Reducing the Size of the Federal Reserve's Balance Sheet that were issued in May. The Committee is strongly committed to returning inflation to its 2 percent objective.
In assessing the appropriate stance of monetary policy, the Committee will continue to monitor the implications of incoming information for the economic outlook. The Committee would be prepared to adjust the stance of monetary policy as appropriate if risks emerge that could impede the attainment of the Committee's goals. The Committee's assessments will take into account a wide range of information, including readings on public health, labor market conditions, inflation pressures and inflation expectations, and financial and international developments.
Voting for the monetary policy action were Jerome H. Powell, Chair; John C. Williams, Vice Chair; Michael S. Barr; Michelle W. Bowman; Lael Brainard; James Bullard; Susan M. Collins; Lisa D. Cook; Esther L. George; Philip N. Jefferson; Loretta J. Mester; and Christopher J. Waller.
emphasis added
More Analysis on August Existing Home Sales
by Calculated Risk on 9/21/2022 10:51:00 AM
Today, in the CalculatedRisk Real Estate Newsletter: NAR: Existing-Home Sales Decreased Slightly to 4.80 million SAAR in August
Excerpt:
On prices, the NAR reported:There is much more in the article. You can subscribe at https://calculatedrisk.substack.com/ (Most content is available for free, so please subscribe).The median existing-home price for all housing types in August was $389,500, a 7.7% jump from August 2021 ($361,500), as prices ascended in all regions. This marks 126 consecutive months of year-over-year increases, the longest-running streak on record. However, it was the second month in a row that the median sales price retracted after reaching a record high of $413,800 in June, the usual seasonal trend of prices declining after peaking in the early summer.Median prices are distorted by the mix (repeat sales indexes like Case-Shiller and FHFA are probably better for measuring prices).
The YoY change in the median price peaked at 25.2% in May 2021 and has now slowed to 7.7%. The YoY increase in August was smaller than in July (9.5%) and suggests the Case-Shiller index will slow sharply soon. Note that the median price usually starts falling seasonally in July, so the 2.4% decline from July to August in the median price was partially seasonal (but the decline over the last two months has been much larger than the usual decline).

NAR: Existing-Home Sales Decreased to 4.80 million SAAR in August
by Calculated Risk on 9/21/2022 10:13:00 AM
From the NAR: Existing-Home Sales Slipped 0.4% in August
Existing-home sales experienced a slight dip in August, marking the seventh consecutive month of declines, according to the National Association of REALTORS®. Month-over-month sales varied across the four major U.S. regions as two regions recorded increases, one was unchanged and the other posted a drop. On a year-over-year basis, however, sales fell in all regions.
Total existing-home sales, completed transactions that include single-family homes, townhomes, condominiums and co-ops, notched a minor contraction of 0.4% from July to a seasonally adjusted annual rate of 4.80 million in August. Year-over-year, sales faded by 19.9% (5.99 million in August 2021).
...
Total housing inventory registered at the end of August was 1,280,000 units, a decrease of 1.5% from July and unchanged from the previous year. Unsold inventory sits at a 3.2-month supply at the current sales pace – identical to July and up from 2.6 months in August 2021.
emphasis added
 Click on graph for larger image.
This graph shows existing home sales, on a Seasonally Adjusted Annual Rate (SAAR) basis since 1993.
Sales in August (4.80 million SAAR) were down 0.4% from the previous month and were 19.9% below the August 2021 sales rate.
The second graph shows nationwide inventory for existing homes.
 According to the NAR, inventory decreased to 1.28 million in August from 1.30 million in July.
Headline inventory is not seasonally adjusted, and inventory usually decreases to the seasonal lows in December and January, and peaks in mid-to-late summer.
The last graph shows the year-over-year (YoY) change in reported existing home inventory and months-of-supply. Since inventory is not seasonally adjusted, it really helps to look at the YoY change. Note: Months-of-supply is based on the seasonally adjusted sales and not seasonally adjusted inventory.
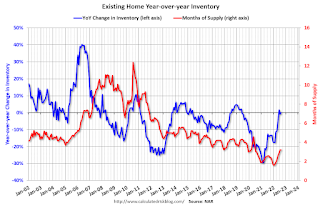 Inventory was unchanged year-over-year (blue) in August compared to August 2021.
Months of supply (red) was unchanged at 3.2 months in August from 3.2 months in July.
This was above the consensus forecast. I'll have more later.
The last graph shows the year-over-year (YoY) change in reported existing home inventory and months-of-supply. Since inventory is not seasonally adjusted, it really helps to look at the YoY change. Note: Months-of-supply is based on the seasonally adjusted sales and not seasonally adjusted inventory.
 Inventory was unchanged year-over-year (blue) in August compared to August 2021.
 Months of supply (red) was unchanged at 3.2 months in August from 3.2 months in July.
This was above the consensus forecast. I'll have more later.
AIA: Architecture Billings Index shows "Demand for design services accelerates" in August
by Calculated Risk on 9/21/2022 08:59:00 AM
Note: This index is a leading indicator primarily for new Commercial Real Estate (CRE) investment.
From the AIA: Demand for design services accelerates
Demand for design services from U.S. architecture firms grew at an accelerated pace in August, according to a new report today from The American Institute of Architects (AIA).
AIA’s Architecture Billings Index (ABI) score for August rose to 53.3 compared to 51.0 in July (any score above 50 indicates an increase in billings). During August, the score for new project inquiries rose to 57.9 from 56.1 the previous month, while the design contracts score softened slightly with a score of 52.3, down from 52.9 in July.
“While a strengthening billings score is encouraging, the flat scoring across regions and sectors is indicative of a nationwide deceleration over the next several months, said AIA Chief Economist, Kermit Baker, Hon. AIA, PhD. “A variety of economic storm clouds continue to gather, but since design activity continues to increase, we can expect at least another 9–12-month runway before building construction activity is negatively affected.”
...
• Regional averages: South (52.9); Midwest (51.4); West (50.2); Northeast (49.8)
• Sector index breakdown: multi-family residential (52.0); institutional (52.0); commercial/industrial (51.2); mixed practice (51.2)
emphasis added
 Click on graph for larger image.
This graph shows the Architecture Billings Index since 1996. The index was at 53.3 in August, up from 51.0 in July. Anything above 50 indicates expansion in demand for architects' services.
Note: This includes commercial and industrial facilities like hotels and office buildings, multi-family residential, as well as schools, hospitals and other institutions.
This index has been positive for 19 consecutive months. This index usually leads CRE investment by 9 to 12 months, so this index suggests a pickup in CRE investment into 2023.
MBA: Mortgage Applications Increase in Latest Weekly Survey
by Calculated Risk on 9/21/2022 07:00:00 AM
From the MBA: Mortgage Applications Increase in Latest MBA Weekly Survey
Mortgage applications increased 3.8 percent from one week earlier, according to data from the Mortgage Bankers Association’s (MBA) Weekly Mortgage Applications Survey for the week ending September 16, 2022. Last week’s results include an adjustment for the Labor Day holiday.
... The Refinance Index increased 10 percent from the previous week and was 83 percent lower than the same week one year ago. The seasonally adjusted Purchase Index increased 1 percent from one week earlier. The unadjusted Purchase Index increased 11 percent compared with the previous week and was 30 percent lower than the same week one year ago.
“Treasury yields continued to climb higher last week in anticipation of the Federal Reserve’s September meeting, where it is expected that they will announce – in their efforts to slow inflation – another sizable short-term rate hike. Mortgage rates followed suit last week, increasing across the board, with the 30-year fixed rate jumping 24 basis points to 6.25 percent – the highest since October 2008,” said Joel Kan, MBA’s Associate Vice President of Economic and Industry Forecasting. “As with the swings in rates and other uncertainties around the housing market and broader economy, mortgage applications increased for the first time in six weeks but remained well below last year’s levels, with purchase applications 30 percent lower and refinance activity down 83 percent. The weekly gain in applications, despite higher rates, underscores the overall volatility right now as well as Labor Day-adjusted results the prior week.”
...
The average contract interest rate for 30-year fixed-rate mortgages with conforming loan balances ($647,200 or less) increased to 6.25 percent from 6.01 percent, with points decreasing to 0.71 from 0.76 (including the origination fee) for 80 percent loan-to-value ratio (LTV) loans.
emphasis added
 Click on graph for larger image.
The first graph shows the refinance index since 1990.
With higher mortgage rates, the refinance index has declined sharply this year.
The refinance index is just above the lowest level since the year 2000.
The second graph shows the MBA mortgage purchase index
 According to the MBA, purchase activity is down 30% year-over-year unadjusted.
The purchase index is only 10% above the pandemic low.
Note: Red is a four-week average (blue is weekly).
Note: Red is a four-week average (blue is weekly).
Tuesday, September 20, 2022
Wednesday: Existing Home Sales, FOMC Statement
by Calculated Risk on 9/20/2022 09:00:00 PM
 Wednesday:
• At 7:00 AM ET, The Mortgage Bankers Association (MBA) will release the results for the mortgage purchase applications index.
• At 10:00 AM, Existing Home Sales for August from the National Association of Realtors (NAR). The consensus is for 4.70 million SAAR, down from 4.81 million in July.
• At 2:00 PM, FOMC Meeting Announcement. The FOMC is expected to raise the Fed Funds rate by 75bp at this meeting.
• At 2:00 PM, FOMC Forecasts This will include the Federal Open Market Committee (FOMC) participants' projections of the appropriate target federal funds rate along with the quarterly economic projections.
• At 2:30 PM, Fed Chair Jerome Powell holds a press briefing following the FOMC announcement.
On COVID (focus on hospitalizations and deaths):
| COVID Metrics | ||||
|---|---|---|---|---|
| Now | Week Ago | Goal | ||
| New Cases per Day2 | 54,152 | 69,550 | ≤5,0001 | |
| Hospitalized2 | 25,644 | 28,773 | ≤3,0001 | |
| Deaths per Day2 | 355 | 374 | ≤501 | |
| 1my goals to stop daily posts, 27-day average for Cases, Currently Hospitalized, and Deaths 🚩 Increasing 7-day average week-over-week for Cases, Hospitalized, and Deaths ✅ Goal met. | ||||
 Click on graph for larger image.
This graph shows the daily (columns) and 7-day average (line) of deaths reported.
Average daily deaths bottomed in July 2021 at 214 per day.


