 RSS Feed
 by Calculated Risk on 10/05/2022 10:04:00 AM
Wednesday, October 05, 2022
ISM® Services Index Decreased to 56.7% in September
(Posted with permission). The ISM® Services index was at 56.7%, down from 56.9% last month. The employment index increased to 53.0%, from 50.2%. Note: Above 50 indicates expansion, below 50 in contraction.
From the Institute for Supply Management: Services PMI® at 56.7% September 2022 Services ISM® Report On Business®
Economic activity in the services sector grew in September for the 28th month in a row — with the Services PMI® registering 56.7 percent — say the nation’s purchasing and supply executives in the latest Services ISM® Report On Business®.This was above expectations.
The report was issued today by Anthony Nieves, CPSM, C.P.M., A.P.P., CFPM, Chair of the Institute for Supply Management® (ISM®) Services Business Survey Committee: “In September, the Services PMI® registered 56.7 percent, 0.2 percentage point lower than August’s reading of 56.9 percent. The Business Activity Index registered 59.1 percent, a decrease of 1.8 percentage points compared to the reading of 60.9 percent in August. The New Orders Index figure of 60.6 percent is 1.2 percentage points lower than the August reading of 61.8 percent.
emphasis added
Trade Deficit decreased to $67.4 Billion in August
by Calculated Risk on 10/05/2022 08:38:00 AM
From the Department of Commerce reported:
The U.S. Census Bureau and the U.S. Bureau of Economic Analysis announced today that the goods and services deficit was $67.4 billion in August, down $3.1 billion from $70.5 billion in July, revised.
August exports were $258.9 billion, $0.7 billion less than July exports. August imports were $326.3 billion, $3.7 billion less than July imports.
emphasis added
 Click on graph for larger image.
Exports increased and imports decreased in August.
Exports are up 20% year-over-year; imports are up 14% year-over-year.
Both imports and exports decreased sharply due to COVID-19 and have now bounced back.
The second graph shows the U.S. trade deficit, with and without petroleum.
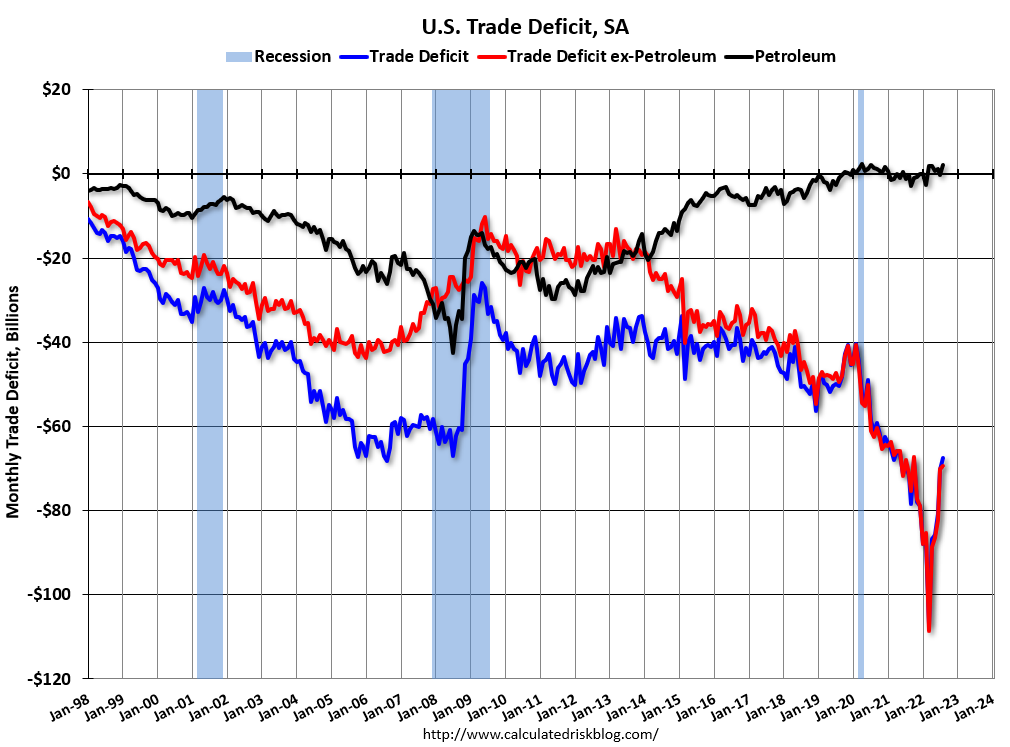 The blue line is the total deficit, and the black line is the petroleum deficit, and the red line is the trade deficit ex-petroleum products.
Note that net, imports and exports of petroleum products are close to zero.
The trade deficit with China increased to $37.4 billion in August, from $21.7 billion a year ago.
The trade deficit was slightly lower than the consensus forecast.
ADP: Private Employment Increased 208,000 in September
by Calculated Risk on 10/05/2022 08:20:00 AM
Note: This is the second release of a new methodology. Historical data based on the new methodology is available.
From ADP: ADP National Employment Report: Private Sector Employment Increased by
208,000 Jobs in September; Annual Pay was Up 7.8%
Private sector employment increased by 208,000 jobs in September and annual pay was up 7.8% year-over-year, according to the September ADP® National Employment ReportTM produced by the ADP Research Institute® in collaboration with the Stanford Digital Economy Lab (“Stanford Lab”).This was close to the consensus forecast of 205,000. The BLS report will be released Friday, and the consensus is for 250 thousand non-farm payroll jobs added in September.
The jobs report and pay insights use ADP’s fine-grained anonymized and aggregated payroll data of over 25 million U.S. employees to provide a representative picture of the labor market. The report details the current month’s total private employment change, and weekly job data from the previous month. ADP’s pay measure uniquely captures the earnings of a cohort of almost 10 million employees over a 12-month period.
“We are continuing to see steady job gains,” said Nela Richardson, chief economist, ADP. “While job stayers saw a pay increase, annual pay growth for job changers in September is down from August.”
emphasis added
MBA: Mortgage Applications Decrease in Latest Weekly Survey; Purchase Activity Below Pandemic Low
by Calculated Risk on 10/05/2022 07:00:00 AM
From the MBA: Mortgage Applications Decrease in Latest MBA Weekly Survey
Mortgage applications decreased 14.2 percent from one week earlier, according to data from the Mortgage Bankers Association’s (MBA) Weekly Mortgage Applications Survey for the week ending September 30, 2022.
... The Refinance Index decreased 18 percent from the previous week and was 86 percent lower than the same week one year ago. The seasonally adjusted Purchase Index decreased 13 percent from one week earlier. The unadjusted Purchase Index decreased 13 percent compared with the previous week and was 37 percent lower than the same week one year ago.
“Mortgage rates continued to climb last week, causing another pullback in overall application activity, which dropped to its slowest pace since 1997. The 30-year fixed rate hit 6.75 percent last week – the highest rate since 2006,” said Joel Kan, MBA’s Associate Vice President of Economic and Industry Forecasting. “The current rate has more than doubled over the past year and has increased 130 basis points in the past seven weeks alone. The steep increase in rates continued to halt refinance activity and is also impacting purchase applications, which have fallen 37 percent behind last year’s pace. Additionally, the spreads between the conforming rate compared to jumbo loans widened again, and we saw the ARM share rise further to almost 12 percent of applications.”
Added Kan, “There was also an impact from Hurricane Ian’s arrival in Florida last week, which prompted widespread closings and evacuations. Applications in Florida fell 31 percent, compared to 14 percent overall, on a non-seasonally adjusted basis.”
...
The average contract interest rate for 30-year fixed-rate mortgages with conforming loan balances ($647,200 or less) increased to 6.75 percent from 6.52 percent, with points decreasing to 0.95 from 1.15 (including the origination fee) for 80 percent loan-to-value ratio (LTV) loans.
emphasis added
 Click on graph for larger image.
The first graph shows the refinance index since 1990.
With higher mortgage rates, the refinance index has declined sharply this year.
The refinance index is at the lowest level since the year 2000.
The second graph shows the MBA mortgage purchase index
 According to the MBA, purchase activity is down 37% year-over-year unadjusted.
The purchase index is 5% below the pandemic low and at the lowest level since 2015.
Note: Red is a four-week average (blue is weekly).
Note: Red is a four-week average (blue is weekly).
Tuesday, October 04, 2022
Wednesday: ADP Employment, Trade Deficit, ISM Services
by Calculated Risk on 10/04/2022 08:59:00 PM
 Wednesday:
• At 7:00 AM ET: The Mortgage Bankers Association (MBA) will release the results for the mortgage purchase applications index.
• At 8:15 AM: The ADP Employment Report for September. This report is for private payrolls only (no government). The consensus is for 205,000 jobs added, up from 132,000 in August.
• At 8:30 AM: Trade Balance report for August from the Census Bureau. The consensus is for the deficit to be $68.0 billion in August, from $70.7 billion in July.
• At 10:00 AM: the ISM Services Index for September.
Heavy Truck Sales Up 20% Year-over-year
by Calculated Risk on 10/04/2022 03:37:00 PM
The BEA released their estimate of vehicle sales for September this morning.
This graph shows heavy truck sales since 1967 using data from the BEA. The dashed line is the September 2022 seasonally adjusted annual sales rate (SAAR).
Heavy truck sales really collapsed during the great recession, falling to a low of 180 thousand SAAR in May 2009. Then heavy truck sales increased to a new all-time high of 570 thousand SAAR in April 2019.
 Click on graph for larger image.
Note: "Heavy trucks - trucks more than 14,000 pounds gross vehicle weight."
Heavy truck sales declined sharply at the beginning of the pandemic, falling to a low of 308 thousand SAAR in May 2020.
Heavy truck sales were at 504 thousand SAAR in September, unchanged from 504 thousand in August, and up from 420 thousand SAAR in September 2021.
Usually, heavy truck sales decline sharply prior to a recession. Sales were solid in September.
House Prices: 7 Years in Purgatory
by Calculated Risk on 10/04/2022 01:08:00 PM
Today, in the Calculated Risk Real Estate Newsletter: House Prices: 7 Years in Purgatory
A brief excerpt:
However, even in normal times, house prices are not sticky downwards in real terms as this graph shows.There is much more in the article. You can subscribe at https://calculatedrisk.substack.com/
In the July Case-Shiller report, real prices were only up 5.4% year-over-year (YoY) and will likely be down YoY in real terms later this year.
However, we are already seeing nominal house price declines on a national basis. The Black Knight index (median price of a repeat sales index) was off almost 2% in August, and the CoreLogic repeat sales index for August (a three-month weighted average and not seasonally adjusted, NSA) was off close to 1% in August. And my estimate is the nominal Case-Shiller national index will be off almost 1% in August compared to the peak in June.

BLS: Job Openings Decreased to 10.1 million in August
by Calculated Risk on 10/04/2022 10:06:00 AM
From the BLS: Job Openings and Labor Turnover Summary
The number of job openings decreased to 10.1 million on the last business day of August, the U.S. Bureau of Labor Statistics reported today. Hires and total separations were little changed at 6.3 million and 6.0 million, respectively. Within separations, quits (4.2 million) and layoffs and discharges (1.5 million) were little changed.The following graph shows job openings (black line), hires (dark blue), Layoff, Discharges and other (red column), and Quits (light blue column) from the JOLTS.
emphasis added
This series started in December 2000.
Note: The difference between JOLTS hires and separations is similar to the CES (payroll survey) net jobs headline numbers. This report is for August the employment report this Friday will be for September.
 Click on graph for larger image.
Note that hires (dark blue) and total separations (red and light blue columns stacked) are usually pretty close each month. This is a measure of labor market turnover. When the blue line is above the two stacked columns, the economy is adding net jobs - when it is below the columns, the economy is losing jobs.
The spike in layoffs and discharges in March 2020 is labeled, but off the chart to better show the usual data.
Jobs openings decreased in August to 10.053 million from 11.170 million in July.
The number of job openings (black) were down 5% year-over-year.
Quits were up slightly year-over-year. These are voluntary separations. (See light blue columns at bottom of graph for trend for "quits").
CoreLogic: House Prices up 13.5% YoY in August; Declined 0.7% MoM in August
by Calculated Risk on 10/04/2022 08:00:00 AM
Notes: This CoreLogic House Price Index report is for August. The recent Case-Shiller index release was for July. The CoreLogic HPI is a three-month weighted average and is not seasonally adjusted (NSA).
From CoreLogic: Annual US Home Price Gains Lose Steam Again in August, CoreLogic Reports
CoreLogic® ... today released the CoreLogic Home Price Index (HPI™) and HPI Forecast™ for August 2022.
Although U.S. home prices continued their 127-month run of consecutive annual gains in August, they slowed for the fourth straight month to 13.5%. That’s the lowest year-over-year appreciation recorded since April 2021 and partially reflects continued cooling buyer demand due to higher mortgage rates and housing trends motivated by the COVID-19 outbreak winding down. The 0.7% month-over-month price decrease also indicates reduced homebuyer enthusiasm, with nearly three-quarters of states posting declines from July.
“The increased cost of homeownership has dampened buyer demand and caused prices to decelerate at a faster pace than initially expected,” said Selma Hepp, interim lead of the Office of the Chief Economist at CoreLogic. “Housing markets on the West Coast and in the Mountain West, as well as second-home markets, recorded particularly strong price growth in the summer of 2021 but were the first to see month-over-month price declines during the same period this year. While decelerating price growth and price declines benefit younger potential homebuyers, mortgage rates that are approaching 7% may cut many hopefuls out of the picture.”
...
U.S. home prices (including distressed sales) increased 13.5% year over year in August 2022 compared to August 2021. On a month-over-month basis, home prices declined by 0.7% compared to July 2022.
emphasis added
Monday, October 03, 2022
Tuesday: Job Openings, CoreLogic House Prices
by Calculated Risk on 10/03/2022 08:28:00 PM
 From Matthew Graham at Mortgage News Daily: Mortgage Rates Continue Recovering
Mortgage rates remain elevated in the context of the past decade and 2022 in general, but they continue making progress after hitting long-term highs early last week. ... The average lender is now getting back into the middle to upper-middle 6% range depending on the scenario and the presence of "points" in the loan quote. [30 year fixed 6.69%]Tuesday:
emphasis added
• At 8:00 AM ET, Corelogic House Price index for August.
• At 10:00 AM, Job Openings and Labor Turnover Survey for August from the BLS.


