 RSS Feed
 by Calculated Risk on 10/09/2022 06:55:00 PM
Sunday, October 09, 2022
Sunday Night Futures
Weekend:
• Schedule for Week of October 9, 2022
Monday:
• Columbus Day Holiday: Banks will be closed in observance of Columbus Day. The stock market will be open. No economic releases are scheduled.
• At 1:35 PM ET, Speech, Fed Vice Chair Lael Brainard, Restoring Price Stability in an Uncertain Economic Environment, At the National Association for Business Economics (NABE) Annual Meeting, Chicago, Ill.
From CNBC: Pre-Market Data and Bloomberg futures S&P 500 are down 26 and DOW futures are down 174 (fair value).
Oil prices were up over the last week with WTI futures at $92.64 per barrel and Brent at $97.92 per barrel. A year ago, WTI was at $80, and Brent was at $82 - so WTI oil prices are up 15% year-over-year.
Here is a graph from Gasbuddy.com for nationwide gasoline prices. Nationally prices are at $3.91 per gallon. A year ago, prices were at $3.25 per gallon, so gasoline prices are up $0.66 per gallon year-over-year. NOTE: Gasoline prices in Los Angeles have spiked to a near record $6.40 per gallon due to refinery issues.
Housing Discussion with Fortune's Lance Lambert
by Calculated Risk on 10/09/2022 11:37:00 AM
On Friday, Fortune’s Lance Lambert and I discussed the US housing market.
Click here for audio
One of the key topics was household formation. Here is an excellent summary article by Katie McKellar at desert.com: The most ‘underreported’ factor influencing housing market, according to Calculated Risk
Bill McBride, author of the economics blog Calculated Risk, said there’s a key reason why both rent and home price growth is slowing amid the U.S. housing correction playing out today.
In a live Twitter Space hosted by Fortune Magazine on Friday, McBride called it the most “underreported” factor.
What is it? Household formation — both because of how much it accelerated amid the COVID-19 pandemic and how it’s slowing down now.
Wholesale Used Car Prices Declined in September; Prices Down Slightly Year-over-year
by Calculated Risk on 10/09/2022 08:11:00 AM
From Manheim Consulting on Friday: Wholesale Used-Vehicle Prices See Large Decline Again in September
Wholesale used-vehicle prices (on a mix, mileage, and seasonally adjusted basis) decreased 3.0% in September from August. The Manheim Used Vehicle Value Index declined to 204.5 and is now down 0.1% from a year ago. The non-adjusted price change in September was a decline of 2.1% compared to August, moving the unadjusted average price down 2.3% year over year.
emphasis added
 Click on graph for larger image.
This index from Manheim Consulting is based on all completed sales transactions at Manheim’s U.S. auctions.
The Manheim index suggests used car prices decreased in September and were down 0.1% year-over-year (YoY).
This also suggests the consumer price index for used cars and trucks will be down again in September.
It is likely this index will be down more than 10% YoY in October.
Saturday, October 08, 2022
Real Estate Newsletter Articles this Week: 7 Years in Purgatory
by Calculated Risk on 10/08/2022 02:11:00 PM
At the Calculated Risk Real Estate Newsletter this week:
• House Prices: 7 Years in Purgatory
• Black Knight Mortgage Monitor: "Home Prices Down Again in August ... Now 2% Off June Peak"
• "For many [home] sellers, it likely feels like the rug has been pulled out from underneath them"
• Apartments: Net Absorption Very Low in Q3, New Construction Deliveries Even Lower
This is usually published 4 to 6 times a week and provides more in-depth analysis of the housing market.
You can subscribe at https://calculatedrisk.substack.com/
Most content is available for free (and no Ads), but please subscribe!
Schedule for Week of October 9, 2022
by Calculated Risk on 10/08/2022 08:11:00 AM
The key economic reports this week are September CPI and Retail Sales.
Columbus Day Holiday: Banks will be closed in observance of Columbus Day. The stock market will be open. No economic releases are scheduled.
1:35 PM: Speech, Fed Vice Chair Lael Brainard, Restoring Price Stability in an Uncertain Economic Environment, At the National Association for Business Economics (NABE) Annual Meeting, Chicago, Ill.
6:00 AM: NFIB Small Business Optimism Index for September.
7:00 AM ET: The Mortgage Bankers Association (MBA) will release the results for the mortgage purchase applications index.
8:30 AM: The Producer Price Index for September from the BLS. The consensus is for a 0.2% increase in PPI, and a 0.3% increase in core PPI.
2:00 PM: FOMC Minutes, Meeting of September 20-21, 2022
8:30 AM: The initial weekly unemployment claims report will be released. The consensus is for an increase to 225 thousand from 219 thousand last week (likely impact from Hurricane Ian).
8:30 AM: The Consumer Price Index for September from the BLS. The consensus is for a 0.2% increase in CPI, and a 0.5% increase in core CPI. The consensus is for CPI to be up 8.1% year-over-year and core CPI to be up 6.5% YoY.
 8:30 AM ET: Retail sales for September will be released. The consensus is for a 0.2% increase in retail sales.
This graph shows retail sales since 1992. This is monthly retail sales and food service, seasonally adjusted (total and ex-gasoline).
10:00 AM: University of Michigan's Consumer sentiment index (Preliminary for October).
Friday, October 07, 2022
COVID Oct 7 2022, Update on Cases, Hospitalizations and Deaths
by Calculated Risk on 10/07/2022 09:45:00 PM
 NOTE: Starting this week, COVID stats will only be updated on Fridays.
On COVID (focus on hospitalizations and deaths):
NOTE: Cases have declined by two-thirds from the recent peak, and deaths lag cases - so we might see average daily deaths in the 200s soon (good news, but still too high).
Average daily deaths bottomed in July 2021 at 214 per day.
| COVID Metrics | ||||
|---|---|---|---|---|
| Now | Week Ago | Goal | ||
| New Cases per Day2 | 41,855 | 46,767 | ≤5,0001 | |
| Hospitalized2 | 21,607 | 23,378 | ≤3,0001 | |
| Deaths per Day2 | 345 | 352 | ≤501 | |
| 1my goals to stop daily posts, 27-day average for Cases, Currently Hospitalized, and Deaths 🚩 Increasing 7-day average week-over-week for Cases, Hospitalized, and Deaths ✅ Goal met. | ||||
 Click on graph for larger image.
This graph shows the daily (columns) and 7-day average (line) of deaths reported.
AAR: September Rail Carloads Mostly Unchanged Year-over-year, Intermodal Down
by Calculated Risk on 10/07/2022 02:34:00 PM
From the Association of American Railroads (AAR) Rail Time Indicators. Graphs and excerpts reprinted with permission.
Total carloads on U.S. railroads were down 1.1% in September 2022 from September 2021. Since 1988, when our carload data begin, only 2020 had fewer total carloads in September than 2022 did. ... Intermodal was down 4.8% in September, its seventh straight decline and 14th decline in the past 15 months. So far this year, only January had lower intermodal volumes than September. That’s unusual. On average, September is the third highest intermodal month of the year (behind October and August). Intermodal volumes are being constrained by a shift in consumer spending away from goods and towards services, as well as by high inflation that means the same amount of money spent means a smaller quantity of goods purchased.
emphasis added
 Click on graph for larger image.
This graph from the Rail Time Indicators report shows the six-week average of U.S. Carloads in 2020, 2021 and 2022:
Total carloads on U.S. railroads averaged 232,148 per week in September 2022. That’s down 1.1% from September 2021, up 4.6% from September 2020, and down 6.5% from September 2019. Since 1988, when our carload data begin, only 2020 had fewer total carloads in September than 2022 did.
 The second graph shows the six-week average (not monthly) of U.S. intermodal in 2020, 2021 and 2022: (using intermodal or shipping containers):
Intermodal averaged 252,826 containers and trailers per week in September 2022. That’s down 4.8% from last September, the seventh straight decline, and the biggest percentage decline in five months.
So far this year, only January had lower intermodal volumes than September
Realtor.com Reports Weekly Active Inventory Up 30% Year-over-year; New Listings Down 17%
by Calculated Risk on 10/07/2022 12:50:00 PM
Realtor.com has monthly and weekly data on the existing home market. Here is their weekly report released yesterday from Chief Economist Danielle Hale and Jiayi Xu: Weekly Housing Trends View — Data Week Ending Oct 1, 2022. Note: They have data on list prices, new listings and more, but this focus is on inventory.
• Active inventory continued to grow, increasing 30% above one year ago. Highlighting the roller coaster ride that the housing market and its participants have been on in the last few years, one’s take on the current number of homes for sale depends very much on the comparison point. After a period of unusually hot activity, financial conditions are cooling demand in the housing market and there are substantially more homes for-sale compared to one year ago. However, the market still falls short of pre-pandemic inventory levels by an even greater amount.
...
• New listings–a measure of sellers putting homes up for sale–were again down, dropping 17% from one year ago. This week marks the thirteenth straight week of year over year declines in the number of new listings coming up for sale. As mortgage rates near 7 percent, which is a level not seen in more than two decades, sellers who are also trying to buy a home, nearly 3 of every 4 potential sellers, have had to alter their trade-up plans.
 Here is a graph of the year-over-year change in inventory according to realtor.com.
 Note the rapid increase in the YoY change earlier this year, from down 30% at the beginning of the year, to up 29% YoY at the beginning of July.
However, the Realtor.com data has been stuck at up around 26% to 30% YoY for 14 weeks in a row. This is due to the slowdown in new listings, even as sales have fallen sharply.
Q3 GDP Tracking Close to 2%
by Calculated Risk on 10/07/2022 12:49:00 PM
From BofA:
The narrowing of the August trade deficit to $67.4bn was slightly more than expected. After rounding, the data since our last weekly publication caused our 3Q US GDP tracking estimate to remain at 1.5% q/q saar. [October 7th estimate]From Goldman:
emphasis added
We left our Q3 GDP tracking estimate unchanged at +1.9% (qoq ar). [October 7th estimate]And from the Altanta Fed: GDPNow
The GDPNow model estimate for real GDP growth (seasonally adjusted annual rate) in the third quarter of 2022 is 2.9 percent on October 7, up from 2.7 percent on October 5. After this morning's employment situation report by the US Bureau of Labor Statistics and the wholesale trade report from the US Census Bureau, the nowcasts of third-quarter real personal consumption expenditures growth and third-quarter real gross private domestic investment growth increased from 1.1 percent and -3.6 percent, respectively, to 1.3 percent and -3.4 percent, respectively. [October 7th estimate]
Comments on September Employment Report
by Calculated Risk on 10/07/2022 09:40:00 AM
The headline jobs number in the September employment report was slightly above expectations, and employment for the previous two months was revised up by 11,000, combined. The participation rate decreased, pushing down the unemployment rate to 3.5% - equaling the lowest unemployment rate since 1969! And the employment-population ratio was unchanged.
Leisure and hospitality gained 83 thousand jobs in September. At the beginning of the pandemic, in March and April of 2020, leisure and hospitality lost 8.20 million jobs, and are now down 1.14 million jobs since February 2020. So, leisure and hospitality has now added back about 86% all of the jobs lost in March and April 2020.
Construction employment increased 19 thousand and is now 95 thousand above the pre-pandemic level.
Manufacturing added 22 thousand jobs and is now 163 thousand above the pre-pandemic level.
Education: As expected, fewer educators than usual were hired in September, and this resulted in a seasonally adjusted loss of 29 thousand jobs education jobs.
Earlier: September Employment Report: 263 thousand Jobs, 3.5% Unemployment Rate
In September, the year-over-year employment change was 5.69 million jobs.
Prime (25 to 54 Years Old) Participation
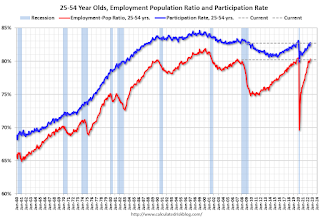 Since the overall participation rate has declined due to cyclical (recession) and demographic (aging population, younger people staying in school) reasons, here is the employment-population ratio for the key working age group: 25 to 54 years old.
The 25 to 54 participation rate decreased in September to 82.7% from 82.8% in August, and the 25 to 54 employment population ratio decreased to 80.2% from 80.3% the previous month.
Both are close to the pre-pandemic levels and indicate almost all of the prime age workers have returned to the labor force.
Part Time for Economic Reasons
 From the BLS report:
These workers are included in the alternate measure of labor underutilization (U-6) that decreased to 6.7% from 7.0% in the previous month. This is down from the record high in April 22.9%, and matches the lowest level on record for this measure since 1994. This measure is below the level in February 2020 (pre-pandemic).
Unemployed over 26 Weeks
 This graph shows the number of workers unemployed for 27 weeks or more.
According to the BLS, there are 1.067 million workers who have been unemployed for more than 26 weeks and still want a job, down from 1.137 million the previous month.
This is back to pre-pandemic levels.
Summary:
The headline monthly jobs number was slightly above expectations and employment for the previous two months was revised up by 11,000, combined.
Part Time for Economic Reasons
 From the BLS report:
"The number of persons employed part time for economic reasons decreased by 306,000 to 3.8 million in September. These individuals, who would have preferred full-time employment, were working part time because their hours had been reduced or they were unable to find full-time jobs."The number of persons working part time for economic reasons decreased in September to 3.843 million from 4.149 million in August. This is below pre-recession levels.
These workers are included in the alternate measure of labor underutilization (U-6) that decreased to 6.7% from 7.0% in the previous month. This is down from the record high in April 22.9%, and matches the lowest level on record for this measure since 1994. This measure is below the level in February 2020 (pre-pandemic).
Unemployed over 26 Weeks
 This graph shows the number of workers unemployed for 27 weeks or more.
 According to the BLS, there are 1.067 million workers who have been unemployed for more than 26 weeks and still want a job, down from 1.137 million the previous month.
This is back to pre-pandemic levels.
Summary:
The headline monthly jobs number was slightly above expectations and employment for the previous two months was revised up by 11,000, combined.
The headline unemployment rate decreased to 3.5%.
Overall, this was another solid employment report.


