by Calculated Risk on 10/11/2022 08:15:00 AM
Tuesday, October 11, 2022
Second Home Market: South Lake Tahoe in September
With the pandemic, there was a surge in 2nd home buying.
I'm looking at data for some second home markets - and I'm tracking those markets to see if there is an impact from lending changes, rising mortgage rates or the easing of the pandemic.
This graph is for South Lake Tahoe since 2004 through September 2022, and shows inventory (blue), and the year-over-year (YoY) change in the median price (12-month average).
Note: The median price is distorted by the mix, but this is the available data.
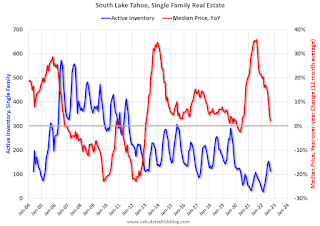
Following the housing bubble, prices declined for several years in South Lake Tahoe, with the median price falling about 50% from the bubble peak.
Currently inventory is still very low, but still up 4-fold from the record low set in February 2022, and up 38% year-over-year. Prices are up 2.3% YoY (and the YoY change has been trending down).
Monday, October 10, 2022
Leading Index for Commercial Real Estate "Rises" in September
by Calculated Risk on 10/10/2022 03:08:00 PM
From Dodge Data Analytics: Dodge Momentum Index Rises In September
The Dodge Momentum Index (DMI), issued by Dodge Construction Network, improved 5.7% (2000=100) in September to 183.2 from the revised August reading of 173.4. The DMI is a monthly measure of the initial report for nonresidential building projects in planning, shown to lead construction spending for nonresidential buildings by a full year. In September, the commercial component of the Momentum Index rose 2.9%, while the institutional component also increased, seeing a double-digit gain of 11.7%.
After a solid performance in September, the DMI landed less than 5% below an all-time high. On the commercial side, the figure was primarily bolstered by an influx of data centers entering the planning queue. The institutional component saw a notable increase in research and development laboratory projects in the education sector, with solid contributions from healthcare and recreation projects entering the planning process. On a year-over-year basis, the DMI was 26% higher than September in 2021; the commercial component was up 25%, and institutional planning was 28% higher.
emphasis added
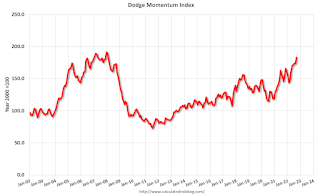 Click on graph for larger image.
This graph shows the Dodge Momentum Index since 2002. The index was at 183.2 in September, up from 173.4 in August.
According to Dodge, this index leads "construction spending for nonresidential buildings by a full year". This index suggests a solid pickup in commercial real estate construction at the end of this year and into 2023.
Current State of the Housing Market; Overview for mid-October
by Calculated Risk on 10/10/2022 11:35:00 AM
Today, in the Calculated Risk Real Estate Newsletter: Current State of the Housing Market
A brief excerpt:
Over the last month …There is much more in the article. You can subscribe at https://calculatedrisk.substack.com/
1. New listings have declined further year-over-year.
2. Mortgage rates have increased further pushing monthly payments up sharply.
3. House prices have started to decline month-over-month (MoM) as measured by the repeat sales indexes.
...
The following graph from MortgageNewsDaily.com shows mortgage rates over the last 12 months.
Currently mortgage rates are at a 20-year high. The payment on a $500,000 house with 20% last year, with 3.2% 30-year mortgage rates, would be around $1,730 for principal and interest. The payment for the same house, with prices up 15% and mortgage rates at 7.1%, would be $3,091 - an increase of 79%!
...
A week from Thursday, the NAR will release existing home sales for September. This report will likely show another sharp year-over-year decline in sales for September.
Housing October 10th Weekly Update: Inventory Increased Slightly; Now Above Same Week in 2020
by Calculated Risk on 10/10/2022 08:45:00 AM
 Click on graph for larger image.
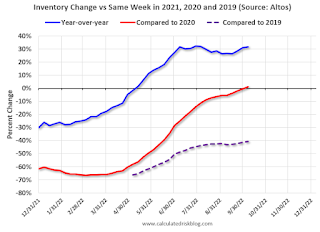
This inventory graph is courtesy of Altos Research.
1. The seasonal bottom (happened on March 4, 2022, for Altos) ✅
2. Inventory up year-over-year (happened on May 13, 2022, for Altos) ✅
3. Inventory up compared to two years ago (happened on October 9, 2022, for Altos) ✅
4. Inventory up compared to 2019 (currently down 40.7%).
Four High Frequency Indicators for the Economy
by Calculated Risk on 10/10/2022 08:21:00 AM
These indicators are mostly for travel and entertainment. It is interesting to watch these sectors recover as the pandemic subsides.
The TSA is providing daily travel numbers.
This data is as of October 8th.
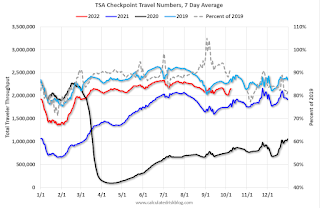 Click on graph for larger image.
This data shows the 7-day average of daily total traveler throughput from the TSA for 2019 (Light Blue), 2020 (Black), 2021 (Blue) and 2022 (Red).
The dashed line is the percent of 2019 for the seven-day average.
The 7-day average is down 9.1% from the same day in 2019 (90.9% of 2019). (Dashed line)
 This data shows domestic box office for each week and the median for the years 2016 through 2019 (dashed light blue).
 Note that the data is usually noisy week-to-week and depends on when blockbusters are released.
Movie ticket sales were at $88 million last week, down about 35% from the median for the week.
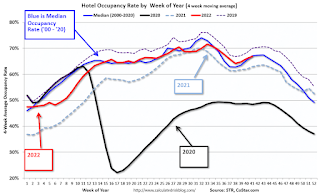 This graph shows the seasonal pattern for the hotel occupancy rate using the four-week average.
 The red line is for 2022, black is 2020, blue is the median, and dashed light blue is for 2021. Dashed purple is 2019 (STR is comparing to a strong year for hotels).
This data is through Oct 1st. The occupancy rate was down 2.4% compared to the same week in 2019.
Notes: Y-axis doesn't start at zero to better show the seasonal change.
Blue is for 2020. Purple is for 2021, and Red is for 2022.
As of September 30th, gasoline supplied was up 3.6% compared to the same week in 2019.
Recently gasoline supplied has been running below 2019 and 2021 levels - and sometimes below 2020. This is only the 2nd week this year that gasoline supplied was above 2019 levels.
Sunday, October 09, 2022
Sunday Night Futures
by Calculated Risk on 10/09/2022 06:55:00 PM
Weekend:
• Schedule for Week of October 9, 2022
Monday:
• Columbus Day Holiday: Banks will be closed in observance of Columbus Day. The stock market will be open. No economic releases are scheduled.
• At 1:35 PM ET, Speech, Fed Vice Chair Lael Brainard, Restoring Price Stability in an Uncertain Economic Environment, At the National Association for Business Economics (NABE) Annual Meeting, Chicago, Ill.
From CNBC: Pre-Market Data and Bloomberg futures S&P 500 are down 26 and DOW futures are down 174 (fair value).
Oil prices were up over the last week with WTI futures at $92.64 per barrel and Brent at $97.92 per barrel. A year ago, WTI was at $80, and Brent was at $82 - so WTI oil prices are up 15% year-over-year.
Here is a graph from Gasbuddy.com for nationwide gasoline prices. Nationally prices are at $3.91 per gallon. A year ago, prices were at $3.25 per gallon, so gasoline prices are up $0.66 per gallon year-over-year. NOTE: Gasoline prices in Los Angeles have spiked to a near record $6.40 per gallon due to refinery issues.
Housing Discussion with Fortune's Lance Lambert
by Calculated Risk on 10/09/2022 11:37:00 AM
On Friday, Fortune’s Lance Lambert and I discussed the US housing market.
Click here for audio
One of the key topics was household formation. Here is an excellent summary article by Katie McKellar at desert.com: The most ‘underreported’ factor influencing housing market, according to Calculated Risk
Bill McBride, author of the economics blog Calculated Risk, said there’s a key reason why both rent and home price growth is slowing amid the U.S. housing correction playing out today.
In a live Twitter Space hosted by Fortune Magazine on Friday, McBride called it the most “underreported” factor.
What is it? Household formation — both because of how much it accelerated amid the COVID-19 pandemic and how it’s slowing down now.
Wholesale Used Car Prices Declined in September; Prices Down Slightly Year-over-year
by Calculated Risk on 10/09/2022 08:11:00 AM
From Manheim Consulting on Friday: Wholesale Used-Vehicle Prices See Large Decline Again in September
Wholesale used-vehicle prices (on a mix, mileage, and seasonally adjusted basis) decreased 3.0% in September from August. The Manheim Used Vehicle Value Index declined to 204.5 and is now down 0.1% from a year ago. The non-adjusted price change in September was a decline of 2.1% compared to August, moving the unadjusted average price down 2.3% year over year.
emphasis added
 Click on graph for larger image.
This index from Manheim Consulting is based on all completed sales transactions at Manheim’s U.S. auctions.
Saturday, October 08, 2022
Real Estate Newsletter Articles this Week: 7 Years in Purgatory
by Calculated Risk on 10/08/2022 02:11:00 PM
At the Calculated Risk Real Estate Newsletter this week:
• House Prices: 7 Years in Purgatory
• Black Knight Mortgage Monitor: "Home Prices Down Again in August ... Now 2% Off June Peak"
• "For many [home] sellers, it likely feels like the rug has been pulled out from underneath them"
• Apartments: Net Absorption Very Low in Q3, New Construction Deliveries Even Lower
This is usually published 4 to 6 times a week and provides more in-depth analysis of the housing market.
You can subscribe at https://calculatedrisk.substack.com/
Schedule for Week of October 9, 2022
by Calculated Risk on 10/08/2022 08:11:00 AM
The key economic reports this week are September CPI and Retail Sales.
Columbus Day Holiday: Banks will be closed in observance of Columbus Day. The stock market will be open. No economic releases are scheduled.
1:35 PM: Speech, Fed Vice Chair Lael Brainard, Restoring Price Stability in an Uncertain Economic Environment, At the National Association for Business Economics (NABE) Annual Meeting, Chicago, Ill.
6:00 AM: NFIB Small Business Optimism Index for September.
7:00 AM ET: The Mortgage Bankers Association (MBA) will release the results for the mortgage purchase applications index.
8:30 AM: The Producer Price Index for September from the BLS. The consensus is for a 0.2% increase in PPI, and a 0.3% increase in core PPI.
2:00 PM: FOMC Minutes, Meeting of September 20-21, 2022
8:30 AM: The initial weekly unemployment claims report will be released. The consensus is for an increase to 225 thousand from 219 thousand last week (likely impact from Hurricane Ian).
8:30 AM: The Consumer Price Index for September from the BLS. The consensus is for a 0.2% increase in CPI, and a 0.5% increase in core CPI. The consensus is for CPI to be up 8.1% year-over-year and core CPI to be up 6.5% YoY.
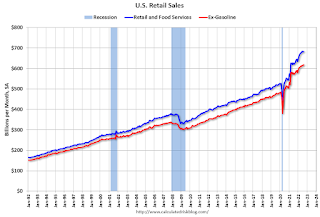 8:30 AM ET: Retail sales for September will be released. The consensus is for a 0.2% increase in retail sales.
This graph shows retail sales since 1992. This is monthly retail sales and food service, seasonally adjusted (total and ex-gasoline).
10:00 AM: University of Michigan's Consumer sentiment index (Preliminary for October).

