by Calculated Risk on 10/12/2022 02:06:00 PM
Wednesday, October 12, 2022
FOMC Minutes "Purposefully moving to a restrictive policy stance in the near term"
In their assessment of the effects of policy actions and communications to date, participants concurred that the Committee's actions to raise expeditiously the target range for the federal funds rate demonstrated its resolve to lower inflation to 2 percent and to keep inflation expectations anchored at levels consistent with that longer-run goal. Participants noted that the Committee's commitment to restoring price stability, together with its purposeful policy actions and communications, had contributed to a notable tightening of financial conditions over the past year that would likely help reduce inflation pressures by restraining aggregate demand. Participants observed that this tightening had led to substantial increases in real interest rates across the maturity spectrum. Most participants remarked that, although some interest-sensitive categories of spending—such as housing and business fixed investment—had already started to respond to the tightening of financial conditions, a sizable portion of economic activity had yet to display much response. They noted also that inflation had not yet responded appreciably to policy tightening and that a significant reduction in inflation would likely lag that of aggregate demand. Participants observed that a period of real GDP growth below its trend rate, very likely accompanied by some softening in labor market conditions, was required. They agreed that, by moving its policy purposefully toward an appropriately restrictive stance, the Committee would help ensure that elevated inflation did not become entrenched and that inflation expectations did not become unanchored. These policy moves would therefore prevent the far greater economic pain associated with entrenched high inflation, including the even tighter policy and more severe restraint on economic activity that would then be needed to restore price stability.
In light of the broad-based and unacceptably high level of inflation, the intermeeting news of higher-than-expected inflation, and upside risks to the inflation outlook, participants remarked that purposefully moving to a restrictive policy stance in the near term was consistent with risk-management considerations. Many participants emphasized that the cost of taking too little action to bring down inflation likely outweighed the cost of taking too much action. Several participants underlined the need to maintain a restrictive stance for as long as necessary, with a couple of these participants stressing that historical experience demonstrated the danger of prematurely ending periods of tight monetary policy designed to bring down inflation. Several participants observed that as policy moved into restrictive territory, risks would become more two-sided, reflecting the emergence of the downside risk that the cumulative restraint in aggregate demand would exceed what was required to bring inflation back to 2 percent. A few of these participants noted that this possibility was heightened by factors beyond the Committee's actions, including the tightening of monetary policy stances abroad and the weakening global economic outlook, that were also likely to restrain domestic economic activity in the period ahead.
emphasis added
2nd Look at Local Housing Markets in September
by Calculated Risk on 10/12/2022 11:07:00 AM
Today, in the Calculated Risk Real Estate Newsletter: 2nd Look at Local Housing Markets in September
A brief excerpt:
This is the second look at local markets in September. I’m tracking about 35 local housing markets in the US. Some of the 35 markets are states, and some are metropolitan areas. I’ll update these tables throughout the month as additional data is released.There is much more in the article. You can subscribe at https://calculatedrisk.substack.com/
We are seeing a sharp decline in closed sales, and inventory is up significantly year-over-year. Also, new listings are down as the sellers’ strike continues. The increase in inventory so far has been due to softer demand because of higher mortgage rates.
In September, sales were down 22.5%. In August, sales in these same markets were down 20.2% YoY Not Seasonally Adjusted (NSA).
Note that in September 2022, there were the same number of selling days as in September 2021, so the SA decline will be similar to the NSA decline. Last month, in August 2022, there was one more selling day than in August 2021 - so seasonally adjusted, the decline in sales in September will be about the same as in August for these markets.
Closed sales in September were mostly for contracts signed in July and August when 30-year mortgage rates averaged about 5.3%. Rates increased to around 6% in September and that will impact closed sales in October and November. In early October 30-year rates have jumped to over 7%.
Many more local markets to come!
MBA: Mortgage Applications Decrease in Latest Weekly Survey; Purchase Activity 7% Below Pandemic Low
by Calculated Risk on 10/12/2022 07:00:00 AM
From the MBA: Mortgage Applications Decrease in Latest MBA Weekly Survey
Mortgage applications decreased 2.0 percent from one week earlier, according to data from the Mortgage Bankers Association’s (MBA) Weekly Mortgage Applications Survey for the week ending October 7, 2022.
... The Refinance Index decreased 2 percent from the previous week and was 86 percent lower than the same week one year ago. The seasonally adjusted Purchase Index decreased 2 percent from one week earlier. The unadjusted Purchase Index decreased 2 percent compared with the previous week and was 39 percent lower than the same week one year ago.
“Mortgage rates moved higher once again during the first week of the fourth quarter of 2022, with the 30- year conforming rate reaching 6.81 percent, the highest level since 2006. Mortgage rates increased across all product types in MBA’s survey, with the largest, a 20-basis-point increase, for 5-year ARM loans. The ARM share of applications remained quite high at 11.7 percent – just below last week’s level,” said Mike Fratantoni, MBA’s Senior Vice President and Chief Economist. “Application volumes for both refinancing and home purchases declined and continue to fall further behind last year’s record levels. The news that job growth and wage growth continued in September is positive for the housing market, as higher incomes support housing demand. However, it also pushed off the possibility of any near-term pivot from the Federal Reserve on its plans for additional rate hikes.”
...
The average contract interest rate for 30-year fixed-rate mortgages with conforming loan balances ($647,200 or less) increased to 6.81 percent from 6.75 percent, with points increasing to 0.97 from 0.95 (including the origination fee) for 80 percent loan-to-value ratio (LTV) loans.
emphasis added
 Click on graph for larger image.
The first graph shows the refinance index since 1990.
Note: Red is a four-week average (blue is weekly).
Tuesday, October 11, 2022
Wednesday: PPI, FOMC Minutes
by Calculated Risk on 10/11/2022 08:10:00 PM
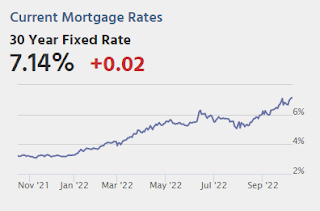
Treasury futures took a beating on Monday as the UK bond market once again traded in panic mode. The high rate implications were still in place as of Tuesday's overnight trading. 10yr Treasury yields broke above 4.0% yet again and continued struggling to move much lower until later in the trading day. ... The weaker opening levels resulted in mortgage rates remaining at long term highs, but they would have been higher highs had it not been for an admirable show of support in the bond market. In fact, by the afternoon hours, Treasuries and MBS were both very close to the same territory seen on Friday afternoon ... [30 year fixed 7.14%]Wednesday:
emphasis added
• At 7:00 AM ET, The Mortgage Bankers Association (MBA) will release the results for the mortgage purchase applications index.
• At 8:30 AM, The Producer Price Index for September from the BLS. The consensus is for a 0.2% increase in PPI, and a 0.3% increase in core PPI.
• At 2:00 PM, FOMC Minutes, Meeting of September 20-21, 2022
MBA: Mortgage Credit Availability was Never Excessive During the Recent Housing Boom
by Calculated Risk on 10/11/2022 10:39:00 AM
Today, in the Calculated Risk Real Estate Newsletter: MBA: Mortgage Credit Availability was Never Excessive During the Recent Housing Boom
A brief excerpt:
Although mortgage credit availability decreased in September (the MBA headline below), the most important point is mortgage credit availability was never excessive during the boom. Here is the expanded series from the MBA of mortgage credit availability that includes the bubble years (2004 - 2006).There is much more in the article. You can subscribe at https://calculatedrisk.substack.com/
...
Look at that huge increase in mortgage credit availability back in the 2004 - 2006 period (remember “fog a mirror, get a loan”, NINJA loans: No Income, No Job or Assets?). In the recent boom, lending was reasonably solid, and most homeowners have substantial equity in their homes. Although I expect an increase in foreclosures from record low levels, there will not be a huge wave of foreclosures as happened following the housing bubble. The distressed sales during the housing bust led to cascading price declines, and that will not happen this time.
Here is the article from the MBA: Mortgage Credit Availability Decreased in September
Second Home Market: South Lake Tahoe in September
by Calculated Risk on 10/11/2022 08:15:00 AM
With the pandemic, there was a surge in 2nd home buying.
I'm looking at data for some second home markets - and I'm tracking those markets to see if there is an impact from lending changes, rising mortgage rates or the easing of the pandemic.
This graph is for South Lake Tahoe since 2004 through September 2022, and shows inventory (blue), and the year-over-year (YoY) change in the median price (12-month average).
Note: The median price is distorted by the mix, but this is the available data.
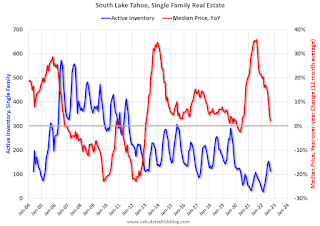
Following the housing bubble, prices declined for several years in South Lake Tahoe, with the median price falling about 50% from the bubble peak.
Currently inventory is still very low, but still up 4-fold from the record low set in February 2022, and up 38% year-over-year. Prices are up 2.3% YoY (and the YoY change has been trending down).
Monday, October 10, 2022
Leading Index for Commercial Real Estate "Rises" in September
by Calculated Risk on 10/10/2022 03:08:00 PM
From Dodge Data Analytics: Dodge Momentum Index Rises In September
The Dodge Momentum Index (DMI), issued by Dodge Construction Network, improved 5.7% (2000=100) in September to 183.2 from the revised August reading of 173.4. The DMI is a monthly measure of the initial report for nonresidential building projects in planning, shown to lead construction spending for nonresidential buildings by a full year. In September, the commercial component of the Momentum Index rose 2.9%, while the institutional component also increased, seeing a double-digit gain of 11.7%.
After a solid performance in September, the DMI landed less than 5% below an all-time high. On the commercial side, the figure was primarily bolstered by an influx of data centers entering the planning queue. The institutional component saw a notable increase in research and development laboratory projects in the education sector, with solid contributions from healthcare and recreation projects entering the planning process. On a year-over-year basis, the DMI was 26% higher than September in 2021; the commercial component was up 25%, and institutional planning was 28% higher.
emphasis added
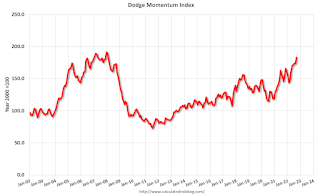 Click on graph for larger image.
This graph shows the Dodge Momentum Index since 2002. The index was at 183.2 in September, up from 173.4 in August.
According to Dodge, this index leads "construction spending for nonresidential buildings by a full year". This index suggests a solid pickup in commercial real estate construction at the end of this year and into 2023.
Current State of the Housing Market; Overview for mid-October
by Calculated Risk on 10/10/2022 11:35:00 AM
Today, in the Calculated Risk Real Estate Newsletter: Current State of the Housing Market
A brief excerpt:
Over the last month …There is much more in the article. You can subscribe at https://calculatedrisk.substack.com/
1. New listings have declined further year-over-year.
2. Mortgage rates have increased further pushing monthly payments up sharply.
3. House prices have started to decline month-over-month (MoM) as measured by the repeat sales indexes.
...
The following graph from MortgageNewsDaily.com shows mortgage rates over the last 12 months.
Currently mortgage rates are at a 20-year high. The payment on a $500,000 house with 20% last year, with 3.2% 30-year mortgage rates, would be around $1,730 for principal and interest. The payment for the same house, with prices up 15% and mortgage rates at 7.1%, would be $3,091 - an increase of 79%!
...
A week from Thursday, the NAR will release existing home sales for September. This report will likely show another sharp year-over-year decline in sales for September.
Housing October 10th Weekly Update: Inventory Increased Slightly; Now Above Same Week in 2020
by Calculated Risk on 10/10/2022 08:45:00 AM
 Click on graph for larger image.
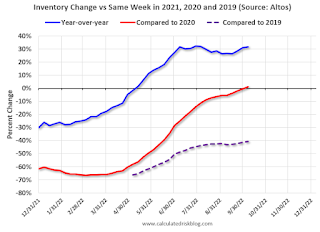
This inventory graph is courtesy of Altos Research.
1. The seasonal bottom (happened on March 4, 2022, for Altos) ✅
2. Inventory up year-over-year (happened on May 13, 2022, for Altos) ✅
3. Inventory up compared to two years ago (happened on October 9, 2022, for Altos) ✅
4. Inventory up compared to 2019 (currently down 40.7%).
Four High Frequency Indicators for the Economy
by Calculated Risk on 10/10/2022 08:21:00 AM
These indicators are mostly for travel and entertainment. It is interesting to watch these sectors recover as the pandemic subsides.
The TSA is providing daily travel numbers.
This data is as of October 8th.
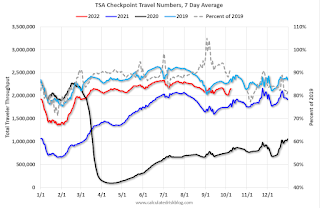 Click on graph for larger image.
This data shows the 7-day average of daily total traveler throughput from the TSA for 2019 (Light Blue), 2020 (Black), 2021 (Blue) and 2022 (Red).
The dashed line is the percent of 2019 for the seven-day average.
The 7-day average is down 9.1% from the same day in 2019 (90.9% of 2019). (Dashed line)
 This data shows domestic box office for each week and the median for the years 2016 through 2019 (dashed light blue).
 Note that the data is usually noisy week-to-week and depends on when blockbusters are released.
Movie ticket sales were at $88 million last week, down about 35% from the median for the week.
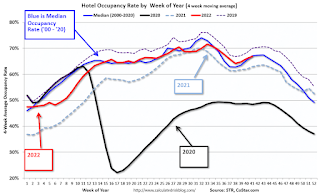 This graph shows the seasonal pattern for the hotel occupancy rate using the four-week average.
 The red line is for 2022, black is 2020, blue is the median, and dashed light blue is for 2021. Dashed purple is 2019 (STR is comparing to a strong year for hotels).
This data is through Oct 1st. The occupancy rate was down 2.4% compared to the same week in 2019.
Notes: Y-axis doesn't start at zero to better show the seasonal change.
Blue is for 2020. Purple is for 2021, and Red is for 2022.
As of September 30th, gasoline supplied was up 3.6% compared to the same week in 2019.
Recently gasoline supplied has been running below 2019 and 2021 levels - and sometimes below 2020. This is only the 2nd week this year that gasoline supplied was above 2019 levels.


