by Calculated Risk on 10/17/2022 02:26:00 PM
Monday, October 17, 2022
Lawler: Early Read on Existing Home Sales in September; CAR Predicts Home Prices to Decline 8.8% in 2023!
Today, in the Calculated Risk Real Estate Newsletter: Lawler: Early Read on Existing Home Sales in September; CAR Predicts Home Prices to Decline 8.8% in 2023!
Excerpt:
A few topics from housing economist Tom Lawler:
Early Read on Existing Home Sales in September
Based on publicly-available local realtor/MLS reports released across the country through today, I project that existing home sales as estimated by the National Association of Realtors ran at a seasonally adjusted annual rate of 4.82 million in September, up 0.4% from August’s preliminary pace and down 22.0%% from last September’s seasonally adjusted pace. On an unadjusted basis the YOY % decline in sales was largest in the West, and smallest in the Midwest and Northeast.
...
Finally, local realtor/MLS reports suggest that the median existing single-family home sales price last month was up by about 8.0% from last September.
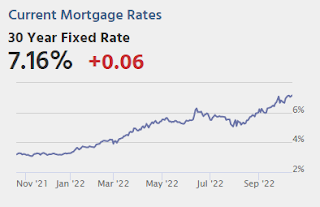
In terms of sales, note that mortgage rates, after reaching slightly over 6 % on June 21, fell back down fell back down to around 5 ¼% on August 1, but have since moved sharply higher to around 7%. This latest sharp rise will almost certainly result in substantially lower home sales in the last few months of this year.
Some "Good News" for Homebuilders
by Calculated Risk on 10/17/2022 11:49:00 AM
Today, in the Calculated Risk Real Estate Newsletter: Some "Good News" for Homebuilders
Excerpt:
Yesterday, in Monthly Mortgage Payments Up Record Year-over-year, I mentioned some “good news” for homebuilders:Even though we can expect significant further declines in new home sales and single-family housing starts, the good news for the homebuilders is activity usually picks up quickly following an interest rate induced slowdown (as opposed to following the housing bust when the recovery took many years).Here is a graph to illustrate this point. The following graph shows new home sales for three periods: 1978-1982, 2005-2020, and current (red). The prior peak in sales is set to 100.
When the Fed took their foot off the brake in 1982, new home sales recovered fairly quickly (blue). The same is true for the 1989 -1991 bust (not shown).
However, following the housing bubble, new home sales languished for several years - well after the Fed reduced the Fed Funds rate to zero - due to all the distressed sales on the housing market.
Housing October 17th Weekly Update: Inventory Increased, New High for 2022
by Calculated Risk on 10/17/2022 08:46:00 AM
 Click on graph for larger image.
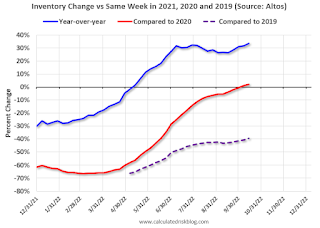
This inventory graph is courtesy of Altos Research.
1. The seasonal bottom (happened on March 4, 2022, for Altos) ✅
2. Inventory up year-over-year (happened on May 20, 2022, for Altos) ✅
3. Inventory up compared to 2020 (happened on October 7, 2022, for Altos) ✅
4. Inventory up compared to 2019 (currently down 39.5%).
Four High Frequency Indicators for the Economy
by Calculated Risk on 10/17/2022 08:25:00 AM
These indicators are mostly for travel and entertainment. It is interesting to watch these sectors recover as the pandemic subsides.
The TSA is providing daily travel numbers.
This data is as of October 15th.
 Click on graph for larger image.
This data shows the 7-day average of daily total traveler throughput from the TSA for 2019 (Light Blue), 2020 (Black), 2021 (Blue) and 2022 (Red).
The dashed line is the percent of 2019 for the seven-day average.
The 7-day average is down 6.9% from the same day in 2019 (93.1% of 2019). (Dashed line)
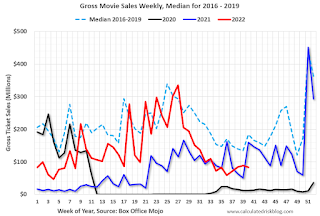
 This data shows domestic box office for each week and the median for the years 2016 through 2019 (dashed light blue).
 Note that the data is usually noisy week-to-week and depends on when blockbusters are released.
Movie ticket sales were at $83 million last week, down about 55% from the median for the week.
 This graph shows the seasonal pattern for the hotel occupancy rate using the four-week average.
 The red line is for 2022, black is 2020, blue is the median, and dashed light blue is for 2021. Dashed purple is 2019 (STR is comparing to a strong year for hotels).
This data is through Oct 8th. The occupancy rate was down 3.5% compared to the same week in 2019.
Notes: Y-axis doesn't start at zero to better show the seasonal change.
Blue is for 2020. Purple is for 2021, and Red is for 2022.
As of October 7th, gasoline supplied was down 12.5% compared to the same week in 2019.
Recently gasoline supplied has been running below 2019 and 2021 levels - and sometimes below 2020.
Sunday, October 16, 2022
Sunday Night Futures
by Calculated Risk on 10/16/2022 07:13:00 PM
Weekend:
• Schedule for Week of October 16, 2022
Monday:
• At 8:30 AM ET, The New York Fed Empire State manufacturing survey for October. The consensus is for a reading of -4.0, down from -1.5.
From CNBC: Pre-Market Data and Bloomberg futures S&P 500 are up 15 and DOW futures are up 110 (fair value).
Oil prices were down over the last week with WTI futures at $86.18 per barrel and Brent at $92.32 per barrel. A year ago, WTI was at $82, and Brent was at $852 - so WTI oil prices are up 5% year-over-year.
Here is a graph from Gasbuddy.com for nationwide gasoline prices. Nationally prices are at $3.86 per gallon. A year ago, prices were at $3.30 per gallon, so gasoline prices are up $0.56 per gallon year-over-year.
Monthly Mortgage Payments Up Record Year-over-year
by Calculated Risk on 10/16/2022 10:59:00 AM
Today, in the Calculated Risk Real Estate Newsletter: Monthly Mortgage Payments Up Record Year-over-year
Excerpt:
The following graph shows the year-over-year change in principal & interest (P&I) assuming a fixed loan amount since 1977. Currently P&I is up about 59% year-over-year for a fixed amount (this doesn’t take into account the change in house prices).
This is above the previous record increase of 50% in 1980. This assumed a fixed loan amount - if we add in the year-over-year increase in house prices, payments would be up over 70% YoY for the same house.
This is one of the reasons I've argued Housing: Don't Compare the Current Housing Boom to the Bubble and Bust, Look instead at the 1978 to 1982 period for lessons.
...
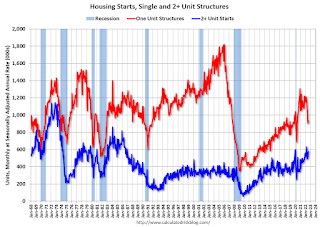
In the 1980 period, new home sales fell about 40% YoY and about 60% from the peak in the 1970s to the trough in 1980. A similar decline might push new home sales down to around 400 thousand SAAR in coming months. ... Even though we can expect significant further declines in new home sales and single-family housing starts, the good news for the homebuilders is activity usually picks up quickly following an interest rate induced slowdown (as opposed to following the housing bust when the recovery took many years).
Saturday, October 15, 2022
Real Estate Newsletter Articles this Week: Current State of the Housing Market
by Calculated Risk on 10/15/2022 02:11:00 PM
At the Calculated Risk Real Estate Newsletter this week:
• Current State of the Housing Market
• House Prices to National Average Wage Index
• 2nd Look at Local Housing Markets in September
• MBA: Mortgage Credit Availability was Never Excessive During the Recent Housing Boom
• Housing Discussion with Fortune's Lance Lambert
This is usually published 4 to 6 times a week and provides more in-depth analysis of the housing market.
You can subscribe at https://calculatedrisk.substack.com/
Schedule for Week of October 16, 2022
by Calculated Risk on 10/15/2022 08:11:00 AM
The key economic reports this week are September Housing Starts and Existing Home sales.
For manufacturing, September Industrial Production, and the October New York and Philly Fed surveys will be released this week.
8:30 AM ET: The New York Fed Empire State manufacturing survey for October. The consensus is for a reading of -4.0, down from -1.5.
 9:15 AM: The Fed will release Industrial Production and Capacity Utilization for September.
This graph shows industrial production since 1967.
The consensus is for a 0.1% increase in Industrial Production, and for Capacity Utilization to be unchanged at 80.0%.
10:00 AM: The October NAHB homebuilder survey. The consensus is for a reading of 44, down from 46 in September. Any number below 50 indicates that more builders view sales conditions as poor than good.
7:00 AM ET: The Mortgage Bankers Association (MBA) will release the results for the mortgage purchase applications index.
 8:30 AM: Housing Starts for September.
 This graph shows single and multi-family housing starts since 1968.
The consensus is for 1.478 million SAAR, down from 1.575 million SAAR.
During the day: The AIA's Architecture Billings Index for September (a leading indicator for commercial real estate).
2:00 PM: the Federal Reserve Beige Book, an informal review by the Federal Reserve Banks of current economic conditions in their Districts.
8:30 AM: The initial weekly unemployment claims report will be released. The consensus is for an increase to 232 thousand from 228 thousand last week.
8:30 AM: the Philly Fed manufacturing survey for October. The consensus is for a reading of -4.5, up from -9.9.
 10:00 AM: Existing Home Sales for September from the National Association of Realtors (NAR). The consensus is for 4.69 million SAAR, down from 4.80 million in August.
The graph shows existing home sales from 1994 through the report last month.
10:00 AM: State Employment and Unemployment (Monthly) for September 2022
Friday, October 14, 2022
COVID Oct 14, 2022: Update on Cases, Hospitalizations and Deaths
by Calculated Risk on 10/14/2022 08:56:00 PM

NOTE: COVID stats are updated on Fridays.
On COVID (focus on hospitalizations and deaths):
Average daily deaths bottomed in July 2021 at 214 per day.
| COVID Metrics | ||||
|---|---|---|---|---|
| Now | Week Ago | Goal | ||
| New Cases per Day2 | 37,808 | 42,593 | ≤5,0001 | |
| Hospitalized2 | 19,625 | 21,607 | ≤3,0001 | |
| Deaths per Day2 | 332 | 368 | ≤501 | |
| 1my goals to stop daily posts, 27-day average for Cases, Currently Hospitalized, and Deaths 🚩 Increasing 7-day average week-over-week for Cases, Hospitalized, and Deaths ✅ Goal met. | ||||
 Click on graph for larger image.
This graph shows the daily (columns) and 7-day average (line) of deaths reported.
Q3 GDP Tracking: Moving on Up
by Calculated Risk on 10/14/2022 12:36:00 PM
From BofA:
On net, today's data on retail sales and import and export prices pushed up our 3Q US GDP tracking estimate by 0.2pp to 1.9% q/q saar, from 1.7% previously. [October 14th estimate]From Goldman:
emphasis added
Following today’s data, we boosted our Q3 GDP tracking estimate by 0.4pp to +2.3% (qoq ar). [October 14th estimate]And from the Altanta Fed: GDPNow
The GDPNow model estimate for real GDP growth (seasonally adjusted annual rate) in the third quarter of 2022 is 2.8 percent on October 14, down from 2.9 percent on October 7. After recent releases from the US Bureau of Labor Statistics and the US Census Bureau, the nowcast of third-quarter real personal consumption expenditures growth decreased from 1.3 percent to 1.2 percent. [October 14th estimate]


