by Calculated Risk on 10/18/2022 12:26:00 PM
Tuesday, October 18, 2022
3rd Look at Local Housing Markets in September, California Sales off 30% YoY
Today, in the Calculated Risk Real Estate Newsletter: 3rd Look at Local Housing Markets in September, California Sales off 30% YoY
A brief excerpt:
California doesn’t report monthly inventory numbers, but they do report the change in months of inventory. Here is the press release from the California Association of Realtors® (C.A.R.): Rising interest rates depress September home sales and prices, C.A.R. reportsThere is much more in the article. You can subscribe at https://calculatedrisk.substack.com/September’s sales pace was down 2.5 percent on a monthly basis from 313,540 in August and down 30.2 percent from a year ago ...
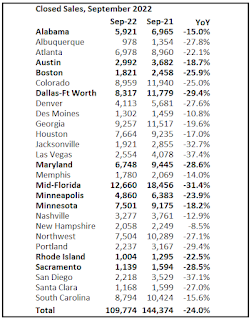
The statewide median home price continued to increase on a year-over-year basis in September, but the growth rate remained very mild compared to those observed earlier this year. At an increase of 1.6 percent year-over-year, September marked the fourth consecutive month with a single-digit annual increase. … With closed sales dropping more than 25 percent and pending sales falling over 40 percent, active listings have been staying on the market significantly longer, which contributed to a surge in for-sale properties by 51.5 percent in September.In September, sales were down 24.0% YoY Not Seasonally Adjusted (NSA) for these markets.
NOTE: Housing economist Tom Lawler expects the NAR to report sales of 4.82 million SAAR for September (the NAR reports this coming Thursday).!
NAHB: Builder Confidence Decreased Sharply in October
by Calculated Risk on 10/18/2022 10:07:00 AM
The National Association of Home Builders (NAHB) reported the housing market index (HMI) was at 38, down from 46 in September. Any number below 50 indicates that more builders view sales conditions as poor than good.
From the NAHB: Builder Confidence Down 10 Straight Months as Housing Market Continues to Weaken
In a further signal that rising interest rates, building material bottlenecks and elevated home prices continue to weaken the housing market, builder sentiment fell for the 10th straight month in October and traffic of prospective buyers fell to its lowest level since 2012 (excluding the two-month period in the spring of 2020 at the beginning of the pandemic).
Builder confidence in the market for newly built single-family homes dropped eight points in October to 38—half the level it was just six months ago—according to the National Association of Home Builders (NAHB)/Wells Fargo Housing Market Index (HMI) released today. This is the lowest confidence reading since August 2012, with the exception of the onset of the pandemic in the spring of 2020.
“High mortgage rates approaching 7% have significantly weakened demand, particularly for first-time and first-generation prospective home buyers,” said NAHB Chairman Jerry Konter, a home builder and developer from Savannah, Ga. “This situation is unhealthy and unsustainable. Policymakers must address this worsening housing affordability crisis.”
“This will be the first year since 2011 to see a decline for single-family starts,” said NAHB Chief Economist Robert Dietz. “And given expectations for ongoing elevated interest rates due to actions by the Federal Reserve, 2023 is forecasted to see additional single-family building declines as the housing contraction continues. While some analysts have suggested that the housing market is now more ‘balanced,’ the truth is that the homeownership rate will decline in the quarters ahead as higher interest rates and ongoing elevated construction costs continue to price out a large number of prospective buyers.”
...
All three HMI components posted declines in October. Current sales conditions fell nine points to 45, sales expectations in the next six months declined 11 points to 35 and traffic of prospective buyers fell six points to 25.
Looking at the three-month moving averages for regional HMI scores, the Northeast fell three points to 48, the Midwest dropped three points to 41, the South fell seven points to 49 and the West posted a seven-point decline to 34.
emphasis added
 Click on graph for larger image.
This graph shows the NAHB index since Jan 1985.
This was well below the consensus forecast, and the lowest level since 2012 (excluding the two-month drop at the beginning of the pandemic).
Industrial Production Increased 0.4 Percent in September
by Calculated Risk on 10/18/2022 09:20:00 AM
From the Fed: Industrial Production and Capacity Utilization
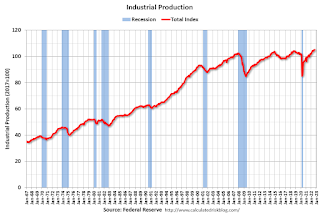
Industrial production increased 0.4 percent in September and 2.9 percent at an annual rate in the third quarter. In September, manufacturing output rose 0.4 percent after advancing a similar amount in the previous month. The index for mining moved up 0.6 percent, and the index for utilities fell 0.3 percent. At 105.2 percent of its 2017 average, total industrial production in September was 5.3 percent above its year-earlier level. Capacity utilization moved up 0.2 percentage point in September to 80.3 percent, a rate that is 0.7 percentage point above its long-run (1972–2021) average.
emphasis added
 Click on graph for larger image.
This graph shows Capacity Utilization. This series is up from the record low set in April 2020, and above the level in February 2020 (pre-pandemic).
Capacity utilization at 80.3% is 0.7% above the average from 1972 to 2021. This was above consensus expectations.
Note: y-axis doesn't start at zero to better show the change.
 The second graph shows industrial production since 1967.
Industrial production decreased in September to 105.2. This is above the pre-pandemic level.
The change in industrial production was above consensus expectations.
Monday, October 17, 2022
Tuesday: Industrial Production, Homebuilder Confidence
by Calculated Risk on 10/17/2022 09:19:00 PM

Tuesday:
• At 9:15 AM ET, The Fed will release Industrial Production and Capacity Utilization for September. The consensus is for a 0.1% increase in Industrial Production, and for Capacity Utilization to be unchanged at 80.0%.
• At 10:00 AM, The October NAHB homebuilder survey. The consensus is for a reading of 44, down from 46 in September. Any number below 50 indicates that more builders view sales conditions as poor than good.
MBA Survey: "Share of Mortgage Loans in Forbearance Decreases to 0.69% in September"
by Calculated Risk on 10/17/2022 04:00:00 PM
Note: This is as of September 30th.
From the MBA: Share of Mortgage Loans in Forbearance Decreases to 0.69% in September
The Mortgage Bankers Association’s (MBA) monthly Loan Monitoring Survey revealed that the total number of loans now in forbearance decreased by 3 basis points from 0.72% of servicers’ portfolio volume in the prior month to 0.69% as of September 30, 2022. According to MBA’s estimate, 345,000 homeowners are in forbearance plans.
The share of Fannie Mae and Freddie Mac loans in forbearance decreased 2 basis points to 0.30%. Ginnie Mae loans in forbearance increased 1 basis point to 1.33%, and the forbearance share for portfolio loans and private-label securities (PLS) declined 12 basis points to 1.14%.
“The overall number of loans in forbearance dropped in September, but the pace of forbearance exits slowed to a new survey low and new forbearance requests continued to come in. This dynamic in turn prevented any substantial improvement in the forbearance rate,” said Marina Walsh, CMB, MBA’s Vice President of Industry Analysis. “The COVID-19 federal health emergency is still in effect and in most cases, borrowers can still seek initial COVID-19 hardship forbearance.”
Added Walsh, “In the near-term, the number of loans in forbearance will likely increase for another reason – the recent devastation caused by Hurricane Ian in Florida, South Carolina, and other states. MBA’s Loan Monitoring Survey requests that servicers report all loans in forbearance regardless of the borrower’s stated reason – whether pandemic-related, due to a natural disaster, or another cause.”
emphasis added
 Click on graph for larger image.
This graph shows the percent of portfolio in forbearance by investor type over time.
The share of forbearance plans is decreasing, and, at the end of September, there were about 345,000 homeowners in forbearance plans.
Lawler: Early Read on Existing Home Sales in September; CAR Predicts Home Prices to Decline 8.8% in 2023!
by Calculated Risk on 10/17/2022 02:26:00 PM
Today, in the Calculated Risk Real Estate Newsletter: Lawler: Early Read on Existing Home Sales in September; CAR Predicts Home Prices to Decline 8.8% in 2023!
Excerpt:
A few topics from housing economist Tom Lawler:
Early Read on Existing Home Sales in September
Based on publicly-available local realtor/MLS reports released across the country through today, I project that existing home sales as estimated by the National Association of Realtors ran at a seasonally adjusted annual rate of 4.82 million in September, up 0.4% from August’s preliminary pace and down 22.0%% from last September’s seasonally adjusted pace. On an unadjusted basis the YOY % decline in sales was largest in the West, and smallest in the Midwest and Northeast.
...
Finally, local realtor/MLS reports suggest that the median existing single-family home sales price last month was up by about 8.0% from last September.
In terms of sales, note that mortgage rates, after reaching slightly over 6 % on June 21, fell back down fell back down to around 5 ¼% on August 1, but have since moved sharply higher to around 7%. This latest sharp rise will almost certainly result in substantially lower home sales in the last few months of this year.
Some "Good News" for Homebuilders
by Calculated Risk on 10/17/2022 11:49:00 AM
Today, in the Calculated Risk Real Estate Newsletter: Some "Good News" for Homebuilders
Excerpt:
Yesterday, in Monthly Mortgage Payments Up Record Year-over-year, I mentioned some “good news” for homebuilders:Even though we can expect significant further declines in new home sales and single-family housing starts, the good news for the homebuilders is activity usually picks up quickly following an interest rate induced slowdown (as opposed to following the housing bust when the recovery took many years).Here is a graph to illustrate this point. The following graph shows new home sales for three periods: 1978-1982, 2005-2020, and current (red). The prior peak in sales is set to 100.
When the Fed took their foot off the brake in 1982, new home sales recovered fairly quickly (blue). The same is true for the 1989 -1991 bust (not shown).
However, following the housing bubble, new home sales languished for several years - well after the Fed reduced the Fed Funds rate to zero - due to all the distressed sales on the housing market.
Housing October 17th Weekly Update: Inventory Increased, New High for 2022
by Calculated Risk on 10/17/2022 08:46:00 AM
 Click on graph for larger image.
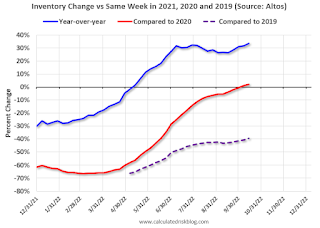
This inventory graph is courtesy of Altos Research.
1. The seasonal bottom (happened on March 4, 2022, for Altos) ✅
2. Inventory up year-over-year (happened on May 20, 2022, for Altos) ✅
3. Inventory up compared to 2020 (happened on October 7, 2022, for Altos) ✅
4. Inventory up compared to 2019 (currently down 39.5%).
Four High Frequency Indicators for the Economy
by Calculated Risk on 10/17/2022 08:25:00 AM
These indicators are mostly for travel and entertainment. It is interesting to watch these sectors recover as the pandemic subsides.
The TSA is providing daily travel numbers.
This data is as of October 15th.
 Click on graph for larger image.
This data shows the 7-day average of daily total traveler throughput from the TSA for 2019 (Light Blue), 2020 (Black), 2021 (Blue) and 2022 (Red).
The dashed line is the percent of 2019 for the seven-day average.
The 7-day average is down 6.9% from the same day in 2019 (93.1% of 2019). (Dashed line)
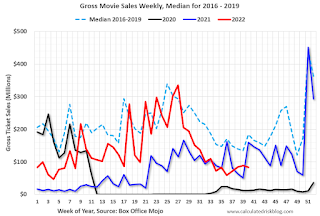
 This data shows domestic box office for each week and the median for the years 2016 through 2019 (dashed light blue).
 Note that the data is usually noisy week-to-week and depends on when blockbusters are released.
Movie ticket sales were at $83 million last week, down about 55% from the median for the week.
 This graph shows the seasonal pattern for the hotel occupancy rate using the four-week average.
 The red line is for 2022, black is 2020, blue is the median, and dashed light blue is for 2021. Dashed purple is 2019 (STR is comparing to a strong year for hotels).
This data is through Oct 8th. The occupancy rate was down 3.5% compared to the same week in 2019.
Notes: Y-axis doesn't start at zero to better show the seasonal change.
Blue is for 2020. Purple is for 2021, and Red is for 2022.
As of October 7th, gasoline supplied was down 12.5% compared to the same week in 2019.
Recently gasoline supplied has been running below 2019 and 2021 levels - and sometimes below 2020.
Sunday, October 16, 2022
Sunday Night Futures
by Calculated Risk on 10/16/2022 07:13:00 PM
Weekend:
• Schedule for Week of October 16, 2022
Monday:
• At 8:30 AM ET, The New York Fed Empire State manufacturing survey for October. The consensus is for a reading of -4.0, down from -1.5.
From CNBC: Pre-Market Data and Bloomberg futures S&P 500 are up 15 and DOW futures are up 110 (fair value).
Oil prices were down over the last week with WTI futures at $86.18 per barrel and Brent at $92.32 per barrel. A year ago, WTI was at $82, and Brent was at $852 - so WTI oil prices are up 5% year-over-year.
Here is a graph from Gasbuddy.com for nationwide gasoline prices. Nationally prices are at $3.86 per gallon. A year ago, prices were at $3.30 per gallon, so gasoline prices are up $0.56 per gallon year-over-year.


