by Calculated Risk on 10/20/2022 10:10:00 AM
Thursday, October 20, 2022
NAR: Existing-Home Sales Decreased to 4.71 million SAAR in September
From the NAR: Existing-Home Sales Decreased 1.5% in September
Existing-home sales descended in September, the eighth month in a row of declines, according to the National Association of REALTORS®. Three out of the four major U.S. regions notched month-over-month sales contractions, while the West held steady. On a year-over-year basis, sales dropped in all regions.
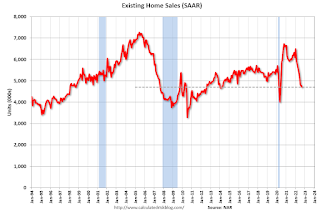
Total existing-home sales, completed transactions that include single-family homes, townhomes, condominiums and co-ops, retracted 1.5% from August to a seasonally adjusted annual rate of 4.71 million in September. Year-over-year, sales waned by 23.8% (down from 6.18 million in September 2021).
...
Total housing inventory registered at the end of September was 1.25 million units, which was down 2.3% from August and 0.8% from the previous year. Unsold inventory sits at a 3.2-month supply at the current sales pace – unchanged from August and up from 2.4 months in September 2021.
emphasis added
 Click on graph for larger image.
This graph shows existing home sales, on a Seasonally Adjusted Annual Rate (SAAR) basis since 1993.
Sales in September (4.71 million SAAR) were down 1.5% from the previous month and were 23.8% below the September 2021 sales rate.
The second graph shows nationwide inventory for existing homes.
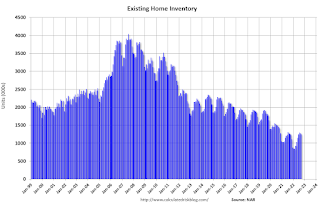 According to the NAR, inventory decreased to 1.25 million in September from 1.28 million in August.
The last graph shows the year-over-year (YoY) change in reported existing home inventory and months-of-supply. Since inventory is not seasonally adjusted, it really helps to look at the YoY change. Note: Months-of-supply is based on the seasonally adjusted sales and not seasonally adjusted inventory.
 Inventory was essentially unchanged year-over-year (blue) in September compared to September 2021.
 Months of supply (red) was unchanged at 3.2 months in September from 3.2 months in August.
This was close to the consensus forecast. I'll have more later.
Weekly Initial Unemployment Claims decrease to 214,000
by Calculated Risk on 10/20/2022 08:33:00 AM
The DOL reported:
In the week ending October 15, the advance figure for seasonally adjusted initial claims was 214,000, a decrease of 12,000 from the previous week's revised level. The previous week's level was revised down by 2,000 from 228,000 to 226,000. The 4-week moving average was 212,250, an increase of 1,250 from the previous week's revised average. The previous week's average was revised down by 500 from 211,500 to 211,000.The following graph shows the 4-week moving average of weekly claims since 1971.
emphasis added
 Click on graph for larger image.
The dashed line on the graph is the current 4-week average. The four-week average of weekly unemployment claims increased to 212,250.
The previous week was revised down.
Weekly claims were lower than the consensus forecast.
Wednesday, October 19, 2022
Thursday: Existing Home Sales, Unemployment Claims, Philly Fed Mfg
by Calculated Risk on 10/19/2022 08:40:00 PM

Thursday:
• At 8:30 AM ET, The initial weekly unemployment claims report will be released. The consensus is for an increase to 232 thousand from 228 thousand last week.
• Also at 8:30 AM, the Philly Fed manufacturing survey for October. The consensus is for a reading of -4.5, up from -9.9.
• At 10:00 AM, Existing Home Sales for September from the National Association of Realtors (NAR). The consensus is for 4.69 million SAAR, down from 4.80 million in August. Housing economist Tom Lawler expects the NAR to report sales of 4.82 million SAAR.
LA Port Traffic Declined in September
by Calculated Risk on 10/19/2022 04:17:00 PM
Notes: The expansion to the Panama Canal was completed in 2016 (As I noted a few years ago), and some of the traffic that used the ports of Los Angeles and Long Beach is probably going through the canal. This might be impacting TEUs on the West Coast.
Container traffic gives us an idea about the volume of goods being exported and imported - and usually some hints about the trade report since LA area ports handle about 40% of the nation's container port traffic.
The following graphs are for inbound and outbound traffic at the ports of Los Angeles and Long Beach in TEUs (TEUs: 20-foot equivalent units or 20-foot-long cargo container).
To remove the strong seasonal component for inbound traffic, the first graph shows the rolling 12-month average.

On a rolling 12-month basis, inbound traffic decreased 1.5% in September compared to the rolling 12 months ending in August. Outbound traffic increased 0.2% compared to the rolling 12 months ending the previous month.
The 2nd graph is the monthly data (with a strong seasonal pattern for imports).

Fed's Beige Book: "Rising mortgage rates and elevated house prices further weakened single-family starts and sales"
by Calculated Risk on 10/19/2022 02:09:00 PM
Fed's Beige Book "This report was prepared at the Federal Reserve Bank of Dallas based on information collected on or before October 7, 2022."
National economic activity expanded modestly on net since the previous report; however, conditions varied across industries and Districts. Four Districts noted flat activity and two cited declines, with slowing or weak demand attributed to higher interest rates, inflation, and supply disruptions. Retail spending was relatively flat, reflecting lower discretionary spending, and auto dealers noted sustained sluggishness in sales stemming from limited inventories, high vehicle prices, and rising interest rates. Travel and tourist activity rose strongly, boosted by continued strength in leisure activity and a pickup in business travel. Manufacturing activity held steady or expanded in most Districts in part due to easing in supply chain disruptions, though there were a few reports of output declines. Demand for nonfinancial services rose. Activity in transportation services was mixed, as port activity increased strongly whereas reports of trucking and freight demand were mixed. Rising mortgage rates and elevated house prices further weakened single-family starts and sales, but helped buoy apartment leasing and rents, which generally remained high. Commercial real estate slowed in both construction and sales amid supply shortages and elevated construction and borrowing costs, and there were scattered reports of declining property prices. Industrial leasing remained robust, while office demand was tepid. Bankers in most reporting Districts cited declines in loan volumes, partly a result of shrinking residential real estate lending. Energy activity expanded moderately, whereas agriculture reports were mixed, as drought conditions and high input costs remained a challenge. Outlooks grew more pessimistic amidst growing concerns about weakening demand.
Employment continued to rise at a modest to moderate pace in most Districts. Several Districts reported a cooling in labor demand, with some noting that businesses were hesitant to add to payrolls amid increased concerns of an economic downturn. There were also scattered mentions of hiring freezes. Overall labor market conditions remained tight, though half of Districts noted some easing of hiring and/or retention difficulties.
emphasis added
AIA: Architecture Billings Index "Moderates but remains healthy" in September
by Calculated Risk on 10/19/2022 12:09:00 PM
Note: This index is a leading indicator primarily for new Commercial Real Estate (CRE) investment.
From the AIA: Architecture Billings Index moderates but remains healthy
For the twentieth consecutive month architecture firms reported increasing demand for design services in September, according to a new report today from The American Institute of Architects (AIA).
The AIA Architecture Billings Index (ABI) score for September was 51.7 down from a score of 53.3 in August, indicating essentially stable business conditions for architecture firms (any score above 50 indicates an increase in billings from the prior month). Also in September, both the new project inquiries and design contracts indexes moderated from August but remained positive with scores of 53.6 and 50.7, respectively.
“While billings in the Northeast region and the Institutional sector reached their highest pace of growth in several years, there appears to be emerging weakness in the previously healthy multifamily residential and commercial/industrial sectors, both of which saw a decline in billings for the first time since the post-pandemic recovery began,” said AIA Chief Economist, Kermit Baker, Hon. AIA, PhD. “Across the broader architecture sector, backlogs at firms remained at a robust 7.0 months as of the end of September, still near record-high levels since we began collecting this data regularly more than a decade ago.”
...
• Regional averages: Northeast (54.6); Midwest (52.1); South (51.7); West (51.6)
• Sector index breakdown: institutional (58.9); mixed practice (50.3); commercial/industrial (49.6); multi-family residential (47.9)
emphasis added
 Click on graph for larger image.
This graph shows the Architecture Billings Index since 1996. The index was at 51.7 in September, down from 53.3 in August. Anything above 50 indicates expansion in demand for architects' services.
Note: This includes commercial and industrial facilities like hotels and office buildings, multi-family residential, as well as schools, hospitals and other institutions.
This index has been positive for 20 consecutive months. This index usually leads CRE investment by 9 to 12 months, so this index suggests a pickup in CRE investment into 2023.
September Housing Starts: Record Number of Housing Units Under Construction
by Calculated Risk on 10/19/2022 09:02:00 AM
Today, in the CalculatedRisk Real Estate Newsletter: September Housing Starts: Record Number of Housing Units Under Construction
Excerpt:
The fourth graph shows housing starts under construction, Seasonally Adjusted (SA).There is much more in the post. You can subscribe at https://calculatedrisk.substack.com/ (Most content is available for free, so please subscribe).
Red is single family units. Currently there are 800 thousand single family units (red) under construction (SA). This is below the previous six months, and 28 thousand below the peak in April and May. Single family units under construction have peaked since single family starts are now declining. The reason there are so many homes under construction is probably due to supply constraints.
Blue is for 2+ units. Currently there are 910 thousand multi-family units under construction. This is the highest level since February 1974! For multi-family, construction delays are probably also a factor. The completion of these units should help with rent pressure.
Combined, there are 1.710 million units under construction. This is the all-time record number of units under construction.
Housing Starts Decreased to 1.439 million Annual Rate in September
by Calculated Risk on 10/19/2022 08:36:00 AM
From the Census Bureau: Permits, Starts and Completions
Housing Starts:
Privately‐owned housing starts in September were at a seasonally adjusted annual rate of 1,439,000. This is 8.1 percent below the revised August estimate of 1,566,000 and is 7.7 percent below the September 2021 rate of 1,559,000. Single‐family housing starts in September were at a rate of 892,000; this is 4.7 percent below the revised August figure of 936,000. The September rate for units in buildings with five units or more was 530,000
Building Permits:
Privately‐owned housing units authorized by building permits in September were at a seasonally adjusted annual rate of 1,564,000. This is 1.4 percent above the revised August rate of 1,542,000, but is 3.2 percent below the September 2021 rate of 1,615,000. Single‐family authorizations in September were at a rate of 872,000; this is 3.1 percent below the revised August figure of 900,000. Authorizations of units in buildings with five units or more were at a rate of 644,000 in September.
emphasis added
 Click on graph for larger image.
The first graph shows single and multi-family housing starts for the last several years.
Multi-family starts (blue, 2+ units) decreased in September compared to August. Multi-family starts were up 18.5% year-over-year in September.
Single-family starts (red) decreased in September and were down 14.6% year-over-year.
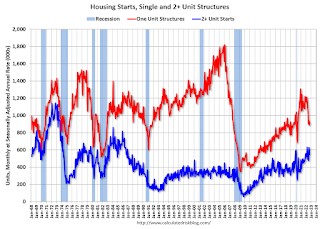 The second graph shows single and multi-family housing starts since 1968.
 This shows the huge collapse following the housing bubble, and then the eventual recovery.
Total housing starts in September were below expectations, and starts in July and August were revised down, combined.
I'll have more later …
MBA: Mortgage Applications Decrease in Latest Weekly Survey; Lowest Level Since 1997
by Calculated Risk on 10/19/2022 07:00:00 AM
From the MBA: Mortgage Applications Decrease in Latest MBA Weekly Survey
Mortgage applications decreased 4.5 percent from one week earlier, according to data from the Mortgage Bankers Association’s (MBA) Weekly Mortgage Applications Survey for the week ending October 14, 2022.
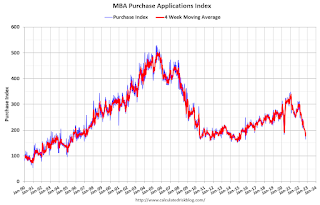
... The Refinance Index decreased 7 percent from the previous week and was 86 percent lower than the same week one year ago. The seasonally adjusted Purchase Index decreased 4 percent from one week earlier. The unadjusted Purchase Index decreased 3 percent compared with the previous week and was 38 percent lower than the same week one year ago.
“Mortgage applications are now into their fourth month of declines, dropping to the lowest level since 1997, as the 30-year fixed mortgage rate hit 6.94 percent – the highest level since 2002,” said Joel Kan, MBA’s Vice President and Deputy Chief Economist. “The speed and level to which rates have climbed this year have greatly reduced refinance activity and exacerbated existing affordability challenges in the purchase market. Residential housing activity ranging from new housing starts to home sales have been on downward trends coinciding with the rise in rates. The current 30-year fixed rate is now well over three percentage points higher than a year ago, and both purchase and refinance applications were down 38 percent and 86 percent over the year, respectively.”
Added Kan: “With rates at these high levels, the ARM share rose to 12.8 percent of all applications, which was the highest share since March 2008. ARM loans continue to remain a viable option for borrowers who are still trying to find ways to reduce their monthly payments.
...
The average contract interest rate for 30-year fixed-rate mortgages with conforming loan balances ($647,200 or less) increased to 6.94 percent from 6.81 percent, with points decreasing to 0.95 from 0.97 (including the origination fee) for 80 percent loan-to-value ratio (LTV) loans.
emphasis added
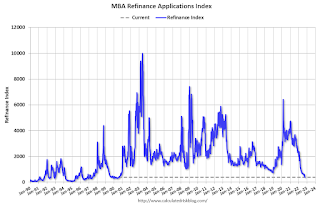 Click on graph for larger image.
The first graph shows the refinance index since 1990.
Note: Red is a four-week average (blue is weekly).
Tuesday, October 18, 2022
Wednesday: Housing Starts, Beige Book
by Calculated Risk on 10/18/2022 08:51:00 PM

For traders who believe the Fed's restrictive policies will eventually drive growth and inflation lower, it's hard to make a case for longer-term yields going much above 4%, even with core inflation over 6%. If you ask traders, the actual outlook for inflation over the next 10 years is close to the Fed's target range. ... [30 year fixed 7.15%]Wednesday:
emphasis added
• At 7:00 AM ET, The Mortgage Bankers Association (MBA) will release the results for the mortgage purchase applications index.
• At 8:30 AM, Housing Starts for September. The consensus is for 1.478 million SAAR, down from 1.575 million SAAR.
• During the day, The AIA's Architecture Billings Index for September (a leading indicator for commercial real estate).
• At 2:00 PM, the Federal Reserve Beige Book, an informal review by the Federal Reserve Banks of current economic conditions in their Districts.

