by Calculated Risk on 10/27/2022 08:34:00 AM
Thursday, October 27, 2022
BEA: Real GDP increased at 2.6% Annualized Rate in Q3
From the BEA: Gross Domestic Product, Third Quarter 2022 (Advance Estimate)
Real gross domestic product (GDP) increased at an annual rate of 2.6 percent in the third quarter of 2022, according to the "advance" estimate released by the Bureau of Economic Analysis. In the second quarter, real GDP decreased 0.6 percent. ...PCE increased at a 1.4% rate, and residential investment decreased at a 26.4% rate. The advance Q3 GDP report, with 2.6% annualized increase, was above expectations.
The increase in real GDP reflected increases in exports, consumer spending, nonresidential fixed investment, federal government spending, and state and local government spending, that were partly offset by decreases in residential fixed investment and private inventory investment. Imports, which are a subtraction in the calculation of GDP, decreased.
The increase in exports reflected increases in both goods and services. Within exports of goods, the leading contributors to the increase were industrial supplies and materials (notably petroleum and products as well as other nondurable goods), and nonautomotive capital goods. Within exports of services, the increase was led by travel and "other" business services (mainly financial services). Within consumer spending, an increase in services (led by health care and "other" services) was partly offset by a decrease in goods (led by motor vehicles and parts as well as food and beverages). Within nonresidential fixed investment, increases in equipment and intellectual property products were partly offset by a decrease in structures. The increase in federal government spending was led by defense spending. The increase in state and local government spending primarily reflected an increase in compensation of state and local government employees.
Within residential fixed investment, the leading contributors to the decrease were new single-family construction and brokers' commissions. The decrease in private inventory investment primarily reflected a decrease in retail trade (led by "other" retailers). Within imports, a decrease in imports of goods (notably consumer goods) was partly offset by an increase in imports of services (mainly travel).
Real GDP turned up in the third quarter, increasing 2.6 percent after decreasing 0.6 percent in the second quarter. The upturn primarily reflected a smaller decrease in private inventory investment, an acceleration in nonresidential fixed investment, and an upturn in federal government spending that were partly offset by a larger decrease in residential fixed investment and a deceleration in consumer spending. Imports turned down.
emphasis added
I'll have more later ...
Wednesday, October 26, 2022
Thursday: GDP, Unemployment Claims, Durable Goods
by Calculated Risk on 10/26/2022 08:29:00 PM
On Q3 GDP from Goldman: "The September new home sales and inventory data were slightly better than our previous assumptions on net, and we boosted our Q3 GDP tracking estimate by one tenth to +2.5% (qoq ar) ahead of tomorrow’s report."
From BofA: "The trade and inventory data lowered our 3Q GDP tracking estimate from 2.5% q/q saar to 2.0% q/q saar."

Thursday:
• At 8:30 AM ET, the initial weekly unemployment claims report will be released. The consensus is for an increase to 225 thousand from 214 thousand last week.
• Also, at 8:30 AM, Gross Domestic Product, 3rd quarter 2022 (advance estimate). The consensus is that real GDP increased 2.4% annualized in Q3, up from -0.6% in Q2.
• Also, at 8:30 AM, Durable Goods Orders for September from the Census Bureau. The consensus is for a 0.5% increase in durable goods orders.
• At 11:00 AM: Kansas City Fed Survey of Manufacturing Activity for October.
Philly Fed: State Coincident Indexes Increased in 38 States in September
by Calculated Risk on 10/26/2022 01:48:00 PM
From the Philly Fed:
The Federal Reserve Bank of Philadelphia has released the coincident indexes for the 50 states for September 2022. Over the past three months, the indexes increased in 44 states, decreased in four states, and remained stable in two, for a three-month diffusion index of 80. Additionally, in the past month, the indexes increased in 38 states, decreased in 10 states, and remained stable in two, for a one-month diffusion index of 56. For comparison purposes, the Philadelphia Fed has also developed a similar coincident index for the entire United States. The Philadelphia Fed’s U.S. index increased 1.0 percent over the past three months and 0.4 percent in September.Note: These are coincident indexes constructed from state employment data. An explanation from the Philly Fed:
emphasis added
The coincident indexes combine four state-level indicators to summarize current economic conditions in a single statistic. The four state-level variables in each coincident index are nonfarm payroll employment, average hours worked in manufacturing by production workers, the unemployment rate, and wage and salary disbursements deflated by the consumer price index (U.S. city average). The trend for each state’s index is set to the trend of its gross domestic product (GDP), so long-term growth in the state’s index matches long-term growth in its GDP.
 Click on map for larger image.
Here is a map of the three-month change in the Philly Fed state coincident indicators. This map was all red during the worst of the Pandemic and also at the worst of the Great Recession.
The map is mostly positive on a three-month basis.
Source: Philly Fed.
 And here is a graph is of the number of states with one month increasing activity according to the Philly Fed.
 In September 39 states had increasing activity including minor increases.
New Home Sales Decreased in September; Completed Inventory Increased
by Calculated Risk on 10/26/2022 10:52:00 AM
Today, in the Calculated Risk Real Estate Newsletter: New Home Sales Decreased in September; Completed Inventory Increased
Brief excerpt:
The next graph shows the months of supply by stage of construction. “Months of supply” is inventory at each stage, divided by the sales rate.You can subscribe at https://calculatedrisk.substack.com/.
There are 1.1 months of completed supply (red line). This is about two-thirds of the normal level.
The inventory of new homes under construction is at 6.0 months (blue line). This elevated level of homes under construction is due to supply chain constraints.
And a record 105 thousand homes have not been started - about 2.1 months of supply (grey line) - about double the normal level. Homebuilders are probably waiting to start some homes until they have a firmer grasp on prices and demand.
...
First, as I discussed last month, the Census Bureau overestimates sales, and underestimates inventory when cancellation rates are rising, see: New Home Sales and Cancellations: Net vs Gross Sales. So, take the headline sales number with a large grain of salt - the actual negative impact on the homebuilders is greater than the headline number suggests!
...
There are a large number of homes under construction, and this suggests we will see a sharp increase in completed inventory over the next several months - and that will put pressure on new home prices.
New Home Sales Decrease to 603,000 Annual Rate in September
by Calculated Risk on 10/26/2022 10:09:00 AM
The Census Bureau reports New Home Sales in September were at a seasonally adjusted annual rate (SAAR) of 603 thousand.
The previous three months were revised down, combined.
Sales of new single‐family houses in September 2022 were at a seasonally adjusted annual rate of 603,000, according to estimates released jointly today by the U.S. Census Bureau and the Department of Housing and Urban Development. This is 10.9 percent below the revised August rate of 677,000 and is 17.6 percent below the September 2021 estimate of 732,000.
emphasis added
 Click on graph for larger image.
The first graph shows New Home Sales vs. recessions since 1963. The dashed line is the current sales rate.
New home sales are below pre-pandemic levels.
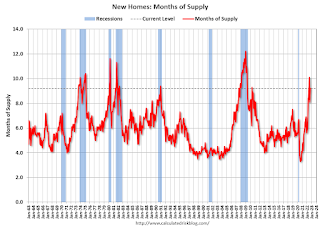
The second graph shows New Home Months of Supply.
 The months of supply increased in September to 9.2 months from 8.1 months in August.
 The all-time record high was 12.1 months of supply in January 2009. The all-time record low was 3.5 months, most recently in October 2020.
This is well above the top of the normal range (about 4 to 6 months of supply is normal).
"The seasonally‐adjusted estimate of new houses for sale at the end of September was 462,000. This represents a supply of 9.2 months at the current sales rate."
 The last graph shows sales NSA (monthly sales, not seasonally adjusted annual rate).
In September 2022 (red column), 49 thousand new homes were sold (NSA). Last year, 58 thousand homes were sold in September.
The all-time high for September was 99 thousand in 2005, and the all-time low for September was 24 thousand in 2011.
This was slightly above expectations, however sales in the three previous months were revised down, combined. I'll have more later today.
MBA: Mortgage Applications Decrease in Latest Weekly Survey; Lowest Level Since 1997
by Calculated Risk on 10/26/2022 07:00:00 AM
From the MBA: Mortgage Applications Decrease in Latest MBA Weekly Survey
Mortgage applications decreased 1.7 percent from one week earlier, according to data from the Mortgage Bankers Association’s (MBA) Weekly Mortgage Applications Survey for the week ending October 21, 2022.
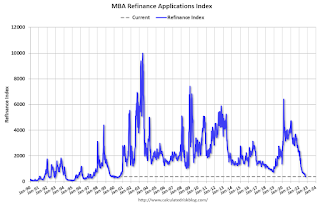
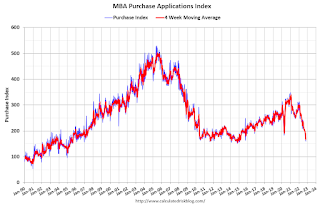
... The Refinance Index increased 0.1 percent from the previous week and was 86 percent lower than the same week one year ago. The seasonally adjusted Purchase Index decreased 2 percent from one week earlier. The unadjusted Purchase Index decreased 3 percent compared with the previous week and was 42 percent lower than the same week one year ago.
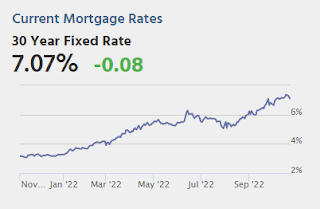
“Mortgage rates increased for the 10th consecutive week, with the 30-year fixed rate reaching 7.16 percent, the highest rate since 2001. The ongoing trend of rising mortgage rates continues to depress mortgage application activity, which remained at its slowest pace since 1997,” said Joel Kan, MBA’s Vice President and Deputy Chief Economist. “Refinance applications were ess entially unchanged, but purchase applications declined 2 percent to the slowest pace since 2015 – over 40 percent behind last year’s pace. Despite higher rates and lower overall application activity, there was a slight increase in FHA purchase applications, as FHA rates remained lower than conventional loan rates.”
Added Kan, “MBA’s forecast expects both economic and housing market weakness in 2023 to drive a 3 percent decline in purchase originations, while refinance volume is anticipated to decline by 24 percent.
...
The average contract interest rate for 30-year fixed-rate mortgages with conforming loan balances ($647,200 or less) increased to 7.16 percent from 6.94 percent, with points decreasing to 0.88 from 0.95 (including the origination fee) for 80 percent loan-to-value ratio (LTV) loans.
emphasis added
 Click on graph for larger image.
The first graph shows the refinance index since 1990.
Note: Red is a four-week average (blue is weekly).
Tuesday, October 25, 2022
Wednesday: New Home Sales
by Calculated Risk on 10/25/2022 09:01:00 PM

Wednesday:
• At 7:00 AM ET, The Mortgage Bankers Association (MBA) will release the results for the mortgage purchase applications index.
• At 10:00 AM, New Home Sales for September from the Census Bureau. The consensus is for 590 thousand SAAR, down from 685 thousand in August.
Freddie Mac: Mortgage Serious Delinquency Rate decreased in September
by Calculated Risk on 10/25/2022 04:42:00 PM
Freddie Mac reported that the Single-Family serious delinquency rate in September was 0.67%, down from 0.70% August. Freddie's rate is down year-over-year from 1.46% in September 2021.
Freddie's serious delinquency rate peaked in February 2010 at 4.20% following the housing bubble and peaked at 3.17% in August 2020 during the pandemic.
These are mortgage loans that are "three monthly payments or more past due or in foreclosure".

Mortgages in forbearance are being counted as delinquent in this monthly report but are not reported to the credit bureaus.
Lawler: Update on the Household “Conundrum”
by Calculated Risk on 10/25/2022 02:25:00 PM
Today, in the Real Estate Newsletter: Lawler: Update on the Household “Conundrum”
Excerpt:
This is from housing economist Tom Lawler:There is much more in the article. You can subscribe at https://calculatedrisk.substack.com/
The pandemic wreaked havoc on some of the government surveys designed to measure the number of and characteristics of US households (though there were measurement issues before the pandemic), making it difficult for analysts how much of the extraordinary strength in the housing market during 2021 and early 2022 was related to “demographics” as opposed to behavioral and preference changes. (Here is the November 2021 piece on this issue). Nevertheless, it may still be useful to see what these reports are showing.
...
What is striking about the estimated household gain is that it is significantly above – in fact, about double -- what one would have projected if one had assumed that so-called “headship rates” in each age group (the number of householders in an age group divided by the total population of that age group) had remained the same over this period. Moreover, headship rate increases were concentrated in the 15–34-year-old categories.
If in fact over the 12-month period ending March of this year the number of households increased by almost two million, then household growth significantly outpaced housing production, as total housing completions plus manufactured housing shipments totaled only about 1.44 million.
In terms of household growth, there are several reasons to expect that household growth has slowed sharply since the beginning of this year ...
...
If in fact this dynamic shift between household growth and housing production is taking place, then it, combined with (1) the unprecedented increase in housing prices over a 2-year period from mid-2020 to mid-2022, and (2) the unprecedented surge in mortgage rates this year, would suggest that a non-trivial decline in home prices from the middle of this year to at least the middle of next year would be a logical “base case.” This shift, combined with (1) the unprecedented increase in rents from late 2020 to the middle of this year and (2) the significant increase in rental units coming to market over the next year, suggest not only that rent growth should soon decelerate sharply (in fact, some indicators suggest that it already has), but that an actual decline in rents next year would be a reasonable base case.
Comments on August Case-Shiller and FHFA House Prices
by Calculated Risk on 10/25/2022 10:02:00 AM
Today, in the Calculated Risk Real Estate Newsletter: Case-Shiller: National House Price Index "Continued to Decelerate" to 13.0% year-over-year increase in August
Excerpt:
Both the Case-Shiller House Price Index (HPI) and the Federal Housing Finance Agency (FHFA) HPI for August were released today. Here is a graph of the month-over-month (MoM) change in the Case-Shiller National Index Seasonally Adjusted (SA).
The Case-Shiller Home Price Indices for “August” is a 3-month average of June, July and August closing prices. June closing prices include some contracts signed in April, so there is a significant lag to this data.
The MoM decrease in Case-Shiller was at -0.86% seasonally adjusted. This was the second consecutive MoM decrease, and the largest MoM since February 2010. Since this includes closings in June and July, this suggests prices fell sharply for August closings.
On a seasonally adjusted basis, prices declined in all of the Case-Shiller cities on a month-to-month basis. The largest monthly declines seasonally adjusted were in San Francisco (-3.7%), Seattle (-2.9%), and San Diego (-2.5%). San Francisco has fallen 8.2% from the peak in May 2022.
...
The August Case-Shiller report is mostly for contracts signed in the April through July period when 30-year mortgage rates were in the low-to-mid 5% range. The September report will mostly be for contracts signed in the May through August period - when rates were also in the low-to-mid 5% range.
The impact from higher rates in September and October will not show up for several more months.


