by Calculated Risk on 10/27/2022 08:59:00 PM
Thursday, October 27, 2022
Friday: Personal Income and Outlays, Pending Home Sales

Friday:
• At 8:30 AM ET, Personal Income and Outlays for September. The consensus is for a 0.3% increase in personal income, and for a 0.4% increase in personal spending. And for the Core PCE price index to increase 0.5%. PCE prices are expected to be up 6.2% YoY, and core PCE prices up 5.2% YoY.
• At 10:00 AM, Pending Home Sales Index for September. The consensus is 5.0% decrease in the index.
• Also at 10:00 AM, University of Michigan's Consumer sentiment index (Final for October). The consensus is for a reading of 59.8.
Las Vegas September 2022: Visitor Traffic Down Just 3.5% Compared to 2019
by Calculated Risk on 10/27/2022 02:25:00 PM
Note: I like using Las Vegas as a measure of recovery for both leisure (visitors) and business (conventions).
From the Las Vegas Visitor Authority: August 2022 Las Vegas Visitor Statistics
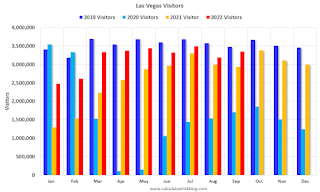
September saw strong visitation of 3.35M visitors, just ‐3.5% behind September 2019, with notable weekend holidays and events from Labor Day to the Life Is Beautiful festival, the Canelo/GGG fight, Mexican Independence Day, the Raiders/Cardinals home game, Bad Bunny World's Hottest Tour and the iHeartRadio Music festival.
Overall hotel occupancy reached 83.1%, +10.1 pts ahead of last September but down ‐5.2 pts vs. September 2019. Weekend occupancy reached 92.1% (up +3.0 pts YoY but down ‐3.5 pts vs. September 2019), while Midweek occupancy reached 78.6% (up +12.5 pts YoY but down ‐6.5 pts vs. September 2019).
Strong weekend demand supported by major events translated to record monthly ADR levels as September ADR approached $187, +20.1% YoY and +36.5% ahead of September 2019 while RevPAR neared $156 for the month, +36.8% YoY and +28.5% over September 2019
 Click on graph for larger image.
 The first graph shows visitor traffic for 2019 (dark blue), 2020 (light blue), 2021 (yellow) and 2022 (red)
Visitor traffic was down 3.5% compared to the same month in 2019.
Note: There was almost no convention traffic from April 2020 through May 2021.
Realtor.com Reports Weekly Active Inventory Up 36% Year-over-year; New Listings Down 13%
by Calculated Risk on 10/27/2022 12:33:00 PM
Realtor.com has monthly and weekly data on the existing home market. Here is their weekly report released today from Chief Economist Danielle Hale: Weekly Housing Trends View — Data Week Ending Oct 22, 2022. Note: They have data on list prices, new listings and more, but this focus is on inventory.
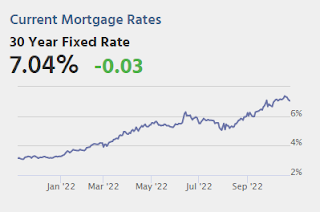
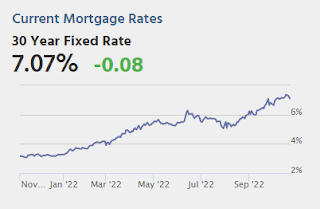
• Active inventory continued to grow, increasing 36% above one year ago. In last week’s Housing Trends View, which marked the first big increase in the active inventory trend since July, we gave a helpful summary of the historical context and timing of recent inventory developments. This week we saw another sizable step up in the active inventory trend (from 34% last week to 36% this week), even as new listings remain low, and the driving factor is the same: climbing mortgage rates, which were very near 7% last week and are likely to top that mark this week.
...
• New listings–a measure of sellers putting homes up for sale–were again down, dropping 13% from one year ago. This week marks the sixteenth straight week of year over year declines in the number of new listings coming up for sale. This week’s decline was somewhat smaller than last week’s, but still means fewer fresh options for home shoppers in the market. Seasonally, fewer homeowners contemplate a home sale as the temperature cools and the holidays approach, but this kind of change in the year over year trend signals a cooling that’s more than just seasonal.
 Here is a graph of the year-over-year change in inventory according to realtor.com.
 Note the rapid increase in the YoY change earlier this year, from down 30% at the beginning of the year, to up 29% YoY at the beginning of July.
Inflation Adjusted House Prices 2.3% Below Peak
by Calculated Risk on 10/27/2022 10:12:00 AM
Today, in the Calculated Risk Real Estate Newsletter: Inflation Adjusted House Prices 2.3% Below Peak
Excerpt:
It has been over 16 years since the bubble peak. In the Case-Shiller release Tuesday, the seasonally adjusted National Index (SA), was reported as being 64% above the bubble peak in 2006. However, in real terms, the National index (SA) is about 13% above the bubble peak (and historically there has been an upward slope to real house prices). The composite 20, in real terms, is about 4% above the bubble peak.
Both indexes have declined for three consecutive months in real terms (inflation adjusted).
People usually graph nominal house prices, but it is also important to look at prices in real terms. As an example, if a house price was $200,000 in January 2000, the price would be almost $338,000 today adjusted for inflation (69% increase). That is why the second graph below is important - this shows "real" prices. ...
The second graph shows the same two indexes in real terms (adjusted for inflation using CPI less Shelter). Note: some people use other inflation measures to adjust for real prices. In real terms, the National index is 2.3% below the recent peak, and the Composite 20 index is 3.0% below the recent peak in early 2006.
In real terms, house prices are still above the bubble peak levels. There is an upward slope to real house prices, and it has been over 16 years since the previous peak, but real prices are historically high.
Weekly Initial Unemployment Claims increase to 217,000
by Calculated Risk on 10/27/2022 08:39:00 AM
The DOL reported:
In the week ending October 22, the advance figure for seasonally adjusted initial claims was 217,000, an increase of 3,000 from the previous week's unrevised level of 214,000. The 4-week moving average was 219,000, an increase of 6,750 from the previous week's unrevised average of 212,250.The following graph shows the 4-week moving average of weekly claims since 1971.
emphasis added
 Click on graph for larger image.
The dashed line on the graph is the current 4-week average. The four-week average of weekly unemployment claims increased to 219,000.
The previous week was unrevised.
Weekly claims were lower than the consensus forecast.
BEA: Real GDP increased at 2.6% Annualized Rate in Q3
by Calculated Risk on 10/27/2022 08:34:00 AM
From the BEA: Gross Domestic Product, Third Quarter 2022 (Advance Estimate)
Real gross domestic product (GDP) increased at an annual rate of 2.6 percent in the third quarter of 2022, according to the "advance" estimate released by the Bureau of Economic Analysis. In the second quarter, real GDP decreased 0.6 percent. ...PCE increased at a 1.4% rate, and residential investment decreased at a 26.4% rate. The advance Q3 GDP report, with 2.6% annualized increase, was above expectations.
The increase in real GDP reflected increases in exports, consumer spending, nonresidential fixed investment, federal government spending, and state and local government spending, that were partly offset by decreases in residential fixed investment and private inventory investment. Imports, which are a subtraction in the calculation of GDP, decreased.
The increase in exports reflected increases in both goods and services. Within exports of goods, the leading contributors to the increase were industrial supplies and materials (notably petroleum and products as well as other nondurable goods), and nonautomotive capital goods. Within exports of services, the increase was led by travel and "other" business services (mainly financial services). Within consumer spending, an increase in services (led by health care and "other" services) was partly offset by a decrease in goods (led by motor vehicles and parts as well as food and beverages). Within nonresidential fixed investment, increases in equipment and intellectual property products were partly offset by a decrease in structures. The increase in federal government spending was led by defense spending. The increase in state and local government spending primarily reflected an increase in compensation of state and local government employees.
Within residential fixed investment, the leading contributors to the decrease were new single-family construction and brokers' commissions. The decrease in private inventory investment primarily reflected a decrease in retail trade (led by "other" retailers). Within imports, a decrease in imports of goods (notably consumer goods) was partly offset by an increase in imports of services (mainly travel).
Real GDP turned up in the third quarter, increasing 2.6 percent after decreasing 0.6 percent in the second quarter. The upturn primarily reflected a smaller decrease in private inventory investment, an acceleration in nonresidential fixed investment, and an upturn in federal government spending that were partly offset by a larger decrease in residential fixed investment and a deceleration in consumer spending. Imports turned down.
emphasis added
I'll have more later ...
Wednesday, October 26, 2022
Thursday: GDP, Unemployment Claims, Durable Goods
by Calculated Risk on 10/26/2022 08:29:00 PM
On Q3 GDP from Goldman: "The September new home sales and inventory data were slightly better than our previous assumptions on net, and we boosted our Q3 GDP tracking estimate by one tenth to +2.5% (qoq ar) ahead of tomorrow’s report."
From BofA: "The trade and inventory data lowered our 3Q GDP tracking estimate from 2.5% q/q saar to 2.0% q/q saar."

Thursday:
• At 8:30 AM ET, the initial weekly unemployment claims report will be released. The consensus is for an increase to 225 thousand from 214 thousand last week.
• Also, at 8:30 AM, Gross Domestic Product, 3rd quarter 2022 (advance estimate). The consensus is that real GDP increased 2.4% annualized in Q3, up from -0.6% in Q2.
• Also, at 8:30 AM, Durable Goods Orders for September from the Census Bureau. The consensus is for a 0.5% increase in durable goods orders.
• At 11:00 AM: Kansas City Fed Survey of Manufacturing Activity for October.
Philly Fed: State Coincident Indexes Increased in 38 States in September
by Calculated Risk on 10/26/2022 01:48:00 PM
From the Philly Fed:
The Federal Reserve Bank of Philadelphia has released the coincident indexes for the 50 states for September 2022. Over the past three months, the indexes increased in 44 states, decreased in four states, and remained stable in two, for a three-month diffusion index of 80. Additionally, in the past month, the indexes increased in 38 states, decreased in 10 states, and remained stable in two, for a one-month diffusion index of 56. For comparison purposes, the Philadelphia Fed has also developed a similar coincident index for the entire United States. The Philadelphia Fed’s U.S. index increased 1.0 percent over the past three months and 0.4 percent in September.Note: These are coincident indexes constructed from state employment data. An explanation from the Philly Fed:
emphasis added
The coincident indexes combine four state-level indicators to summarize current economic conditions in a single statistic. The four state-level variables in each coincident index are nonfarm payroll employment, average hours worked in manufacturing by production workers, the unemployment rate, and wage and salary disbursements deflated by the consumer price index (U.S. city average). The trend for each state’s index is set to the trend of its gross domestic product (GDP), so long-term growth in the state’s index matches long-term growth in its GDP.
 Click on map for larger image.
Here is a map of the three-month change in the Philly Fed state coincident indicators. This map was all red during the worst of the Pandemic and also at the worst of the Great Recession.
The map is mostly positive on a three-month basis.
Source: Philly Fed.
 And here is a graph is of the number of states with one month increasing activity according to the Philly Fed.
 In September 39 states had increasing activity including minor increases.
New Home Sales Decreased in September; Completed Inventory Increased
by Calculated Risk on 10/26/2022 10:52:00 AM
Today, in the Calculated Risk Real Estate Newsletter: New Home Sales Decreased in September; Completed Inventory Increased
Brief excerpt:
The next graph shows the months of supply by stage of construction. “Months of supply” is inventory at each stage, divided by the sales rate.You can subscribe at https://calculatedrisk.substack.com/.
There are 1.1 months of completed supply (red line). This is about two-thirds of the normal level.
The inventory of new homes under construction is at 6.0 months (blue line). This elevated level of homes under construction is due to supply chain constraints.
And a record 105 thousand homes have not been started - about 2.1 months of supply (grey line) - about double the normal level. Homebuilders are probably waiting to start some homes until they have a firmer grasp on prices and demand.
...
First, as I discussed last month, the Census Bureau overestimates sales, and underestimates inventory when cancellation rates are rising, see: New Home Sales and Cancellations: Net vs Gross Sales. So, take the headline sales number with a large grain of salt - the actual negative impact on the homebuilders is greater than the headline number suggests!
...
There are a large number of homes under construction, and this suggests we will see a sharp increase in completed inventory over the next several months - and that will put pressure on new home prices.
New Home Sales Decrease to 603,000 Annual Rate in September
by Calculated Risk on 10/26/2022 10:09:00 AM
The Census Bureau reports New Home Sales in September were at a seasonally adjusted annual rate (SAAR) of 603 thousand.
The previous three months were revised down, combined.
Sales of new single‐family houses in September 2022 were at a seasonally adjusted annual rate of 603,000, according to estimates released jointly today by the U.S. Census Bureau and the Department of Housing and Urban Development. This is 10.9 percent below the revised August rate of 677,000 and is 17.6 percent below the September 2021 estimate of 732,000.
emphasis added
 Click on graph for larger image.
The first graph shows New Home Sales vs. recessions since 1963. The dashed line is the current sales rate.
New home sales are below pre-pandemic levels.
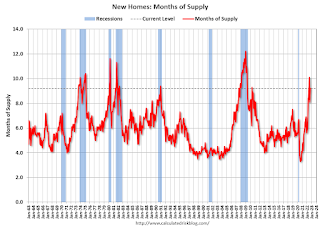
The second graph shows New Home Months of Supply.
 The months of supply increased in September to 9.2 months from 8.1 months in August.
 The all-time record high was 12.1 months of supply in January 2009. The all-time record low was 3.5 months, most recently in October 2020.
This is well above the top of the normal range (about 4 to 6 months of supply is normal).
"The seasonally‐adjusted estimate of new houses for sale at the end of September was 462,000. This represents a supply of 9.2 months at the current sales rate."
 The last graph shows sales NSA (monthly sales, not seasonally adjusted annual rate).
In September 2022 (red column), 49 thousand new homes were sold (NSA). Last year, 58 thousand homes were sold in September.
The all-time high for September was 99 thousand in 2005, and the all-time low for September was 24 thousand in 2011.
This was slightly above expectations, however sales in the three previous months were revised down, combined. I'll have more later today.


