by Calculated Risk on 11/03/2022 12:07:00 PM
Thursday, November 03, 2022
October Employment Preview
On Friday at 8:30 AM ET, the BLS will release the employment report for October. The consensus is for 200,000 jobs added, and for the unemployment rate to increase to 3.6%.
 Click on graph for larger image.
• First, as of September there are 514 thousand more jobs than in February 2020 (the month before the pandemic).
This graph shows the job losses from the start of the employment recession, in percentage terms. As of August 2022, all of the jobs have returned.
This doesn't include the preliminary benchmark revision that showed there were 462 thousand more jobs than originally reported in March 2022.
• ADP Report: The ADP employment report showed 239,000 private sector jobs were added in October. This is the third release of ADP's new methodology, and this suggests job gains somewhat above consensus expectations.
• ISM Surveys: Note that the ISM services are diffusion indexes based on the number of firms hiring (not the number of hires). The ISM® manufacturing employment index increased in October to 50.0%, down from 48.7% last month. This would suggest 20,000 jobs lost in manufacturing.
The ISM® services employment index decreased in October to 49.1%, down from 53.0% last month. This would suggest service employment increased 40,000 in October.
Combined, the ISM surveys suggest 20,000 jobs added in October (way below the consensus forecast).
• Unemployment Claims: The weekly claims report showed a slight increase in the number of initial unemployment claims during the reference week (includes the 12th of the month) from 209,000 in September to 214,000 in October. This would usually suggest above the same number of layoffs in October as in September. In general, weekly claims were lower than expectations in October.
ISM® Services Index Decreased to 54.4% in October
by Calculated Risk on 11/03/2022 10:14:00 AM
(Posted with permission). The ISM® Services index was at 54.4%, down from 56.7% last month. The employment index decreased to 49.1%, from 53.0%. Note: Above 50 indicates expansion, below 50 in contraction.
From the Institute for Supply Management: Services PMI® at 54.4% October 2022 Services ISM® Report On Business®
Economic activity in the services sector grew in October for the 29th month in a row — with the Services PMI® registering 54.4 percent — say the nation's purchasing and supply executives in the latest Services ISM® Report On Business®.This was lower than expected and the employment index was below 50.
The report was issued today by Anthony Nieves, CPSM, C.P.M., A.P.P., CFPM, Chair of the Institute for Supply Management® (ISM®) Services Business Survey Committee: “In October, the Services PMI® registered 54.4 percent, 2.3 percentage points lower than September’s reading of 56.7 percent. This is the lowest reading since May 2020, when the index registered 45.2 percent. The Business Activity Index registered 55.7 percent, a decrease of 3.4 percentage points compared to the reading of 59.1 percent in September. The New Orders Index figure of 56.5 percent is 4.1 percentage points lower than the September reading of 60.6 percent.
emphasis added
“Interest rates have put the brakes on the market.”
by Calculated Risk on 11/03/2022 09:19:00 AM
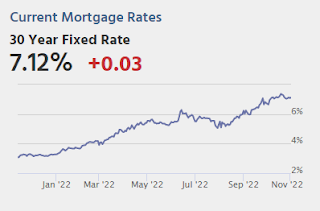
Today, in the Calculated Risk Real Estate Newsletter: “Interest rates have put the brakes on the market.”
A brief excerpt:
Here are some interesting real estate agent comments from around the country courtesy of Eric Finnigan, VP at John Burns Real Estate Consulting:There many more comments in the article. You can subscribe at https://calculatedrisk.substack.com/
#Sarasota, FL: “I've had numerous buyers looking but the prices are much higher than they want to spend. Many pulled back waiting for the market to go down.” ...
#NewYork: “Open house attendance is weaker than usual, and sales take longer.”
#OrangeCounty, CA: “Interest rates have put the brakes on the market.”
And here is some info on bidding wars from the survey:
If you are an agent, you can participate in this monthly survey … Burns Real Estate Agent Survey
Trade Deficit increased to $73.3 Billion in September
by Calculated Risk on 11/03/2022 08:46:00 AM
From the Department of Commerce reported:
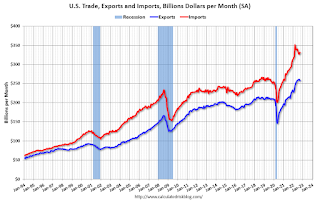
The U.S. Census Bureau and the U.S. Bureau of Economic Analysis announced today that the goods and services deficit was $73.3 billion in September, up $7.6 billion from $65.7 billion in August, revised.
September exports were $258.0 billion, $2.8 billion less than August exports. September imports were $331.3 billion, $4.8 billion more than August imports.
emphasis added
 Click on graph for larger image.
Exports decreased and imports increased in September.
Exports are up 22% year-over-year; imports are up 14% year-over-year.
Both imports and exports decreased sharply due to COVID-19 and have now bounced back.
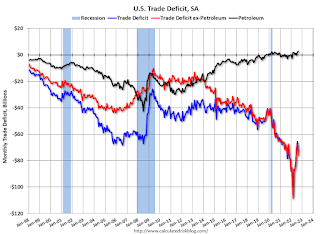
The second graph shows the U.S. trade deficit, with and without petroleum.
 The blue line is the total deficit, and the black line is the petroleum deficit, and the red line is the trade deficit ex-petroleum products.
Note that net, exports of petroleum products are slightly positive.
The trade deficit with China increased to $37.3 billion in September, from $36.4 billion a year ago.
Weekly Initial Unemployment Claims at 217,000
by Calculated Risk on 11/03/2022 08:33:00 AM
The DOL reported:
In the week ending October 29, the advance figure for seasonally adjusted initial claims was 217,000, a decrease of 1,000 from the previous week's revised level. The previous week's level was revised up by 1,000 from 217,000 to 218,000. The 4-week moving average was 218,750, a decrease of 500 from the previous week's revised average. The previous week's average was revised up by 250 from 219,000 to 219,250.The following graph shows the 4-week moving average of weekly claims since 1971.
emphasis added
 Click on graph for larger image.
The dashed line on the graph is the current 4-week average. The four-week average of weekly unemployment claims decreased to 218,750.
The previous week was revised up.
Weekly claims were lower than the consensus forecast.
Wednesday, November 02, 2022
Thursday: Unemployment Claims, Trade Deficit, ISM Services
by Calculated Risk on 11/02/2022 08:29:00 PM

Thursday:
• At 8:30 AM ET, The initial weekly unemployment claims report will be released. The consensus is for an increase to 222 thousand from 217 thousand last week.
• Also at 8:30 AM, Trade Balance report for September from the Census Bureau. The consensus is for the deficit to be $72.1 billion in September, from $67.4 billion in August.
• At 10:00 AM, the ISM Services Index for October. The consensus is for a decrease to 55.5 from 56.7.
Fed's Powell: "Ultimate level of interest rates will be higher than previously expected"
by Calculated Risk on 11/02/2022 04:28:00 PM
A quick note ... this was the key sentence from Fed Chair Powell's press conference: "the ultimate level of interest rates will be higher than previously expected".
Powell also said that "At some point it will be appropriate to slow the rate of increases", but he said that might be in December or in 2023.
Overall his comments were hawkish.
FOMC Statement: Raise Rates 75 bp; "Ongoing increases appropriate"
by Calculated Risk on 11/02/2022 02:03:00 PM
Fed Chair Powell press conference video here or on YouTube here, starting at 2:30 PM ET.
FOMC Statement:
Recent indicators point to modest growth in spending and production. Job gains have been robust in recent months, and the unemployment rate has remained low. Inflation remains elevated, reflecting supply and demand imbalances related to the pandemic, higher food and energy prices, and broader price pressures.
Russia's war against Ukraine is causing tremendous human and economic hardship. The war and related events are creating additional upward pressure on inflation and are weighing on global economic activity. The Committee is highly attentive to inflation risks.
The Committee seeks to achieve maximum employment and inflation at the rate of 2 percent over the longer run. In support of these goals, the Committee decided to raise the target range for the federal funds rate to 3-3/4 to 4 percent. The Committee anticipates that ongoing increases in the target range will be appropriate in order to attain a stance of monetary policy that is sufficiently restrictive to return inflation to 2 percent over time. In determining the pace of future increases in the target range, the Committee will take into account the cumulative tightening of monetary policy, the lags with which monetary policy affects economic activity and inflation, and economic and financial developments. In addition, the Committee will continue reducing its holdings of Treasury securities and agency debt and agency mortgage-backed securities, as described in the Plans for Reducing the Size of the Federal Reserve's Balance Sheet that were issued in May. The Committee is strongly committed to returning inflation to its 2 percent objective.
In assessing the appropriate stance of monetary policy, the Committee will continue to monitor the implications of incoming information for the economic outlook. The Committee would be prepared to adjust the stance of monetary policy as appropriate if risks emerge that could impede the attainment of the Committee's goals. The Committee's assessments will take into account a wide range of information, including readings on public health, labor market conditions, inflation pressures and inflation expectations, and financial and international developments.
Voting for the monetary policy action were Jerome H. Powell, Chair; John C. Williams, Vice Chair; Michael S. Barr; Michelle W. Bowman; Lael Brainard; James Bullard; Susan M. Collins; Lisa D. Cook; Esther L. George; Philip N. Jefferson; Loretta J. Mester; and Christopher J. Waller.
emphasis added
First Look at 2023 Housing Forecasts
by Calculated Risk on 11/02/2022 12:49:00 PM
Today, in the Calculated Risk Real Estate Newsletter: First Look at 2023 Housing Forecasts
A brief excerpt:
Towards the end of each year, I collect some housing forecasts for the following year.There is much more in the article. You can subscribe at https://calculatedrisk.substack.com/
For comparison, new home sales in 2022 will probably be around 650 thousand, down from 771 thousand in 2021.
Total housing starts will be around 1.58 million in 2022, down slightly from 1.60 million in 2021.
Existing home sales will be around 5.1 million in 2022, down from 6.1 million in 2021.
As of August, Case-Shiller house prices were up 13.0% year-over-year, but the year-over-year change is slowing rapidly.
Currently the Fannie Mae forecast is an outlier with a sharper decline in total starts and home sales than the other forecasts.
These forecasts will be updated over the next couple of months, and I’ll also add several more as they become available (and my own forecasts).
HVS: Q3 2022 Homeownership and Vacancy Rates
by Calculated Risk on 11/02/2022 11:16:00 AM
The Census Bureau released the Residential Vacancies and Homeownership report for Q3 2022.
The results of this survey were significantly distorted by the pandemic in 2020.
This report is frequently mentioned by analysts and the media to track household formation, the homeownership rate, and the homeowner and rental vacancy rates. However, there are serious questions about the accuracy of this survey.
This survey might show the trend, but I wouldn't rely on the absolute numbers. Analysts probably shouldn't use the HVS to estimate the excess vacant supply or household formation, or rely on the homeownership rate, except as a guide to the trend.
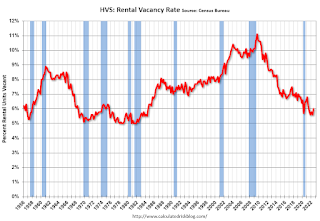
National vacancy rates in the third quarter 2022 were 6.0 percent for rental housing and 0.9 percent for homeowner housing. The rental vacancy rate was not statistically different from the rate in the third quarter 2021 (5.8 percent) and 0.4 percentage points higher than the rate in the second quarter 2022 (5.6 percent).
The homeowner vacancy rate of 0.9 percent was virtually the same as the rate in the third quarter 2021 (0.9 percent) and not statistically different from the rate in the second quarter 2022 (0.8 percent).
The homeownership rate of 66.0 percent was 0.6 percentage points higher than the rate in the third quarter 2021 (65.4 percent) and not statistically different from the rate in the second quarter 2022 (65.8 percent).
emphasis added
 Click on graph for larger image.
The results in Q2 and Q3 2020 were distorted by the pandemic and should be ignored.
 The HVS homeowner vacancy increased to 0.9% in Q3 from 0.8% in Q2.
 Once again - this probably shows the general trend, but I wouldn't rely on the absolute numbers.
 The rental vacancy rate increased to 6.0% in Q3 from 5.6% in Q2.
 The HVS also has a series on asking rents. This surged following the early stages of the pandemic - like other measures - and is up 10.9% year-over-year in Q3 2022.
The quarterly HVS is the timeliest survey on households, but there are many questions about the accuracy of this survey.


