by Calculated Risk on 11/05/2022 08:11:00 AM
Saturday, November 05, 2022
Schedule for Week of November 6, 2022
The key economic report this week is October CPI.
2:00 PM: Senior Loan Officer Opinion Survey on Bank Lending Practices for October.
6:00 AM: NFIB Small Business Optimism Index for October.
7:00 AM ET: The Mortgage Bankers Association (MBA) will release the results for the mortgage purchase applications index.
8:30 AM: The Consumer Price Index for October from the BLS. The consensus is for a 0.7% increase in CPI, and a 0.5% increase in core CPI. The consensus is for CPI to be up 8.0% year-over-year and core CPI to be up 6.6% YoY.
8:30 AM: The initial weekly unemployment claims report will be released. The consensus is for 220 thousand initial claims, up from 217 thousand last week.
Veterans Day Holiday: Most banks will be closed in observance of Veterans Day. The stock market will be open.
10:00 AM: University of Michigan's Consumer sentiment index (Preliminary for November).
Friday, November 04, 2022
COVID Nov 4, 2022: Update on Cases, Hospitalizations and Deaths
by Calculated Risk on 11/04/2022 09:03:00 PM

NOTE: COVID stats are updated on Fridays.
On COVID (focus on hospitalizations and deaths). Data has switched to weekly.
Weekly deaths bottomed in July 2021 at 1,666.
| COVID Metrics | ||||
|---|---|---|---|---|
| Now | Week Ago | Goal | ||
| New Cases per Week2🚩 | 273,110 | 260,830 | ≤35,0001 | |
| Hospitalized2 | 21,001 | 21,219 | ≤3,0001 | |
| Deaths per Week2 | 2,504 | 2,581 | ≤3501 | |
| 1my goals to stop weekly posts, 2Weekly for Cases, Currently Hospitalized, and Deaths 🚩 Increasing number weekly for Cases, Hospitalized, and Deaths ✅ Goal met. | ||||
 Click on graph for larger image.
This graph shows the weekly (columns) number of deaths reported.
AAR: October Rail Carloads Up Slightly Year-over-year, Intermodal Down
by Calculated Risk on 11/04/2022 04:20:00 PM
From the Association of American Railroads (AAR) Rail Time Indicators. Graphs and excerpts reprinted with permission.
October is usually a top month for carloads, and that’s the case in 2022. Total originated U.S. carloads averaged 238,019 per week in October 2022, the most since May 2021 and up 0.5% over October 2021. ... U.S. intermodal volume fell 1.4% ... its 14th decline in the past 15 months.
emphasis added
 Click on graph for larger image.
This graph from the Rail Time Indicators report shows the six-week average of U.S. Carloads in 2020, 2021 and 2022:
Total originated carloads on U.S. railroads averaged 238,019 per week in October 2022, the most since May 2021 and up 0.5% over October 2021. Typically, October is the second highest month of the year for total carloads (behind August), although there is more variability for monthly rankings for total carloads than there is for intermodal.
 The second graph shows the six-week average (not monthly) of U.S. intermodal in 2020, 2021 and 2022: (using intermodal or shipping containers):
Intermodal volume on U.S. railroads averaged 265,606 containers and trailers per week in October 2022, down 1.4% from October 2021. It’s the eighth straight monthly decline and the 14th decline in the past 15 months.
High inventories at many retailers; warehouses that are generally still clogged (related to high inventories); the fact that many retailers moved up orders to earlier in the year to ensure delivery before the holiday season; and lower port volumes are some of the reasons why intermodal volumes this year are not as high as they otherwise would be.
Realtor.com Weekly Inventory Up 40% Year-over-year; Now Above Same Week in 2020
by Calculated Risk on 11/04/2022 02:11:00 PM
Today, in the Calculated Risk Real Estate Newsletter: Realtor.com Weekly Inventory Up 40% Year-over-year; Now Above Same Week in 2020
A brief excerpt:
Here is a graph comparing the year-over-year change in the Realtor.com active monthly data to the inventory data from the National Association of Realtors (NAR). The dashed line is Realtor.com’s estimate of total inventory including pendings.There many more comments in the article. You can subscribe at https://calculatedrisk.substack.com/
t appears the NAR includes some pending sales in their inventory data, and that accounts for the divergence in the year-over-year change over the last 2 years.
Housing economist Tom Lawler noted this in early 2021:"As I’ve noted before, the inventory measure in most publicly-released local realtor/MLS reports excludes listings with pending contracts, but that is not the case for many of the reports sent to the NAR (referred to as the “NAR Report!”), Since the middle of last Spring inventory measures excluding pending listings have fallen much more sharply than inventory measures including such listings, and this latter inventory measure understates the decline in the effective inventory of homes for sale over the last several months."The divergence between the NAR and other measures will probably disappear as the housing market slows.
The bottom line is inventory is still low, increasing, and the pace of growth has picked up again in recent weeks.
Early Q4 GDP Tracking and Upward Revisions to Q3 GDP
by Calculated Risk on 11/04/2022 12:26:00 PM
A wide range of Q4 estimates, from 0.7% to 3.6%. It looks like Q3 GDP will be revised up in the second release.
From BofA:
[1.0% in Q4] Overall, the data since our last weekly publication when the BEA’s advance estimate of US 3Q GDP growth was realeased, moved up our 3Q GDP tracking estimate from 2.6% q/q saar (seasonally adjusted annual rate) to 3.1% q/q saar [Nov 4th estimate]From Goldman:
emphasis added
Following today’s data, we lowered our Q4 GDP tracking estimate by two tenths to +0.7% (qoq ar) but boosted our past-quarter tracking estimate for Q3 by the same amount to +3.1%, compared to +2.6% as originally reported. [Nov 3rd estimate]And from the Altanta Fed: GDPNow
The GDPNow model estimate for real GDP growth (seasonally adjusted annual rate) in the fourth quarter of 2022 is 3.6 percent on November 3, up from 2.6 percent on November 1. [Nov 3rd estimate]
Comments on October Employment Report
by Calculated Risk on 11/04/2022 09:24:00 AM
The headline jobs number in the October employment report was above expectations, and employment for the previous two months was revised up by 29,000, combined. The participation rate decreased, and the unemployment rate increased to 3.7%.
In October, the year-over-year employment change was 5.30 million jobs.
Seasonal Retail Hiring
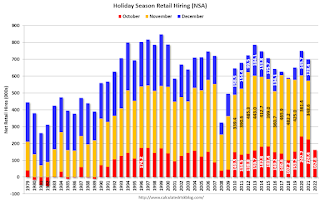
Typically, retail companies start hiring for the holiday season in October, and really increase hiring in November. Here is a graph that shows the historical net retail jobs added for October, November and December by year.
 This graph really shows the collapse in retail hiring in 2008. Since then, seasonal hiring had increased back close to more normal levels. Note: I expect the long-term trend will be down with more and more internet holiday shopping.
Retailers hired 163 thousand workers Not Seasonally Adjusted (NSA) net in October. This was down from the previous two years and suggests lower increase in real retail sales this holiday season than the previous two years.
Prime (25 to 54 Years Old) Participation
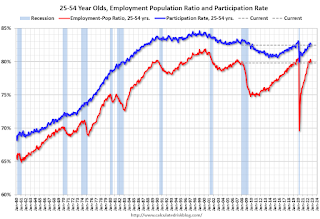
 Since the overall participation rate is impacted by both cyclical (recession) and demographic (aging population, younger people staying in school) reasons, here is the employment-population ratio for the key working age group: 25 to 54 years old.
The 25 to 54 participation rate decreased in October to 82.5% from 82.7% in September, and the 25 to 54 employment population ratio decreased to 79.8% from 80.2% the previous month.
Part Time for Economic Reasons
 From the BLS report:
"The number of persons employed part time for economic reasons was little changed at 3.7 million in October. These individuals, who would have preferred full-time employment, were working part time because their hours had been reduced or they were unable to find full-time jobs."The number of persons working part time for economic reasons decreased in October to 3.577 million from 3.843 million in September. This is below pre-recession levels and the fewest part time workers (for economic reasons) in over 20 years.
These workers are included in the alternate measure of labor underutilization (U-6) that increased to 6.8% from 6.7% in the previous month. This is down from the record high in April 22.9%, and is close to the lowest level on record for this measure since 1994. This measure is below the level in February 2020 (pre-pandemic).
Unemployed over 26 Weeks
 This graph shows the number of workers unemployed for 27 weeks or more.
 According to the BLS, there are 1.165 million workers who have been unemployed for more than 26 weeks and still want a job, up from 1.067 million the previous month.
This is back to pre-pandemic levels.
Summary:
The headline monthly jobs number was above expectations and employment for the previous two months was revised up by 29,000, combined.
October Employment Report: 261 thousand Jobs, 3.7% Unemployment Rate
by Calculated Risk on 11/04/2022 08:40:00 AM
From the BLS:
Total nonfarm payroll employment increased by 261,000 in October, and the unemployment rate rose to 3.7 percent, the U.S. Bureau of Labor Statistics reported today. Notable job gains occurred in health care, professional and technical services, and manufacturing.
...
The change in total nonfarm payroll employment for August was revised down by 23,000, from +315,000 to +292,000, and the change for September was revised up by 52,000, from +263,000 to +315,000. With these revisions, employment gains in August and September combined were 29,000 higher than previously reported.
emphasis added
 Click on graph for larger image.
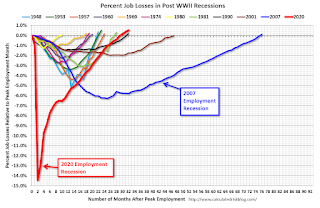
The first graph shows the job losses from the start of the employment recession, in percentage terms.
The current employment recession was by far the worst recession since WWII in percentage terms.
 The second graph shows the year-over-year change in total non-farm employment since 1968.
In October, the year-over-year change was 5.30 million jobs. Employment was up significantly year-over-year.
Total payrolls increased by 261 thousand in October. Private payrolls increased by 233 thousand, and public payrolls increased 28 thousand.
Payrolls for August and September were revised up 29 thousand, combined.
The third graph shows the employment population ratio and the participation rate.
 The Labor Force Participation Rate decreased to 62.2% in October, from 62.3% in September. This is the percentage of the working age population in the labor force.
 The Employment-Population ratio decreased to 60.0% from 60.1% (blue line).
I'll post the 25 to 54 age group employment-population ratio graph later.
 The fourth graph shows the unemployment rate.
 The unemployment rate increased in October to 3.7% from 3.5% in September.
This was above consensus expectations; and August and September payrolls were revised up by 29,000 combined.
Thursday, November 03, 2022
Friday: Employment Report
by Calculated Risk on 11/03/2022 09:09:00 PM

Goldman October Payrolls Preview
Friday:
• At 8:30 AM ET, Employment Report for October. The consensus is for 200,000 jobs added, and for the unemployment rate to increase to 3.6%.
Goldman October Payrolls Preview
by Calculated Risk on 11/03/2022 05:01:00 PM
A few brief excerpts from a note by Goldman Sachs economist Spencer Hill:
We estimate nonfarm payrolls rose by 225k in October (mom sa) ... Labor demand remains elevated despite declining this year, and Big Data indicators generally point to above-consensus payroll gains. ... We estimate the unemployment rate was unchanged at 3.5% in Octobe ... We estimate average hourly earnings rose 0.35% month-over-month and 4.7% year-on-year.
emphasis added
Realtor.com Reports Weekly Active Inventory Up 40% Year-over-year; New Listings Down 13%
by Calculated Risk on 11/03/2022 03:35:00 PM
Realtor.com has monthly and weekly data on the existing home market. Here is their weekly report released today from Chief Economist Danielle Hale: Weekly Housing Trends View — Data Week Ending Oct 29, 2022. Note: They have data on list prices, new listings and more, but this focus is on inventory.
• Active inventory continued to grow, increasing 40% above one year ago. This is the third week of a more notable step up in inventory gains after rough stability since July.
...
• New listings–a measure of sellers putting homes up for sale–were again down, dropping 13% from one year ago. This marks the seventeenth week of year over year declines in the number of new listings coming up for sale.
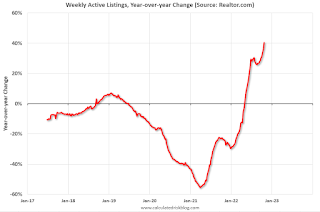
 Here is a graph of the year-over-year change in inventory according to realtor.com.
 Note the rapid increase in the YoY change earlier this year, from down 30% at the beginning of the year, to up 29% YoY at the beginning of July.


