by Calculated Risk on 11/07/2022 12:09:00 PM
Monday, November 07, 2022
Housing November 7th Weekly Update: Inventory Decreased Slightly Week-over-week
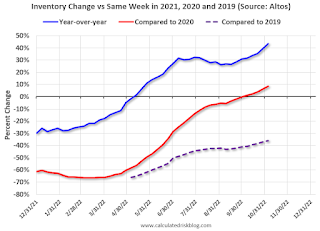
 Click on graph for larger image.
This inventory graph is courtesy of Altos Research.
1. The seasonal bottom (happened on March 4, 2022, for Altos) ✅
2. Inventory up year-over-year (happened on May 20, 2022, for Altos) ✅
3. Inventory up compared to 2020 (happened on October 7, 2022, for Altos) ✅
4. Inventory up compared to 2019 (currently down 36.0%).
Black Knight Mortgage Monitor: Home Prices Declined in September; Down 2.6% since June
by Calculated Risk on 11/07/2022 10:33:00 AM
Today, in the Calculated Risk Real Estate Newsletter: Black Knight Mortgage Monitor: Home Prices Declined in September; Down 2.6% since June
A brief excerpt:
Here is a graph of the Black Knight HPI. The index is still up 10.1% year-over-year but declined for the third straight month in September and is now 2.6% off the peak in June.There is much more in the article. You can subscribe at https://calculatedrisk.substack.com/
• Housing market watchers are split on whether we will see meaningful price declines in coming months – or even years – due to low affordability, or a more lateral correction moderated by historically low inventory
• September’s data brought fodder for both sides of the debate, with home prices slipping for a third consecutive month, but at 0.52%, less than half the monthly declines seen in July and August
• All in, prices have fallen 2.6% since June – the first 3-month decline since 30-year rates spiked to near 5% back in late 2018, and the worst 3-month stretch since early 2009.
Wholesale Used Car Prices Declined in October; Prices Down 10.6% Year-over-year
by Calculated Risk on 11/07/2022 09:12:00 AM
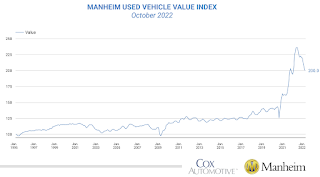
From Manheim Consulting today: Wholesale Used-Vehicle Prices See Smaller Decline in October
Wholesale used-vehicle prices (on a mix, mileage, and seasonally adjusted basis) decreased 2.2% in October from September. The Manheim Used Vehicle Value Index declined to 200.0 and is now down 10.6% from a year ago. The non-adjusted price change in October was a decline of 2.1% compared to September, moving the unadjusted average price down 9.3% year over year.
emphasis added
 Click on graph for larger image.
This index from Manheim Consulting is based on all completed sales transactions at Manheim’s U.S. auctions.
Four High Frequency Indicators for the Economy
by Calculated Risk on 11/07/2022 08:32:00 AM
These indicators are mostly for travel and entertainment. It was interesting to watch these sectors recover as the pandemic impact subsided.
The TSA is providing daily travel numbers.
This data is as of November 6th.
 Click on graph for larger image.
This data shows the 7-day average of daily total traveler throughput from the TSA for 2019 (Light Blue), 2020 (Black), 2021 (Blue) and 2022 (Red).
The dashed line is the percent of 2019 for the seven-day average.
The 7-day average is 7.7% below the same week in 2019 (92.2% of 2019). (Dashed line)
 This data shows domestic box office for each week and the median for the years 2016 through 2019 (dashed light blue).
 Note that the data is usually noisy week-to-week and depends on when blockbusters are released.
Movie ticket sales were at $91 million last week, down about 39% from the median for the week.
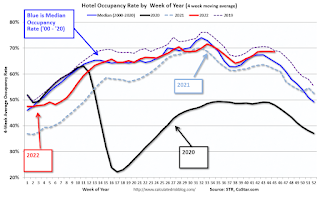
 This graph shows the seasonal pattern for the hotel occupancy rate using the four-week average.
 The red line is for 2022, black is 2020, blue is the median, and dashed light blue is for 2021. Dashed purple is 2019 (STR is comparing to a strong year for hotels).
This data is through Oct 29th. The occupancy rate was up 5.2% compared to the same week in 2019.
Notes: Y-axis doesn't start at zero to better show the seasonal change.
Blue is for 2020. Purple is for 2021, and Red is for 2022.
As of October 28th, gasoline supplied was down 11.5% compared to the same week in 2019.
Recently gasoline supplied has been running below 2019 and 2021 levels - and sometimes below 2020.
Sunday, November 06, 2022
Sunday Night Futures
by Calculated Risk on 11/06/2022 06:14:00 PM
Weekend:
• Schedule for Week of November 6, 2022
• Solid Holiday Retail Sales Forecasts
Monday:
• At 2:00 PM ET, Senior Loan Officer Opinion Survey on Bank Lending Practices for October.
From CNBC: Pre-Market Data and Bloomberg futures S&P 500 are down 28 and DOW futures are down 208 (fair value).
Oil prices were up over the last week with WTI futures at $92.61 per barrel and Brent at $98.57 per barrel. A year ago, WTI was at $82, and Brent was at $83 - so WTI oil prices are up 12% year-over-year.
Here is a graph from Gasbuddy.com for nationwide gasoline prices. Nationally prices are at $3.78 per gallon. A year ago, prices were at $3.42 per gallon, so gasoline prices are up $0.36 per gallon year-over-year.
Solid Holiday Retail Sales Forecasts
by Calculated Risk on 11/06/2022 09:54:00 AM
Here are two holiday retail sales forecasts. One from the National Retail Federation (NRF), and another based on October seasonal retail hiring as described in Retail: October Seasonal Hiring vs. Holiday Retail Sales
First from the NRF: NRF Predicts Healthy Holiday Sales as Consumers Navigate Economic Headwinds
Holiday spending is expected to be healthy even with recent inflationary challenges, as the National Retail Federation today forecast that holiday retail sales during November and December will grow between 6% and 8% over 2021 to between $942.6 billion and $960.4 billion. Last year’s holiday sales grew 13.5% over 2020 and totaled $889.3 billion, shattering previous records. Holiday retail sales have averaged an increase of 4.9% over the past 10 years, with pandemic spending in recent years accounting for considerable gains.
emphasis added
 Click on graph for larger image.
Here is a graph from the NRF showing the year-over-year change in retail sales in November and December (ex-automobile dealers, gasoline stations and restaurants). This is NOT seasonally adjusted, and just for November and December.
My approach below uses real retail sales for Q4 (October, November and December) adjusted with CPI.
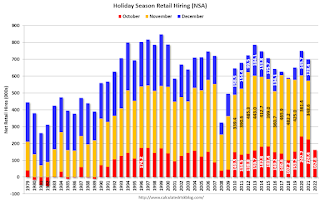
 This graph shows the historical net retail jobs added for October, November and December by year.
Retailers hired 163 thousand workers Not Seasonally Adjusted (NSA) net in October. This was down from the previous two years and suggests lower increase in real retail sales this holiday season than the previous two years -but still solid.
Note that in the early '90s, retailers started hiring seasonal workers earlier - and the trend towards hiring earlier has continued.
The following scatter graph is for the years 2005 through 2021 and compares October retail hiring with the real increase (inflation adjusted) for retail sales (Q4 over previous Q4).
 In general October hiring is a pretty good indicator of seasonal sales. R-square is 0.82 for this small sample. Note: This uses retail sales in Q4, and excludes autos, gasoline and restaurants.
NOTE: The dot in the upper right - with real Retail sales up almost 10% YoY is for 2020 - when retail sales soared due to the pandemic spending on goods (service spending was soft).
Saturday, November 05, 2022
Real Estate Newsletter Articles this Week: “Interest rates have put the brakes on the market.”
by Calculated Risk on 11/05/2022 02:11:00 PM
At the Calculated Risk Real Estate Newsletter this week:
• “Interest rates have put the brakes on the market.”
• First Look at 2023 Housing Forecasts
• How Much will the Fannie & Freddie Conforming Loan Limit Increase for 2023?
• Year-over-year Pace of Rent Increases Continues to Slow
• Realtor.com Weekly Inventory Up 40% Year-over-year; Now Above Same Week in 2020
This is usually published 4 to 6 times a week and provides more in-depth analysis of the housing market.
You can subscribe at https://calculatedrisk.substack.com/
Schedule for Week of November 6, 2022
by Calculated Risk on 11/05/2022 08:11:00 AM
The key economic report this week is October CPI.
2:00 PM: Senior Loan Officer Opinion Survey on Bank Lending Practices for October.
6:00 AM: NFIB Small Business Optimism Index for October.
7:00 AM ET: The Mortgage Bankers Association (MBA) will release the results for the mortgage purchase applications index.
8:30 AM: The Consumer Price Index for October from the BLS. The consensus is for a 0.7% increase in CPI, and a 0.5% increase in core CPI. The consensus is for CPI to be up 8.0% year-over-year and core CPI to be up 6.6% YoY.
8:30 AM: The initial weekly unemployment claims report will be released. The consensus is for 220 thousand initial claims, up from 217 thousand last week.
Veterans Day Holiday: Most banks will be closed in observance of Veterans Day. The stock market will be open.
10:00 AM: University of Michigan's Consumer sentiment index (Preliminary for November).
Friday, November 04, 2022
COVID Nov 4, 2022: Update on Cases, Hospitalizations and Deaths
by Calculated Risk on 11/04/2022 09:03:00 PM

NOTE: COVID stats are updated on Fridays.
On COVID (focus on hospitalizations and deaths). Data has switched to weekly.
Weekly deaths bottomed in July 2021 at 1,666.
| COVID Metrics | ||||
|---|---|---|---|---|
| Now | Week Ago | Goal | ||
| New Cases per Week2🚩 | 273,110 | 260,830 | ≤35,0001 | |
| Hospitalized2 | 21,001 | 21,219 | ≤3,0001 | |
| Deaths per Week2 | 2,504 | 2,581 | ≤3501 | |
| 1my goals to stop weekly posts, 2Weekly for Cases, Currently Hospitalized, and Deaths 🚩 Increasing number weekly for Cases, Hospitalized, and Deaths ✅ Goal met. | ||||
 Click on graph for larger image.
This graph shows the weekly (columns) number of deaths reported.
AAR: October Rail Carloads Up Slightly Year-over-year, Intermodal Down
by Calculated Risk on 11/04/2022 04:20:00 PM
From the Association of American Railroads (AAR) Rail Time Indicators. Graphs and excerpts reprinted with permission.
October is usually a top month for carloads, and that’s the case in 2022. Total originated U.S. carloads averaged 238,019 per week in October 2022, the most since May 2021 and up 0.5% over October 2021. ... U.S. intermodal volume fell 1.4% ... its 14th decline in the past 15 months.
emphasis added
 Click on graph for larger image.
This graph from the Rail Time Indicators report shows the six-week average of U.S. Carloads in 2020, 2021 and 2022:
Total originated carloads on U.S. railroads averaged 238,019 per week in October 2022, the most since May 2021 and up 0.5% over October 2021. Typically, October is the second highest month of the year for total carloads (behind August), although there is more variability for monthly rankings for total carloads than there is for intermodal.
 The second graph shows the six-week average (not monthly) of U.S. intermodal in 2020, 2021 and 2022: (using intermodal or shipping containers):
Intermodal volume on U.S. railroads averaged 265,606 containers and trailers per week in October 2022, down 1.4% from October 2021. It’s the eighth straight monthly decline and the 14th decline in the past 15 months.
High inventories at many retailers; warehouses that are generally still clogged (related to high inventories); the fact that many retailers moved up orders to earlier in the year to ensure delivery before the holiday season; and lower port volumes are some of the reasons why intermodal volumes this year are not as high as they otherwise would be.


