by Calculated Risk on 11/18/2022 02:47:00 PM
Friday, November 18, 2022
Early Q4 GDP Tracking
From BofA:
Existing home sales actually fell less than we expected, implying slightly stronger brokers’ commissions in 4Q. As a result, our tracking estimate for residential investment in 4Q edged up. That said, after rounding, our 4Q GDP tracking estimate was unchanged at 1.3% q/q saar. [Nov 18th estimate]From Goldman:
emphasis added
We lowered our Q4 GDP tracking estimate by 0.1pp to +0.9% (qoq ar). [Nov 18th estimate]And from the Altanta Fed: GDPNow
The GDPNow model estimate for real GDP growth (seasonally adjusted annual rate) in the fourth quarter of 2022 is 4.2 percent on November 17, down from 4.4 percent on November 16. [Nov 17th estimate]
More Analysis on October Existing Home Sales
by Calculated Risk on 11/18/2022 11:41:00 AM
Today, in the CalculatedRisk Real Estate Newsletter: NAR: Existing-Home Sales Decreased to 4.43 million SAAR in October
Excerpt:
On prices, the NAR reported:There is much more in the article. You can subscribe at https://calculatedrisk.substack.com/ (Most content is available for free, so please subscribe).The median existing-home price for all housing types in October was $379,100, a gain of 6.6% from October 2021 ($355,700), as prices rose in all regions. This marks 128 consecutive months of year-over-year increases, the longest-running streak on record.Median prices are distorted by the mix (repeat sales indexes like Case-Shiller and FHFA are probably better for measuring prices).
The YoY change in the median price peaked at 25.2% in May 2021 and has now slowed to 6.6%. The YoY increase in October was the lowest since June 2020. Note that the median price usually starts falling seasonally in July, so the 1.1% decline in October in the median price was partially seasonal, however the 8.4% decline over the last four months has been much larger than the usual seasonal decline.
It is likely the median price will be down year-over-year in a few months.
NAR: Existing-Home Sales Decreased to 4.43 million SAAR in October
by Calculated Risk on 11/18/2022 10:12:00 AM
From the NAR: Existing-Home Sales Slumped 5.9% in October
Existing-home sales retreated for the ninth straight month in October, according to the National Association of REALTORS®. All four major U.S. regions registered month-over-month and year-over-year declines.
Total existing-home sales - completed transactions that include single-family homes, townhomes, condominiums and co-ops – decreased 5.9% from September to a seasonally adjusted annual rate of 4.43 million in October. Year-over-year, sales dropped by 28.4% (down from 6.19 million in October 2021).
...
Total housing inventory registered at the end of October was 1.22 million units, which was down 0.8% from both September and one year ago (1.23 million). Unsold inventory sits at a 3.3-month supply at the current sales pace, up from 3.1 months in September and 2.4 months in October 2021.
emphasis added
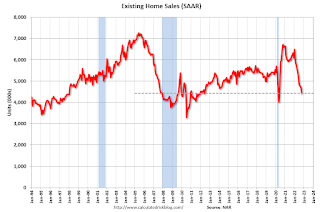 Click on graph for larger image.
This graph shows existing home sales, on a Seasonally Adjusted Annual Rate (SAAR) basis since 1993.
Sales in October (4.43million SAAR) were down 5.9% from the previous month and were 28.4% below the October 2021 sales rate.
The second graph shows nationwide inventory for existing homes.
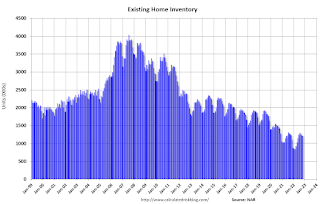 According to the NAR, inventory decreased to 1.22 million in October from 1.23 million in September.
The last graph shows the year-over-year (YoY) change in reported existing home inventory and months-of-supply. Since inventory is not seasonally adjusted, it really helps to look at the YoY change. Note: Months-of-supply is based on the seasonally adjusted sales and not seasonally adjusted inventory.
 Inventory was essentially unchanged year-over-year (blue) in October compared to October 2021.
 Months of supply (red) increased to 3.3 months in October from 3.1 months in September.
This was slightly above the consensus forecast. I'll have more later.
LA Port Traffic Down Sharply in October
by Calculated Risk on 11/18/2022 08:45:00 AM
Notes: The expansion to the Panama Canal was completed in 2016 (As I noted a few years ago), and some of the traffic that used the ports of Los Angeles and Long Beach is probably going through the canal. This might be impacting TEUs on the West Coast.
Container traffic gives us an idea about the volume of goods being exported and imported - and usually some hints about the trade report since LA area ports handle about 40% of the nation's container port traffic.
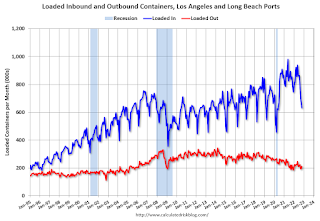
The following graphs are for inbound and outbound traffic at the ports of Los Angeles and Long Beach in TEUs (TEUs: 20-foot equivalent units or 20-foot-long cargo container).
To remove the strong seasonal component for inbound traffic, the first graph shows the rolling 12-month average.

On a rolling 12-month basis, inbound traffic decreased 2.2% in October compared to the rolling 12 months ending in September. Outbound traffic decreased 0.4% compared to the rolling 12 months ending the previous month.
The 2nd graph is the monthly data (with a strong seasonal pattern for imports).
Thursday, November 17, 2022
Friday: Existing Home Sales
by Calculated Risk on 11/17/2022 08:35:00 PM
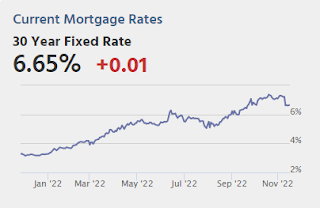
Friday:
• At 10:00 AM ET, Existing Home Sales for October from the National Association of Realtors (NAR). The consensus is for 4.39 million SAAR, down from 4.71 million in September.
• Also at 10:00 AM, State Employment and Unemployment (Monthly) for October 2022
Realtor.com Reports Weekly Active Inventory Up 45% Year-over-year; New Listings Down 18%
by Calculated Risk on 11/17/2022 02:10:00 PM
Realtor.com has monthly and weekly data on the existing home market. Here is their weekly report released today from Chief Economist Danielle Hale: Weekly Housing Trends View — Data Week Ending Nov 12, 2022. Note: They have data on list prices, new listings and more, but this focus is on inventory.
• Active inventory continued to grow, increasing 45% above one year ago. Inventory accelerated again, notching a fifth straight week of gains roughly at or above 2% after a fair amount of stability between July and September. Fewer newly listed homes would normally cause a decline in inventory, but buyers have retreated from the housing market as higher and more uncertain costs make it difficult to ascertain purchasing power and set a budget.
...
• New listings–a measure of sellers putting homes up for sale–were again down, dropping 18% from one year ago. This marks the nineteenth week of year over year declines in homeowners listing their home for sale, a tangible reflection of the ongoing decline in seller confidence. Because potential sellers have pulled back so significantly, prices are decelerating in a more modest fashion than might otherwise be the case.
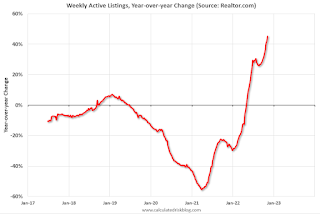 Here is a graph of the year-over-year change in inventory according to realtor.com.
 Note the rapid increase in the YoY change earlier this year, from down 30% at the beginning of the year, to up 29% YoY at the beginning of July.
October Housing Starts: Record Number of Housing Units Under Construction
by Calculated Risk on 11/17/2022 09:22:00 AM
Today, in the CalculatedRisk Real Estate Newsletter: October Housing Starts: Record Number of Housing Units Under Construction
Excerpt:
The fourth graph shows housing starts under construction, Seasonally Adjusted (SA).There is much more in the post. You can subscribe at https://calculatedrisk.substack.com/ (Most content is available for free, so please subscribe).
Red is single family units. Currently there are 794 thousand single family units (red) under construction (SA). This is below the previous six months, and 36 thousand below the recent peak in April and May. Single family units under construction have peaked since single family starts are now declining. The reason there are so many homes under construction is probably due to supply constraints.
Blue is for 2+ units. Currently there are 928 thousand multi-family units under construction. This is the highest level since December 1973! For multi-family, construction delays are probably also a factor. The completion of these units should help with rent pressure.
Combined, there are 1.722 million units under construction. This is the all-time record number of units under construction.
Housing Starts Decreased to 1.425 million Annual Rate in October
by Calculated Risk on 11/17/2022 08:42:00 AM
From the Census Bureau: Permits, Starts and Completions
Housing Starts:
Privately‐owned housing starts in October were at a seasonally adjusted annual rate of 1,425,000. This is 4.2 percent below the revised September estimate of 1,488,000 and is 8.8 percent below the October 2021 rate of 1,563,000. Single‐family housing starts in October were at a rate of 855,000; this is 6.1 percent below the revised September figure of 911,000. The October rate for units in buildings with five units or more was 556,000.
Building Permits:
Privately‐owned housing units authorized by building permits in October were at a seasonally adjusted annual rate of 1,526,000. This is 2.4 percent below the revised September rate of 1,564,000 and is 10.1 percent below the October 2021 rate of 1,698,000. Single‐family authorizations in October were at a rate of 839,000; this is 3.6 percent below the revised September figure of 870,000. Authorizations of units in buildings with five units or more were at a rate of 633,000 in October.
emphasis added
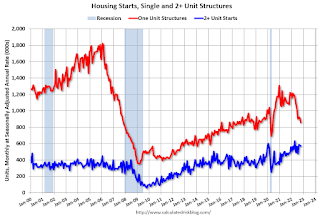 Click on graph for larger image.
The first graph shows single and multi-family housing starts for the last several years.
Multi-family starts (blue, 2+ units) decreased in October compared to September. Multi-family starts were up 17.8% year-over-year in October.
Single-family starts (red) decreased in October and were down 20.8% year-over-year.
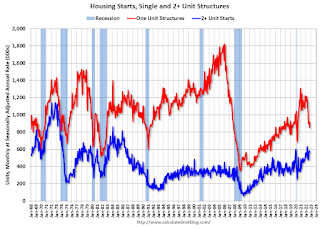 The second graph shows single and multi-family housing starts since 1968.
 This shows the huge collapse following the housing bubble, and then the eventual recovery.
Total housing starts in October were above expectations, however, starts in August and September were revised down slightly, combined.
I'll have more later …
Weekly Initial Unemployment Claims decrease to 222,000
by Calculated Risk on 11/17/2022 08:33:00 AM
The DOL reported:
In the week ending November 12, the advance figure for seasonally adjusted initial claims was 222,000, a decrease of 4,000 from the previous week's revised level. The previous week's level was revised up by 1,000 from 225,000 to 226,000. The 4-week moving average was 221,000, an increase of 2,000 from the previous week's revised average. The previous week's average was revised up by 250 from 218,750 to 219,000.The following graph shows the 4-week moving average of weekly claims since 1971.
emphasis added
 Click on graph for larger image.
The dashed line on the graph is the current 4-week average. The four-week average of weekly unemployment claims increased to 221,000.
The previous week was revised up.
Weekly claims were above the consensus forecast.
Wednesday, November 16, 2022
Thursday: Housing Starts, Unemployment Claims, Philly Fed Mfg
by Calculated Risk on 11/16/2022 09:06:00 PM

Thursday:
• At 8:30 AM ET, Housing Starts for October. The consensus is for 1.410 million SAAR, down from 1.439 million SAAR.
• Also at 8:30 AM, The initial weekly unemployment claims report will be released. The consensus is for 230 thousand initial claims, up from 225 thousand last week.
• Also at 8:30 AM, the Philly Fed manufacturing survey for November. The consensus is for a reading of -8.0, up from -8.7.
• At 11:00 AM: the Kansas City Fed manufacturing survey for November.


