by Calculated Risk on 11/29/2022 09:51:00 AM
Tuesday, November 29, 2022
Comments on September Case-Shiller and FHFA House Prices
Today, in the Calculated Risk Real Estate Newsletter: Case-Shiller: National House Price Index "Continued to Decline" to 10.6% year-over-year increase in September
Excerpt:
Both the Case-Shiller House Price Index (HPI) and the Federal Housing Finance Agency (FHFA) HPI for September were released today. Here is a graph of the month-over-month (MoM) change in the Case-Shiller National Index Seasonally Adjusted (SA).
The Case-Shiller Home Price Indices for “September” is a 3-month average of July, August and September closing prices. July closing prices include some contracts signed in May, so there is a significant lag to this data.
The MoM decrease in Case-Shiller was at -0.76% seasonally adjusted. This was the third consecutive MoM decrease, and slightly less than the decrease last month. This suggests prices fell sharply for September closings.
On a seasonally adjusted basis, prices declined in all of the Case-Shiller cities on a month-to-month basis. The largest monthly declines seasonally adjusted were in San Francisco (-2.2%), Phoenix (-2.1%) and Las Vegas (-2.1%). San Francisco has fallen 10.3% from the peak in May 2022.
...
The September Case-Shiller report is mostly for contracts signed in the May through August period when 30-year mortgage rates were in the low-to-mid 5% range. The October report will mostly be for contracts signed in the June through September period - when rates were mostly in the low-to-mid 5% range (except September).
The impact from higher rates in September and October will not show up significantly for a few more months.
Case-Shiller: National House Price Index "Continued to Decline" to 10.6% year-over-year increase in September
by Calculated Risk on 11/29/2022 09:12:00 AM
S&P/Case-Shiller released the monthly Home Price Indices for September ("September" is a 3-month average of July, August and September closing prices).
This release includes prices for 20 individual cities, two composite indices (for 10 cities and 20 cities) and the monthly National index.
From S&P: S&P Corelogic Case-Shiller Index Continued to Decline in September
The S&P CoreLogic Case-Shiller U.S. National Home Price NSA Index, covering all nine U.S. census divisions, reported a 10.6% annual gain in September, down from 12.9% in the previous month. The 10-City Composite annual increase came in at 9.7%, down from 12.1% in the previous month. The 20- City Composite posted a 10.4% year-over-year gain, down from 13.1% in the previous month.
Miami, Tampa, and Charlotte reported the highest year-over-year gains among the 20 cities in September. Miami led the way with a 24.6% year-over-year price increase, followed by Tampa in second with a 23.8% increase, and Charlotte in third with a 17.8% increase. All 20 cities reported lower price increases in the year ending September 2022 versus the year ending August 2022.
...
Before seasonal adjustment, the U.S. National Index posted a -1.0% month-over-month decrease in September, while the 10-City and 20-City Composites posted decreases of -1.4% and -1.5%, respectively.
After seasonal adjustment, the U.S. National Index posted a month-over-month decrease of -0.8%, and the 10-City and 20-City Composites both posted decreases of -1.2%.
In September, all 20 cities reported declines before and after seasonal adjustments.
“As has been the case for the past several months, our September 2022 report reflects short-term declines and medium-term deceleration in housing prices across the U.S.,” says Craig J. Lazzara, Managing Director at S&P DJI. “For example, the National Composite Index fell -1.0% in September, and now stands 10.6% above its year-ago level. We see comparable patterns in our 10- and 20-City Composites, which declined -1.4% and -1.5%, respectively, bringing their year-over-year gains down to 9.7% and 10.4%. For all three composites, year-over-year gains, while still well above their historical medians, peaked roughly six months ago and have decelerated since then.
emphasis added
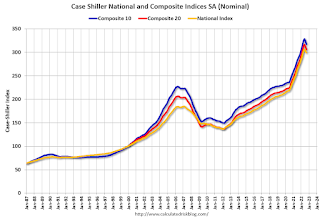 Click on graph for larger image.
 The first graph shows the nominal seasonally adjusted Composite 10, Composite 20 and National indices (the Composite 20 was started in January 2000).
The Composite 10 index is down 1.2% in September (SA).
The Composite 20 index is down 1.2% (SA) in September.
The National index is 62% above the bubble peak (SA), and down 0.8% (SA) in September. The National index is up 119% from the post-bubble low set in February 2012 (SA).
 The second graph shows the year-over-year change in all three indices.
The Composite 10 SA is up 9.7% year-over-year. The Composite 20 SA is up 10.4% year-over-year.
The National index SA is up 10.6% year-over-year.
Annual price increases were lower than expected. I'll have more later.
Monday, November 28, 2022
Tuesday: Case-Shiller House Prices
by Calculated Risk on 11/28/2022 08:47:00 PM
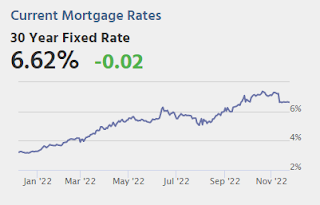
Bonds were effectively closed for a 4-day weekend starting with Thanksgiving last Thursday. True, Friday was technically open for half a day, but volume and participation were so light as to make any of the movement questionable. This is typical of any Friday after Thanksgiving.Tuesday:
The following Monday (or "today" in today's case) tends to be a transitional day with plenty of holiday vibes intact but stronger participation compared to the previous trading session. ... [30 year fixed 6.62%]
emphasis added
• At 9:00 AM ET, S&P/Case-Shiller House Price Index for September. The consensus is for a 14.4% year-over-year increase in the Composite 20 index for September.
• Also at 9:00 AM, FHFA House Price Index for September. This was originally a GSE only repeat sales, however there is also an expanded index. The 2023 Conforming loan limits will also be announced.
Join the CalculatedRisk Newsletter subscriber chat
by Calculated Risk on 11/28/2022 11:10:00 AM
Today I’m announcing the CalculatedRisk Newsletter subscriber chat.
This is a conversation space in the Substack app that is exclusively for CalculatedRisk Newsletter subscribers — kind of like a group chat or live hangout. I’ll post short prompts, thoughts, and updates that come my way, and you can jump into the discussion.
To join the chat, you’ll need to download the Substack app (messages are sent via the app, not email).
NOTE: The app is currently only available for iOS but will be available for Android and web very soon.
First, subscribe to the CalculatedRisk Newsletter.
Then download the substack app by clicking this link
Open the app and tap the Chat icon. It looks like two bubbles in the bottom bar, and you’ll see a row for my chat inside.
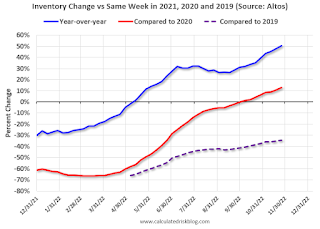
Housing November 28th Weekly Update: Inventory Decreased Slightly Week-over-week
by Calculated Risk on 11/28/2022 08:57:00 AM
 Click on graph for larger image.
This inventory graph is courtesy of Altos Research.
1. The seasonal bottom (happened on March 4, 2022, for Altos) ✅
2. Inventory up year-over-year (happened on May 20, 2022, for Altos) ✅
3. Inventory up compared to 2020 (happened on October 7, 2022, for Altos) ✅
4. Inventory up compared to 2019 (currently down 34.4%).
Mike Simonsen discusses this data regularly on Youtube.
Four High Frequency Indicators for the Economy
by Calculated Risk on 11/28/2022 08:29:00 AM
These indicators are mostly for travel and entertainment. It was interesting to watch these sectors recover as the pandemic impact subsided.
The TSA is providing daily travel numbers.
This data is as of November 27th.
 Click on graph for larger image.
This data shows the 7-day average of daily total traveler throughput from the TSA for 2019 (Light Blue), 2020 (Black), 2021 (Blue) and 2022 (Red).
The dashed line is the percent of 2019 for the seven-day average.
The 7-day average is 7.2% below the same week in 2019 (92.8% of 2019). (Dashed line)
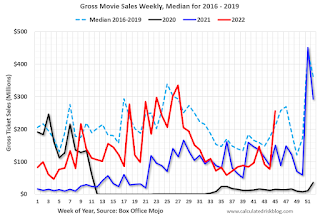 This data shows domestic box office for each week and the median for the years 2016 through 2019 (dashed light blue).
 Note that the data is usually noisy week-to-week and depends on when blockbusters are released.
Movie ticket sales were at $142 million last week, down about 45% from the median for the week.
NOTE: This is the previous week data, since hotel data wasn't released during the holiday week.
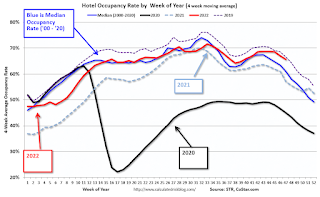 This graph shows the seasonal pattern for the hotel occupancy rate using the four-week average.
 The red line is for 2022, black is 2020, blue is the median, and dashed light blue is for 2021. Dashed purple is 2019 (STR is comparing to a strong year for hotels).
This data is through Nov 12th. The occupancy rate was up 0.9% compared to the same week in 2019.
Notes: Y-axis doesn't start at zero to better show the seasonal change.
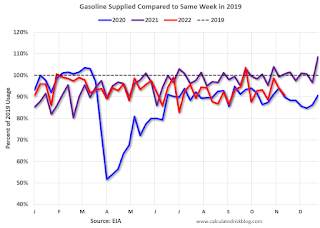
Blue is for 2020. Purple is for 2021, and Red is for 2022.
As of November 18th, gasoline supplied was down 9.4% compared to the same week in 2019.
Recently gasoline supplied has been running below 2019 and 2021 levels - and sometimes below 2020.
Sunday, November 27, 2022
Sunday Night Futures
by Calculated Risk on 11/27/2022 07:34:00 PM
Weekend:
• Schedule for Week of November 27, 2022
Monday:
• AT 10:30 AM ET, Dallas Fed Survey of Manufacturing Activity for November. This is the last of the regional Fed manufacturing surveys for November.
From CNBC: Pre-Market Data and Bloomberg futures S&P 500 are down 17 and DOW futures are down 110 (fair value).
Oil prices were down over the last week with WTI futures at $76.06 per barrel and Brent at $83.47 per barrel. A year ago, WTI was at $70, and Brent was at $73 - so WTI oil prices are up 9% year-over-year.
Here is a graph from Gasbuddy.com for nationwide gasoline prices. Nationally prices are at $3.62 per gallon. A year ago, prices were at $3.39 per gallon, so gasoline prices are up $0.23 per gallon year-over-year.
Realtor.com Reports Weekly Active Inventory Up 49% Year-over-year; New Listings Down 17%
by Calculated Risk on 11/27/2022 10:20:00 AM
Realtor.com has monthly and weekly data on the existing home market. Here is their weekly report released today from Chief Economist Danielle Hale: Weekly Housing Trends View — Data Week Ending Nov 19, 2022. Note: They have data on list prices, new listings and more, but this focus is on inventory.
• Active inventory continued to grow, increasing 49% above one year ago. Inventory accelerated again, notching a sixth straight week of growth in the yearly trend roughly at or above 2%–in this case nearly double.
...
• New listings–a measure of sellers putting homes up for sale–were again down, dropping 17% from one year ago. This marks a twentieth straight week of year over year declines in homeowners listing their home for sale, a tangible reflection of the ongoing decline in seller confidence.
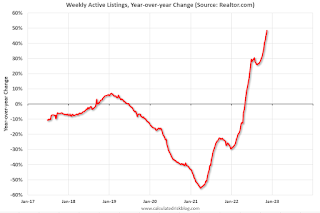 Here is a graph of the year-over-year change in inventory according to realtor.com.
 Note the rapid increase in the YoY change earlier this year, from down 30% at the beginning of the year, to up 29% YoY at the beginning of July.
Saturday, November 26, 2022
Real Estate Newsletter Articles this Week: "With rising cancellations, the Census Bureau overestimates New Home sales"
by Calculated Risk on 11/26/2022 02:11:00 PM
At the Calculated Risk Real Estate Newsletter this week:
• New Home Sales Increased in October; Completed Inventory Increased With rising cancellations, the Census Bureau overestimates sales
• Lawler: Likely "Dramatic shift" in Household Formation has "Major implications" for 2023
• Final Look at Local Housing Markets in October
• Case-Shiller, FHFA House Prices Indexes and Conforming Loan Limits will be released on Tuesday
This is usually published 4 to 6 times a week and provides more in-depth analysis of the housing market.
You can subscribe at https://calculatedrisk.substack.com/
Schedule for Week of November 27, 2022
by Calculated Risk on 11/26/2022 08:11:00 AM
The key report this week is the November employment report on Friday.
Other key indicators include the 2nd estimate of Q3 GDP, the September Case-Shiller and FHFA house price indexes, October Personal Income & Outlays (and PCE), the November ISM manufacturing index, and November vehicle sales.
Fed Chair Powell speaks on the economic outlook, inflation and the labor market on Thursday.
10:30 AM: Dallas Fed Survey of Manufacturing Activity for November. This is the last of the regional Fed manufacturing surveys for November.
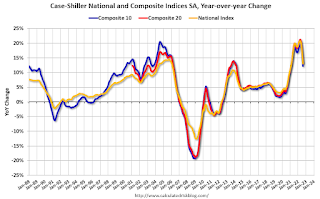 9:00 AM ET: S&P/Case-Shiller House Price Index for September.
This graph shows graph shows the Year over year change in the seasonally adjusted National Index, Composite 10 and Composite 20 indexes through the most recent report (the Composite 20 was started in January 2000).
The consensus is for a 14.4% year-over-year increase in the Composite 20 index for September.
9:00 AM: FHFA House Price Index for September. This was originally a GSE only repeat sales, however there is also an expanded index. The 2023 Conforming loan limits will also be announced.
7:00 AM ET: The Mortgage Bankers Association (MBA) will release the results for the mortgage purchase applications index.
8:15 AM: The ADP Employment Report for November. This report is for private payrolls only (no government). The consensus is for 200,000 jobs added, down from 239,000 in October.
8:30 AM: Gross Domestic Product (Second Estimate) and Corporate Profits (Preliminary), 3rd Quarter 2022. The consensus is that real GDP increased 2.7% annualized in Q3, up from the advance estimate of 2.6% in Q3.
9:45 AM: Chicago Purchasing Managers Index for November.
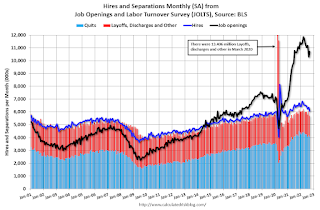 10:00 AM ET: Job Openings and Labor Turnover Survey for October from the BLS.
 This graph shows job openings (black line), hires (purple), Layoff, Discharges and other (red column), and Quits (light blue column) from the JOLTS.
Jobs openings increased in September to 10.717 million from 10.280 million in August.
10:00 AM: Pending Home Sales Index for October. The consensus is for a 5.0% decrease in the index.
1:30 PM: Speech, Fed Chair Jerome Powell, Economic Outlook, Inflation, and the Labor Market, At the Brookings Institution, 1775 Massachusetts Avenue N.W., Washington, D.C.
2:00 PM: the Federal Reserve Beige Book, an informal review by the Federal Reserve Banks of current economic conditions in their Districts.
10:30 AM: (likely) FDIC Quarterly Banking Profile, Third quarter.
8:30 AM: The initial weekly unemployment claims report will be released. The consensus is for 235 thousand initial claims, down from 240 thousand last week.
8:30 AM ET: Personal Income and Outlays, October 2022. The consensus is for a 0.4% increase in personal income, and for a 0.8% increase in personal spending. And for the Core PCE price index to increase 0.3%. PCE prices are expected to be up 6.2% YoY, and core PCE prices up 5.0% YoY.
10:00 AM: ISM Manufacturing Index for November. The consensus is for 50.0%, down from 50.2%.
10:00 AM: Construction Spending for October. The consensus is for 0.3% decrease in spending.
 All day: Light vehicle sales for November.
The consensus is for 14.9 million SAAR in November, unchanged from the BEA estimate of 14.9 million SAAR in October (Seasonally Adjusted Annual Rate).
This graph shows light vehicle sales since the BEA started keeping data in 1967. The dashed line is the current sales rate.
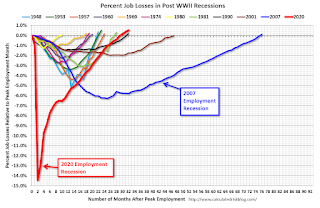 8:30 AM: Employment Report for November. The consensus is for 200,000 jobs added, and for the unemployment rate to be unchanged at 3.7%.
There were 261,000 jobs added in October, and the unemployment rate was at 3.7%.
This graph shows the job losses from the start of the employment recession, in percentage terms.
The current employment recession was by far the worst recession since WWII in percentage terms. However, as of August, all of the jobs had returned and, as of October, were 804 thousand above pre-pandemic levels.

