by Calculated Risk on 12/01/2022 10:19:00 AM
Thursday, December 01, 2022
Construction Spending Decreased 0.3% in October
From the Census Bureau reported that overall construction spending increased:
Construction spending during October 2022 was estimated at a seasonally adjusted annual rate of $1,794.9 billion, 0.3 percent below the revised September estimate of $1,800.1 billion. The October figure is 9.2 percent above the October 2021 estimate of $1,644.3 billion.Private spending decreased and public spending increased:
emphasis added
Spending on private construction was at a seasonally adjusted annual rate of $1,420.4 billion, 0.5 percent below the revised September estimate of $1,427.6 billion. ...
In October, the estimated seasonally adjusted annual rate of public construction spending was $374.6 billion, 0.6 percent above the revised September estimate of $372.5 billion.
 Click on graph for larger image.
This graph shows private residential and nonresidential construction spending, and public spending, since 1993. Note: nominal dollars, not inflation adjusted.
Residential (red) spending is 6.1% below the recent peak.
Non-residential (blue) spending is 0.8% below the recent peak.
Public construction spending is at a new peak.
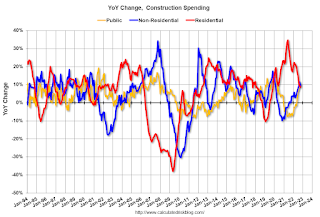
 The second graph shows the year-over-year change in construction spending.
On a year-over-year basis, private residential construction spending is up 8.6%. Non-residential spending is up 9.5% year-over-year. Public spending is up 10.0% year-over-year.
ISM® Manufacturing index Declined to 49.0% in November
by Calculated Risk on 12/01/2022 10:04:00 AM
(Posted with permission). The ISM manufacturing index indicated contraction. The PMI® was at 49.0% in November, down from 50.2% in October. The employment index was at 48.4%, down from 50.0% last month, and the new orders index was at 47.2%, down from 49.2%.
From ISM: Manufacturing PMI® at 49% November 2022 Manufacturing ISM® Report On Business®
Economic activity in the manufacturing sector contracted in November for the first time since May 2020 after 29 consecutive months of growth, say the nation's supply executives in the latest Manufacturing ISM® Report On Business®.This suggests manufacturing contracted in November. This was below the consensus forecast. Note that prices are falling.
The report was issued today by Timothy R. Fiore, CPSM, C.P.M., Chair of the Institute for Supply Management® (ISM®) Manufacturing Business Survey Committee:
“The November Manufacturing PMI® registered 49 percent, 1.2 percentage points lower than the 50.2 percent recorded in October. Regarding the overall economy, this figure indicates expansion for the 30th month in a row after contraction in April and May 2020. The Manufacturing PMI® figure is the lowest since May 2020, when it registered 43.5 percent. The New Orders Index remained in contraction territory at 47.2 percent, 2 percentage points lower than the 49.2 percent recorded in October. The Production Index reading of 51.5 percent is a 0.8-percentage point decrease compared to October’s figure of 52.3 percent. The Prices Index registered 43 percent, down 3.6 percentage points compared to the October figure of 46.6 percent; this is the index’s lowest reading since May 2020 (40.8 percent). The Backlog of Orders Index registered 40 percent, 5.3 percentage points lower than the October reading of 45.3 percent. The Employment Index returned to contraction territory (48.4 percent, down 1.6 percentage points) after being unchanged in October at 50 percent. The Supplier Deliveries Index reading of 47.2 percent is 0.4 percentage point higher than the October figure of 46.8 percent. Except for last month, the Supplier Deliveries Index hasn’t been at this level since February 2012 (47 percent). The Inventories Index registered 50.9 percent, 1.6 percentage points lower than the October reading of 52.5 percent. The New Export Orders Index reading of 48.4 percent is up 1.9 percentage points compared to October’s figure of 46.5 percent. The Imports Index dropped into contraction territory at 46.6 percent, 4.2 percentage points below the October reading of 50.8 percent.”
emphasis added
Personal Income increased 0.7% in October; Spending increased 0.8%
by Calculated Risk on 12/01/2022 08:42:00 AM
The BEA released the Personal Income and Outlays report for October:
Personal income increased $155.3 billion (0.7 percent) in October, according to estimates released today by the Bureau of Economic Analysis. Disposable personal income (DPI) increased $132.9 billion (0.7 percent) and personal consumption expenditures (PCE) increased $147.9 billion (0.8 percent).The October PCE price index increased 6.0 percent year-over-year (YoY), down from 6.3 percent YoY in September.
The PCE price index increased 0.3 percent. Excluding food and energy, the PCE price index increased 0.2 percent. Real DPI increased 0.4 percent in October and Real PCE increased 0.5 percent; goods increased 1.1 percent and services increased 0.2 percent.
emphasis added
The following graph shows real Personal Consumption Expenditures (PCE) through October 2022 (2012 dollars). Note that the y-axis doesn't start at zero to better show the change.
 Click on graph for larger image.
The dashed red lines are the quarterly levels for real PCE.
Personal income was above expectations, and the increase in PCE was at expectations.
Weekly Initial Unemployment Claims decrease to 225,000
by Calculated Risk on 12/01/2022 08:34:00 AM
The DOL reported:
In the week ending November 26, the advance figure for seasonally adjusted initial claims was 225,000, a decrease of 16,000 from the previous week's revised level. The previous week's level was revised up by 1,000 from 240,000 to 241,000. The 4-week moving average was 228,750, an increase of 1,750 from the previous week's revised average. The previous week's average was revised up by 250 from 226,750 to 227,000.The following graph shows the 4-week moving average of weekly claims since 1971.
emphasis added
 Click on graph for larger image.
The dashed line on the graph is the current 4-week average. The four-week average of weekly unemployment claims increased to 228,750.
The previous week was revised up.
Weekly claims were lower than the consensus forecast.
Wednesday, November 30, 2022
Thursday: Personal Income & Outlays, Unemployment Claims, ISM Mfg, Construction Spending, Vehicle Sales
by Calculated Risk on 11/30/2022 08:54:00 PM

Thursday:
• At 8:30 AM ET, The initial weekly unemployment claims report will be released. The consensus is for 235 thousand initial claims, down from 240 thousand last week.
• Also, at 8:30 AM, Personal Income and Outlays, October 2022. The consensus is for a 0.4% increase in personal income, and for a 0.8% increase in personal spending. And for the Core PCE price index to increase 0.3%. PCE prices are expected to be up 6.2% YoY, and core PCE prices up 5.0% YoY.
• At 10:00 AM, ISM Manufacturing Index for November. The consensus is for 50.0%, down from 50.2%.
• Also, at 10:00 AM, Construction Spending for October. The consensus is for 0.3% decrease in spending.
• All day: Light vehicle sales for November. The consensus is for 14.9 million SAAR in November, unchanged from the BEA estimate of 14.9 million SAAR in October (Seasonally Adjusted Annual Rate).
Fed's Beige Book: "Apartment leasing started to slow"
by Calculated Risk on 11/30/2022 04:41:00 PM
Fed's Beige Book "This report was prepared at the Federal Reserve Bank of Boston based on information collected on or before November 23rd, 2022."
Economic activity was about flat or up slightly since the previous report, down from the modest average pace of growth in the prior Beige Book period. Five Districts reported slight or modest gains in activity, and the rest experienced either no change or slight-to-modest declines. Interest rates and inflation continued to weigh on activity, and many contacts expressed greater uncertainty or increased pessimism concerning the outlook. Nonauto consumer spending was mixed but, on balance, eked out slight gains. Inflation pushed low-to-moderate income consumers to substitute increasingly to lower-priced goods. Travel and tourism contacts, by contrast, reported moderate gains in activity, as restaurants and high-end hospitality venues enjoyed robust demand. Auto sales declined slightly on average, but sales increased significantly in a few Districts in response to higher inventories. Manufacturing activity was mixed across Districts but up slightly on average. Demand for nonfinancial services was flat overall but softened in some Districts. Higher interest rates further dented home sales, which declined at a moderate pace overall but fell steeply in some Districts; apartment leasing started to slow, as well. Residential construction slid further at a modest pace, while nonresidential construction was mixed but down slightly on average. Commercial leasing weakened slightly, and office vacancies edged up. Bank lending saw modest further declines amid increasingly weak demand and tightening credit standards. Agricultural conditions were flat or up a bit, and energy sector activity increased slightly on balance.
Employment grew modestly in most districts, but two Districts reported flat headcounts and labor demand weakened overall. Hiring and retention difficulties eased further, although labor markets were still described as tight. Scattered layoffs were reported in the technology, finance, and real estate sectors.
emphasis added
Fed Chair Powell: "The time for moderating the pace of rate increases may come as soon as the December meeting"
by Calculated Risk on 11/30/2022 01:38:00 PM
From Fed Chair Powell: Inflation and the Labor Market. Excerpts:
Today I will offer a progress report on the Federal Open Market Committee's (FOMC) efforts to restore price stability to the U.S. economy for the benefit of the American people. The report must begin by acknowledging the reality that inflation remains far too high. My colleagues and I are acutely aware that high inflation is imposing significant hardship, straining budgets and shrinking what paychecks will buy. This is especially painful for those least able to meet the higher costs of essentials like food, housing, and transportation. Price stability is the responsibility of the Federal Reserve and serves as the bedrock of our economy. Without price stability, the economy does not work for anyone. In particular, without price stability, we will not achieve a sustained period of strong labor market conditions that benefit all.
...
Housing services inflation measures the rise in the price of all rents and the rise in the rental-equivalent cost of owner-occupied housing. Unlike goods inflation, housing services inflation has continued to rise and now stands at 7.1 percent over the past 12 months. Housing inflation tends to lag other prices around inflation turning points, however, because of the slow rate at which the stock of rental leases turns over.2 The market rate on new leases is a timelier indicator of where overall housing inflation will go over the next year or so. Measures of 12-month inflation in new leases rose to nearly 20 percent during the pandemic but have been falling sharply since about midyear (figure 3).
As figure 3 shows, however, overall housing services inflation has continued to rise as existing leases turn over and jump in price to catch up with the higher level of rents for new leases. This is likely to continue well into next year. But as long as new lease inflation keeps falling, we would expect housing services inflation to begin falling sometime next year. Indeed, a decline in this inflation underlies most forecasts of declining inflation.
...
Returning to monetary policy, my FOMC colleagues and I are strongly committed to restoring price stability. After our November meeting, we noted that we anticipated that ongoing rate increases will be appropriate in order to attain a policy stance that is sufficiently restrictive to move inflation down to 2 percent over time.
Monetary policy affects the economy and inflation with uncertain lags, and the full effects of our rapid tightening so far are yet to be felt. Thus, it makes sense to moderate the pace of our rate increases as we approach the level of restraint that will be sufficient to bring inflation down. The time for moderating the pace of rate increases may come as soon as the December meeting. Given our progress in tightening policy, the timing of that moderation is far less significant than the questions of how much further we will need to raise rates to control inflation, and the length of time it will be necessary to hold policy at a restrictive level. It is likely that restoring price stability will require holding policy at a restrictive level for some time. History cautions strongly against prematurely loosening policy. We will stay the course until the job is done.
emphasis added
Inflation Adjusted House Prices 3.3% Below Peak
by Calculated Risk on 11/30/2022 10:48:00 AM
Today, in the Calculated Risk Real Estate Newsletter: Inflation Adjusted House Prices 3.3% Below Peak
Excerpt:
It has been over 16 years since the bubble peak. In the Case-Shiller release yesterday, the seasonally adjusted National Index (SA), was reported as being 62% above the bubble peak in 2006. However, in real terms, the National index (SA) is about 12% above the bubble peak (and historically there has been an upward slope to real house prices). The composite 20, in real terms, is about 3% above the bubble peak.
Both indexes have declined for four consecutive months in real terms (inflation adjusted).
People usually graph nominal house prices, but it is also important to look at prices in real terms. As an example, if a house price was $200,000 in January 2000, the price would be almost $338,000 today adjusted for inflation (69% increase). That is why the second graph below is important - this shows "real" prices. ...
The second graph shows the same two indexes in real terms (adjusted for inflation using CPI less Shelter). Note: some people use other inflation measures to adjust for real prices. In real terms, the National index is 3.3% below the recent peak, and the Composite 20 index is 4.4% below the recent peak in 2022.
In real terms, house prices are still above the bubble peak levels. There is an upward slope to real house prices, and it has been over 16 years since the previous peak, but real prices are historically high.
NAR: Pending Home Sales Decreased 4.6% in October, Year-over-year Down 37%
by Calculated Risk on 11/30/2022 10:11:00 AM
From the NAR: Pending Home Sales Declined 4.6% in October
Pending home sales slid for the fifth consecutive month in October, according to the National Association of REALTORS®. Three of four U.S. regions recorded month-over-month decreases, and all four regions recorded year-over-year declines in transactions.This was close to the expected decline for this index. Note: Contract signings usually lead sales by about 45 to 60 days, so this would usually be for closed sales in November and December.
The Pending Home Sales Index (PHSI), a forward-looking indicator of home sales based on contract signings, sank 4.6% to 77.1 in October. Year-over-year, pending transactions slipped by 37.0%. An index of 100 is equal to the level of contract activity in 2001.
"October was a difficult month for home buyers as they faced 20-year-high mortgage rates," said NAR Chief Economist Lawrence Yun. "The West region, in particular, suffered from the combination of high interest rates and expensive home prices. Only the Midwest squeaked out a gain."
"The upcoming months should see a return of buyers, as mortgage rates appear to have already peaked and have been coming down since mid-November."
...
The Northeast PHSI sank 4.3% from last month to 68.7, a fall of 29.5% from October 2021. The Midwest index increased 3.3% to 83.5 in October, a decrease of 32.1% from one year ago.
The South PHSI dropped 6.4% to 90.6 in October, falling 38.2% from the prior year. The West index slipped by 11.3% in October to 55.6, sinking 46.2% from October 2021.
emphasis added
BLS: Job Openings Decreased to 10.3 million in October
by Calculated Risk on 11/30/2022 10:06:00 AM
From the BLS: Job Openings and Labor Turnover Summary
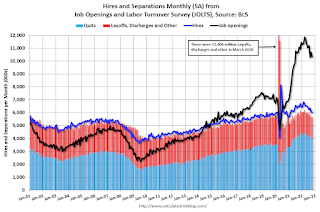
The number of job openings edged down to 10.3 million on the last business day of October, the U.S. Bureau of Labor Statistics reported today. Over the month the number of hires and total separations changed little at 6.0 million and 5.7 million, respectively. Within separations, quits (4.0 million) and layoffs and discharges (1.4 million) changed little.The following graph shows job openings (black line), hires (dark blue), Layoff, Discharges and other (red column), and Quits (light blue column) from the JOLTS.
emphasis added
This series started in December 2000.
Note: The difference between JOLTS hires and separations is similar to the CES (payroll survey) net jobs headline numbers. This report is for October the employment report this Friday will be for November.
 Click on graph for larger image.
Note that hires (dark blue) and total separations (red and light blue columns stacked) are usually pretty close each month. This is a measure of labor market turnover. When the blue line is above the two stacked columns, the economy is adding net jobs - when it is below the columns, the economy is losing jobs.
The spike in layoffs and discharges in March 2020 is labeled, but off the chart to better show the usual data.
Jobs openings decreased in October to 10.334 million from 10.687 million in September.
The number of job openings (black) were down 7% year-over-year.
Quits were down 3% year-over-year. These are voluntary separations. (See light blue columns at bottom of graph for trend for "quits").


