 RSS Feed
 by Calculated Risk on 1/07/2023 02:11:00 PM
Saturday, January 07, 2023
Real Estate Newsletter Articles this Week: Early reports suggest NAR reported December sales could be lowest since 2010
At the Calculated Risk Real Estate Newsletter this week:
• 1st Look at Local Housing Markets in December Early reports suggest NAR reported sales could be lowest since 2010.
• Rents Continue to Decline More than Seasonally Normal
• Moody's: National Multifamily Supply and Demand at Lowest Levels since 2009
• Question #8 for 2023: How much will Residential investment change in 2023? How about housing starts and new home sales in 2023?
• Question #9 for 2023: What will happen with house prices in 2023?
This is usually published 4 to 6 times a week and provides more in-depth analysis of the housing market.
You can subscribe at https://calculatedrisk.substack.com/
Most content is available for free (and no Ads), but please subscribe!
Schedule for Week of January 8, 2023
by Calculated Risk on 1/07/2023 08:11:00 AM
The key reports this week is December CPI.
No major economic releases scheduled.
6:00 AM: NFIB Small Business Optimism Index for December.
9:00 AM: Discussion, Fed Chair Jerome Powell, Central Bank Independence, At the Sveriges Riksbank International Symposium on Central Bank Independence, Stockholm, Sweden
7:00 AM ET: The Mortgage Bankers Association (MBA) will release the results for the mortgage purchase applications index.
8:30 AM: The initial weekly unemployment claims report will be released. The consensus is for 220 thousand initial claims, up from 204 thousand last week.
8:30 AM: The Consumer Price Index for December from the BLS. The consensus is for 0,1% increase in CPI, and a 0.3% increase in core CPI. The consensus is for CPI to be up 6.5% year-over-year and core CPI to be up 5.7% YoY.
10:00 AM: University of Michigan's Consumer sentiment index (Preliminary for January).
Friday, January 06, 2023
COVID Jan 6, 2023: Update on Cases, Hospitalizations and Deaths
by Calculated Risk on 1/06/2023 08:45:00 PM
On COVID (focus on hospitalizations and deaths). Data is now weekly.
| COVID Metrics | ||||
|---|---|---|---|---|
| Now | Week Ago | Goal | ||
| New Cases per Week2🚩 | 470,699 | 404,932 | ≤35,0001 | |
| Hospitalized2🚩 | 39,688 | 34,884 | ≤3,0001 | |
| Deaths per Week2🚩 | 2,731 | 2,522 | ≤3501 | |
| 1my goals to stop weekly posts, 2Weekly for Cases, Currently Hospitalized, and Deaths 🚩 Increasing number weekly for Cases, Hospitalized, and Deaths ✅ Goal met. | ||||
 Click on graph for larger image.
This graph shows the weekly (columns) number of deaths reported.
January was the worst month for the previous two years, and hopefully this January will not see a significant wave.
Annual Vehicle Sales decrease 8% in 2022; Heavy Trucks Sales up 2% YoY
by Calculated Risk on 1/06/2023 03:09:00 PM
The BEA released their estimate of light vehicle sales for December. The BEA estimates sales of 13.31 million SAAR in December 2022 (Seasonally Adjusted Annual Rate), down 6.3% from the November sales rate, and up 4.7% from December 2021.
 Click on graph for larger image.
The first graph shows annual sales since 1976.
Light vehicle sales in 2022 were at 13.73 million, down 8.1% from 14.95 million in 2021.
Sales in 2022 were impacted significantly by supply chain disruptions, and sales were still down 19% from the 2019 level.
This suggests vehicle sales might increase in 2023 even with higher rates and a soft economy.
The second graph shows heavy truck sales since 1967 using data from the BEA. The dashed line is the December 2022 seasonally adjusted annual sales rate (SAAR).
Heavy truck sales really collapsed during the great recession, falling to a low of 180 thousand SAAR in May 2009. Then heavy truck sales increased to a new all-time high of 570 thousand SAAR in April 2019.
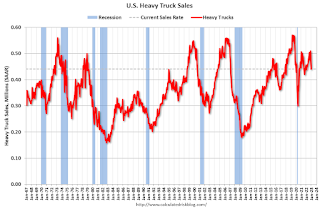 Note: "Heavy trucks - trucks more than 14,000 pounds gross vehicle weight."
Heavy truck sales declined sharply at the beginning of the pandemic, falling to a low of 308 thousand SAAR in May 2020.
Heavy truck sales were at 441 thousand SAAR in December, down from 510 thousand in November, and down 3.5% from 456 thousand SAAR in December 2021.
On annual basis, sales in 2022 were at 470 thousand, up 1.8% from 462 thousand in 2021.
Usually, heavy truck sales decline sharply prior to a recession. Sales were decent in December.
1st Look at Local Housing Markets in December
by Calculated Risk on 1/06/2023 12:41:00 PM
Today, in the Calculated Risk Real Estate Newsletter:
1st Look at Local Housing Markets in December
A brief excerpt:
This is the first look at local markets in December. I’m tracking about 40 local housing markets in the US. Some of the 40 markets are states, and some are metropolitan areas. I’ll update these tables throughout the month as additional data is released.There is much more in the article. You can subscribe at https://calculatedrisk.substack.com/
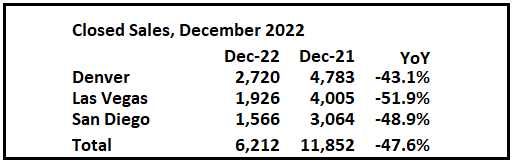
Closed sales in December were mostly for contracts signed in October and November. Since 30-year fixed mortgage rates were over 7% for most of October (no points) and averaged 6.8% in November (Freddie PMMS with points) closed sales were probably impacted significantly in December.
...
Median sales prices were unchanged year-over-year in Denver and Las Vegas, and up only 2% in San Diego.
...
In December, sales were down 47.6%. In November, these same markets were down 48.3% YoY Not Seasonally Adjusted (NSA).
Note that in December 2022, there were the same number of selling days as in December 2021, so the SA decline will be similar to the NSA decline. This is a similar YoY decline as in November for these early reporting markets. If national sales decline by the same percent as last month, the NAR will report sales for December under 4.0 million SAAR - below the 4.01 million in May 2020 (pandemic low) and the lowest sales rate since 2010.
Many more local markets to come!
Comments on December Employment Report
by Calculated Risk on 1/06/2023 09:26:00 AM
With 4.50 million jobs added, 2022 was the 2nd best year for job growth in US history behind only 2021 with 6.74 million.
The headline jobs number in the December employment report was above expectations, however employment for the previous two months was revised down by 28,000, combined. The participation rate increased, and the unemployment rate decreased to 3.5%. Another solid report.
Leisure and hospitality gained 67 thousand jobs in December. At the beginning of the pandemic, in March and April of 2020, leisure and hospitality lost 8.2 million jobs, and are now down 932 thousand jobs since February 2020. So, leisure and hospitality has now added back about 89% all of the jobs lost in March and April 2020.
Construction employment increased 28 thousand and is now 153 thousand above the pre-pandemic level.
Manufacturing added 8 thousand jobs and is now 149 thousand above the pre-pandemic level.
In December, the year-over-year employment change was 4.50 million jobs.
Seasonal Retail Hiring
Typically, retail companies start hiring for the holiday season in October, and really increase hiring in November. Here is a graph that shows the historical net retail jobs added for October, November and December by year.
 This graph really shows the collapse in retail hiring in 2008. Since then, seasonal hiring had increased back close to more normal levels. However, seasonal retail hiring was down in 2022.
Note: I expect the long-term trend will be down with more and more internet holiday shopping.
Retailers hired 98 thousand workers Not Seasonally Adjusted (NSA) net in December.
Retailers hired 98 thousand workers Not Seasonally Adjusted (NSA) net in December.
This was seasonally adjusted (SA) to a gain of 9.0 thousand jobs in December.
Prime (25 to 54 Years Old) Participation
 Since the overall participation rate is impacted by both cyclical (recession) and demographic (aging population, younger people staying in school) reasons, here is the employment-population ratio for the key working age group: 25 to 54 years old.
The 25 to 54 participation rate increased in December to 82.4% from 82.3% in November, and the 25 to 54 employment population ratio increased to 80.1% from 79.7% the previous month.
Both are close to the pre-pandemic levels and indicate almost all of the prime age workers have returned to the labor force.
Part Time for Economic Reasons
 From the BLS report:
These workers are included in the alternate measure of labor underutilization (U-6) that decreased to 6.5% from 6.7% in the previous month. This is down from the record high in April 22.9% and is the lowest level on record (seasonally adjusted) (series started in 1994). This measure is below the level in February 2020 (pre-pandemic).
Unemployed over 26 Weeks
 This graph shows the number of workers unemployed for 27 weeks or more.
According to the BLS, there are 1.069 million workers who have been unemployed for more than 26 weeks and still want a job, down from 1.215 million the previous month.
This is below pre-pandemic levels.
Summary:
The headline monthly jobs number was above expectations; however, employment for the previous two months was revised down by 28,000, combined.
Part Time for Economic Reasons
 From the BLS report:
"The number of persons employed part time for economic reasons, at 3.9 million, changed little in December. These individuals, who would have preferred full-time employment, were working part time because their hours had been reduced or they were unable to find full-time jobs."The number of persons working part time for economic reasons increased in December to 3.878 million from 3.688 million in November. This is below pre-recession levels.
These workers are included in the alternate measure of labor underutilization (U-6) that decreased to 6.5% from 6.7% in the previous month. This is down from the record high in April 22.9% and is the lowest level on record (seasonally adjusted) (series started in 1994). This measure is below the level in February 2020 (pre-pandemic).
Unemployed over 26 Weeks
 This graph shows the number of workers unemployed for 27 weeks or more.
 According to the BLS, there are 1.069 million workers who have been unemployed for more than 26 weeks and still want a job, down from 1.215 million the previous month.
This is below pre-pandemic levels.
Summary:
The headline monthly jobs number was above expectations; however, employment for the previous two months was revised down by 28,000, combined.
The headline unemployment rate decreased to 3.5%, and U-6 declined to a record low at 6.5%.
Overall, this was another solid employment report - and a strong year of job gains.
December Employment Report: 223 thousand Jobs, 3.5% Unemployment Rate
by Calculated Risk on 1/06/2023 08:43:00 AM
From the BLS:
Total nonfarm payroll employment increased by 223,000 in December, and the unemployment rate edged down to 3.5 percent, the U.S. Bureau of Labor Statistics reported today. Notable job gains occurred in leisure and hospitality, health care, construction, and social assistance.
...
The change in total nonfarm payroll employment for October was revised down by 21,000, from +284,000 to +263,000, and the change for November was revised down by 7,000, from +263,000 to +256,000. With these revisions, employment gains in October and November combined were 28,000 lower than previously reported.
emphasis added
 Click on graph for larger image.
The first graph shows the job losses from the start of the employment recession, in percentage terms.
The current employment recession was by far the worst recession since WWII in percentage terms.
However, as of August 2022, the total number of jobs had returned and are now 1.24 million above pre-pandemic levels. I'll post this graph through the January 2023 report (includes the annual revision).
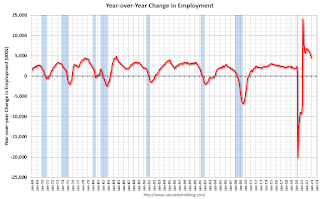 The second graph shows the year-over-year change in total non-farm employment since 1968.
In December, the year-over-year change was 4.53 million jobs. Employment was up significantly year-over-year.
Total payrolls increased by 223 thousand in December. Private payrolls increased by 220 thousand, and public payrolls increased 3 thousand.
Payrolls for October and November were revised down 28 thousand, combined.
The third graph shows the employment population ratio and the participation rate.
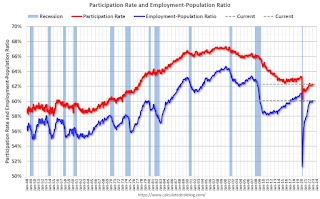 The Labor Force Participation Rate increased to 62.3% in December, from 62.2% in November. This is the percentage of the working age population in the labor force.
The Employment-Population ratio increased to 60.1% from 59.9% (blue line).
I'll post the 25 to 54 age group employment-population ratio graph later.
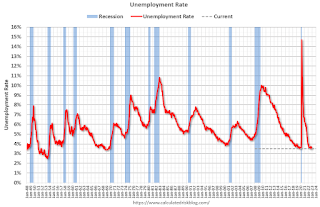 The fourth graph shows the unemployment rate.
The unemployment rate was decreased in December to 3.5% from 3.6% in November.
This was above consensus expectations; however, October and November payrolls were revised down by 28,000 combined.
 The second graph shows the year-over-year change in total non-farm employment since 1968.
In December, the year-over-year change was 4.53 million jobs. Employment was up significantly year-over-year.
Total payrolls increased by 223 thousand in December. Private payrolls increased by 220 thousand, and public payrolls increased 3 thousand.
Payrolls for October and November were revised down 28 thousand, combined.
The third graph shows the employment population ratio and the participation rate.
 The Labor Force Participation Rate increased to 62.3% in December, from 62.2% in November. This is the percentage of the working age population in the labor force.
 The Employment-Population ratio increased to 60.1% from 59.9% (blue line).
I'll post the 25 to 54 age group employment-population ratio graph later.
 The fourth graph shows the unemployment rate.
 The unemployment rate was decreased in December to 3.5% from 3.6% in November.
This was above consensus expectations; however, October and November payrolls were revised down by 28,000 combined.
I'll have more later ...
Thursday, January 05, 2023
Friday: Employment Report
by Calculated Risk on 1/05/2023 08:53:00 PM
 Note: Mortgage rates are from MortgageNewsDaily.com and are for top tier scenarios.
Friday:
• At 8:30 AM ET, Employment Report for November. The consensus is for 200,000 jobs added, and for the unemployment rate to be unchanged at 3.7%.
• At 10:00 AM, the ISM Services Index for December.
Goldman December Payrolls Preview
by Calculated Risk on 1/05/2023 05:25:00 PM
A few brief excerpts from a note by Goldman Sachs economist Spencer Hill:
We estimate nonfarm payrolls rose by 225k in December (mom sa) ... We estimate the unemployment rate was unchanged at 3.7% ... We estimate a 0.35% increase in average hourly earnings (mom sa) that lowers the year-on-year rate to 4.95%
emphasis added
December Employment Preview
by Calculated Risk on 1/05/2023 02:10:00 PM
On Friday at 8:30 AM ET, the BLS will release the employment report for December. The consensus is for 200,000 jobs added, and for the unemployment rate to be unchanged at 3.7%.
 Click on graph for larger image.
• First, as of November there were 1.044 million more jobs than in February 2020 (the month before the pandemic).
This graph shows the job losses from the start of the employment recession, in percentage terms. As of August 2022, the total number of jobs had returned.
This doesn't include the preliminary benchmark revision that showed there were 462 thousand more jobs than originally reported in March 2022.
• ADP Report: The ADP employment report showed 235,000 private sector jobs were added in December. This is the fifth release of ADP's new methodology, and this suggests job gains above consensus expectations.
• ISM Surveys: Note that the ISM indexes are diffusion indexes based on the number of firms hiring (not the number of hires). The ISM® manufacturing employment index increased in December to 51.4%, up from 48.4% last month. This would suggest the number of manufacturing jobs was mostly unchanged in December.
The ISM® services employment index for December has not been released yet.
• Unemployment Claims: The weekly claims report showed a decrease in the number of initial unemployment claims during the reference week (includes the 12th of the month) from 223,000 in November to 216,000 in December. This would usually suggest fewer layoffs in December than in November. In general, weekly claims were close to expectations in December.
• COVID: As far as the pandemic, the number of weekly cases during the reference week in December was around 458,000, up sharply from 281,000 in November.
• Conclusion: The consensus is for job growth to slow to 200,000 jobs added in November. The ADP report was above expectations, and ISM manufacturing and weekly claims were slightly positive. My guess is the report will be above consensus.


