 RSS Feed
 by Calculated Risk on 1/08/2023 07:09:00 PM
Sunday, January 08, 2023
Sunday Night Futures
Weekend:
• Schedule for Week of January 8, 2023
Monday:
• No major economic releases scheduled.
From CNBC: Pre-Market Data and Bloomberg futures S&P 500 are up 6, and DOW futures are up 39 (fair value).
Oil prices were down over the last week with WTI futures at $73.77 per barrel and Brent at $78.57 per barrel. A year ago, WTI was at $79, and Brent was at $82 - so WTI oil prices are DOWN 6% year-over-year.
Here is a graph from Gasbuddy.com for nationwide gasoline prices. Nationally prices are at $3.28 per gallon. A year ago, prices were at $3.27 per gallon, so gasoline prices are up $0.01 per gallon year-over-year.
Question #6 for 2023: What will the Fed Funds rate be in December 2023?
by Calculated Risk on 1/08/2023 12:22:00 PM
Earlier I posted some questions on my blog for next year: Ten Economic Questions for 2023. Some of these questions concern real estate (inventory, house prices, housing starts, new home sales), and I’ll post thoughts on those in the newsletter (others like GDP and employment will be on this blog).
I'm adding some thoughts, and maybe some predictions for each question.
6) Monetary Policy: In response to the increase in inflation, the FOMC raised the federal funds rate from "0 to 1/4 percent" in January 2022, to "4-1/4 to 4-1/2 percent" in December. A majority of FOMC participants expect three or even four 25 bp rate hikes in 2023. What will the Fed Funds rate be in December 2023?
Fed Chair Jay Powell and rest of the FOMC are still hawkish. For example, from Neel Kashkari, President of the Federal Reserve Bank of Minneapolis spoke on January 4, 2023: Why We Missed On Inflation, and Implications for Monetary Policy Going Forward . He is expecting 4 more rate 25bp rate hikes in 2023:
"In my view, however, it will be appropriate to continue to raise rates at least at the next few meetings until we are confident inflation has peaked.And Wall Street economists are expecting three or more rate hikes this year. From Goldman Sachs on January 6, 2023:
Once we reach that point, then the second step of our inflation fighting process, as I see it, will be pausing to let the tightening we have already done work its way through the economy. I have us pausing at 5.4 percent ..."
"We continue to expect 25bp fed funds rate hikes each in February, March, and May. We continue to expect no rate cuts in 2023."From BofA on Jan 6, 2023:
"We continue to expect the Fed to lift the target range to 5.0-5.25% early this year, a view that the Fed appeared to tentatively endorse. We expect a 50bp rate hike in February and 25bp increase in March."
As of December, looking at the "dot plot", the FOMC participants see the following number of rate hikes in 2023:
| 25 bp Rate Hikes | FOMC Members 2023 |
|---|---|
| No Change | 0 |
| One Rate Hike | 0 |
| Two Rate Hikes | 2 |
| Three Rate Hikes | 10 |
| Four Rate Hikes | 5 |
| Five Rate Hikes | 2 |
Clearly the main view of the FOMC is three or even four rate hikes in 2023.
Recently there has been discussion of the monetary lag being short (hawkish). For example, from economists Taeyoung Doh and Andrew T. Foerster at the Kansas City Fed: Have Lags in Monetary Policy Transmission Shortened?
And from Goldman Sachs: In summary, we find evidence for a shorter lag in the peak response of inflation to a policy shock in the post-2009 period even after we adjust the shock definition to incorporate forward guidance and balance sheet policy.
There are two reasons why we believe the lags from monetary policy to growth are short while many others believe they are long. First, in our framework a tightening in financial conditions starts to affect the economy when financial markets react to expected policy changes instead of when rate hikes are delivered. Second, many commentators confuse lags from monetary policy to GDP growth with lags to GDP levels.However, employment changes still lag policy. How many construction jobs have been lost so far? None. In fact, construction employment is at an all-time high since there are a record number of housing units under construction! These job losses are already in train with a longer than normal lag due to supply chain issues, and this will increase unemployment and slow wage growth.
The next FOMC meeting ends on February 1st, and it appears the Fed is poised to raise rates 25 bp at this meeting (maybe even 50 bp). However, based on slowing wage growth, core inflation ex-shelter already being negative for two consecutive months, and overall inflation slowing quickly, I think there will be fewer increases this year than most analysts currently expect. My guess is there will be around 2 rate hikes in 2023, and if there are more, the FOMC will be under pressure later in 2023 to cut rates putting the Fed Funds rate under 5% at the end of 2023.
Here are the Ten Economic Questions for 2023 and a few predictions:
• Question #1 for 2023: How much will the economy grow in 2023? Will there be a recession in 2023?
• Question #2 for 2023: How much will job growth slow in 2023? Or will the economy lose jobs?
• Question #3 for 2023: What will the unemployment rate be in December 2023?
• Question #4 for 2023: What will the participation rate be in December 2023?
• Question #5 for 2023: What will the YoY core inflation rate be in December 2023?
• Question #6 for 2023: What will the Fed Funds rate be in December 2023?
• Question #7 for 2023: How much will wages increase in 2023?
• Question #8 for 2023: How much will Residential investment change in 2023? How about housing starts and new home sales in 2023?
• Question #9 for 2023: What will happen with house prices in 2023?
• Question #10 for 2023: Will inventory increase further in 2023?
Question #7 for 2023: How much will wages increase in 2023?
by Calculated Risk on 1/08/2023 09:39:00 AM
Earlier I posted some questions on my blog for next year: Ten Economic Questions for 2023. Some of these questions concern real estate (inventory, house prices, housing starts, new home sales), and I’ll post thoughts on those in the newsletter (others like GDP and employment will be on this blog).
I'm adding some thoughts, and maybe some predictions for each question.
7) Wage Growth: Wage growth was strong in 2022 (up 5.1% year-over-year as of November). How much will wages increase in 2023?
The most followed wage indicator is the “Average Hourly Earnings” from the Current Employment Statistics (CES) (aka "Establishment") monthly employment report.
 Click on graph for larger image.
The graph shows the nominal year-over-year change in "Average Hourly Earnings" for all private employees. There was a huge increase at the beginning of the pandemic as lower paid employees were let go, and then the pandemic related spike reversed a year later.
Real wage growth has trended down after peaking at 5.6% YoY in March 2022 and was at 4.6% YoY in December 2022.
There are two quarterly sources for earnings data: 1) “Hourly Compensation,” from the BLS’s Productivity and Costs; and 2) the Employment Cost Index which includes wage/salary and benefit compensation. All three data series are different, and most of the focus recently has been the CES series (used in the graph above).
By following wage changes for individuals, this removes the demographic composition effects (older workers who are retiring tend to be higher paid, and younger workers just entering the workforce tend to be lower paid).
The Atlanta Fed Wage tracker showed nominal wage growth increased sharply in 2021 and for most of 2022. In November 2022, the smoothed 3-month average wage growth was at 6.4% year-over-year, down from 6.7% earlier in the year.
This graph from Indeed, shows posted wage growth.
The Wage Tracker shows US posted wages grew in November at a robust 6.5% year-over-year pace, up from 3.1% in November 2019.Clearly wage growth is slowing and I expect to see some further decreases in both the Average hourly earnings from the CES, and in the Atlanta Fed Wage Tracker. My sense is nominal wages will increase in the 3.0% to 3.5% YoY range in 2023 according to the CES. This depends on the Fed (next question) and if the economy slides into a recession.
Nevertheless, year-over-year posted wage growth has declined substantially in recent months, falling from a peak of 9% in March 2022, a signal employers now face less-steep competition for new hires.
The deceleration is broad-based, with wage growth in 82% of job sectors lower in November than six months earlier.
emphasis added
Here are the Ten Economic Questions for 2023 and a few predictions:
• Question #1 for 2023: How much will the economy grow in 2023? Will there be a recession in 2023?
• Question #2 for 2023: How much will job growth slow in 2023? Or will the economy lose jobs?
• Question #3 for 2023: What will the unemployment rate be in December 2023?
• Question #4 for 2023: What will the participation rate be in December 2023?
• Question #5 for 2023: What will the YoY core inflation rate be in December 2023?
• Question #6 for 2023: What will the Fed Funds rate be in December 2023?
• Question #7 for 2023: How much will wages increase in 2023?
• Question #8 for 2023: How much will Residential investment change in 2023? How about housing starts and new home sales in 2023?
• Question #9 for 2023: What will happen with house prices in 2023?
• Question #10 for 2023: Will inventory increase further in 2023?
Saturday, January 07, 2023
Real Estate Newsletter Articles this Week: Early reports suggest NAR reported December sales could be lowest since 2010
by Calculated Risk on 1/07/2023 02:11:00 PM
At the Calculated Risk Real Estate Newsletter this week:
• 1st Look at Local Housing Markets in December Early reports suggest NAR reported sales could be lowest since 2010.
• Rents Continue to Decline More than Seasonally Normal
• Moody's: National Multifamily Supply and Demand at Lowest Levels since 2009
• Question #8 for 2023: How much will Residential investment change in 2023? How about housing starts and new home sales in 2023?
• Question #9 for 2023: What will happen with house prices in 2023?
This is usually published 4 to 6 times a week and provides more in-depth analysis of the housing market.
You can subscribe at https://calculatedrisk.substack.com/
Most content is available for free (and no Ads), but please subscribe!
Schedule for Week of January 8, 2023
by Calculated Risk on 1/07/2023 08:11:00 AM
The key reports this week is December CPI.
No major economic releases scheduled.
6:00 AM: NFIB Small Business Optimism Index for December.
9:00 AM: Discussion, Fed Chair Jerome Powell, Central Bank Independence, At the Sveriges Riksbank International Symposium on Central Bank Independence, Stockholm, Sweden
7:00 AM ET: The Mortgage Bankers Association (MBA) will release the results for the mortgage purchase applications index.
8:30 AM: The initial weekly unemployment claims report will be released. The consensus is for 220 thousand initial claims, up from 204 thousand last week.
8:30 AM: The Consumer Price Index for December from the BLS. The consensus is for 0,1% increase in CPI, and a 0.3% increase in core CPI. The consensus is for CPI to be up 6.5% year-over-year and core CPI to be up 5.7% YoY.
10:00 AM: University of Michigan's Consumer sentiment index (Preliminary for January).
Friday, January 06, 2023
COVID Jan 6, 2023: Update on Cases, Hospitalizations and Deaths
by Calculated Risk on 1/06/2023 08:45:00 PM
On COVID (focus on hospitalizations and deaths). Data is now weekly.
| COVID Metrics | ||||
|---|---|---|---|---|
| Now | Week Ago | Goal | ||
| New Cases per Week2🚩 | 470,699 | 404,932 | ≤35,0001 | |
| Hospitalized2🚩 | 39,688 | 34,884 | ≤3,0001 | |
| Deaths per Week2🚩 | 2,731 | 2,522 | ≤3501 | |
| 1my goals to stop weekly posts, 2Weekly for Cases, Currently Hospitalized, and Deaths 🚩 Increasing number weekly for Cases, Hospitalized, and Deaths ✅ Goal met. | ||||
 Click on graph for larger image.
This graph shows the weekly (columns) number of deaths reported.
January was the worst month for the previous two years, and hopefully this January will not see a significant wave.
Annual Vehicle Sales decrease 8% in 2022; Heavy Trucks Sales up 2% YoY
by Calculated Risk on 1/06/2023 03:09:00 PM
The BEA released their estimate of light vehicle sales for December. The BEA estimates sales of 13.31 million SAAR in December 2022 (Seasonally Adjusted Annual Rate), down 6.3% from the November sales rate, and up 4.7% from December 2021.
 Click on graph for larger image.
The first graph shows annual sales since 1976.
Light vehicle sales in 2022 were at 13.73 million, down 8.1% from 14.95 million in 2021.
Sales in 2022 were impacted significantly by supply chain disruptions, and sales were still down 19% from the 2019 level.
This suggests vehicle sales might increase in 2023 even with higher rates and a soft economy.
The second graph shows heavy truck sales since 1967 using data from the BEA. The dashed line is the December 2022 seasonally adjusted annual sales rate (SAAR).
Heavy truck sales really collapsed during the great recession, falling to a low of 180 thousand SAAR in May 2009. Then heavy truck sales increased to a new all-time high of 570 thousand SAAR in April 2019.
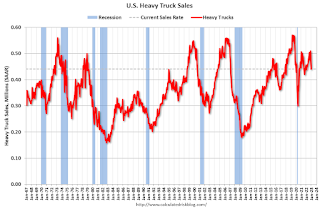 Note: "Heavy trucks - trucks more than 14,000 pounds gross vehicle weight."
Heavy truck sales declined sharply at the beginning of the pandemic, falling to a low of 308 thousand SAAR in May 2020.
Heavy truck sales were at 441 thousand SAAR in December, down from 510 thousand in November, and down 3.5% from 456 thousand SAAR in December 2021.
On annual basis, sales in 2022 were at 470 thousand, up 1.8% from 462 thousand in 2021.
Usually, heavy truck sales decline sharply prior to a recession. Sales were decent in December.
1st Look at Local Housing Markets in December
by Calculated Risk on 1/06/2023 12:41:00 PM
Today, in the Calculated Risk Real Estate Newsletter:
1st Look at Local Housing Markets in December
A brief excerpt:
This is the first look at local markets in December. I’m tracking about 40 local housing markets in the US. Some of the 40 markets are states, and some are metropolitan areas. I’ll update these tables throughout the month as additional data is released.There is much more in the article. You can subscribe at https://calculatedrisk.substack.com/
Closed sales in December were mostly for contracts signed in October and November. Since 30-year fixed mortgage rates were over 7% for most of October (no points) and averaged 6.8% in November (Freddie PMMS with points) closed sales were probably impacted significantly in December.
...
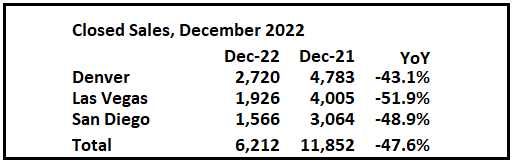
Median sales prices were unchanged year-over-year in Denver and Las Vegas, and up only 2% in San Diego.
...
In December, sales were down 47.6%. In November, these same markets were down 48.3% YoY Not Seasonally Adjusted (NSA).
Note that in December 2022, there were the same number of selling days as in December 2021, so the SA decline will be similar to the NSA decline. This is a similar YoY decline as in November for these early reporting markets. If national sales decline by the same percent as last month, the NAR will report sales for December under 4.0 million SAAR - below the 4.01 million in May 2020 (pandemic low) and the lowest sales rate since 2010.
Many more local markets to come!
Comments on December Employment Report
by Calculated Risk on 1/06/2023 09:26:00 AM
With 4.50 million jobs added, 2022 was the 2nd best year for job growth in US history behind only 2021 with 6.74 million.
The headline jobs number in the December employment report was above expectations, however employment for the previous two months was revised down by 28,000, combined. The participation rate increased, and the unemployment rate decreased to 3.5%. Another solid report.
Leisure and hospitality gained 67 thousand jobs in December. At the beginning of the pandemic, in March and April of 2020, leisure and hospitality lost 8.2 million jobs, and are now down 932 thousand jobs since February 2020. So, leisure and hospitality has now added back about 89% all of the jobs lost in March and April 2020.
Construction employment increased 28 thousand and is now 153 thousand above the pre-pandemic level.
Manufacturing added 8 thousand jobs and is now 149 thousand above the pre-pandemic level.
In December, the year-over-year employment change was 4.50 million jobs.
Seasonal Retail Hiring
Typically, retail companies start hiring for the holiday season in October, and really increase hiring in November. Here is a graph that shows the historical net retail jobs added for October, November and December by year.
 This graph really shows the collapse in retail hiring in 2008. Since then, seasonal hiring had increased back close to more normal levels. However, seasonal retail hiring was down in 2022.
Note: I expect the long-term trend will be down with more and more internet holiday shopping.
Retailers hired 98 thousand workers Not Seasonally Adjusted (NSA) net in December.
Retailers hired 98 thousand workers Not Seasonally Adjusted (NSA) net in December.
This was seasonally adjusted (SA) to a gain of 9.0 thousand jobs in December.
Prime (25 to 54 Years Old) Participation
 Since the overall participation rate is impacted by both cyclical (recession) and demographic (aging population, younger people staying in school) reasons, here is the employment-population ratio for the key working age group: 25 to 54 years old.
The 25 to 54 participation rate increased in December to 82.4% from 82.3% in November, and the 25 to 54 employment population ratio increased to 80.1% from 79.7% the previous month.
Both are close to the pre-pandemic levels and indicate almost all of the prime age workers have returned to the labor force.
Part Time for Economic Reasons
 From the BLS report:
These workers are included in the alternate measure of labor underutilization (U-6) that decreased to 6.5% from 6.7% in the previous month. This is down from the record high in April 22.9% and is the lowest level on record (seasonally adjusted) (series started in 1994). This measure is below the level in February 2020 (pre-pandemic).
Unemployed over 26 Weeks
 This graph shows the number of workers unemployed for 27 weeks or more.
According to the BLS, there are 1.069 million workers who have been unemployed for more than 26 weeks and still want a job, down from 1.215 million the previous month.
This is below pre-pandemic levels.
Summary:
The headline monthly jobs number was above expectations; however, employment for the previous two months was revised down by 28,000, combined.
Part Time for Economic Reasons
 From the BLS report:
"The number of persons employed part time for economic reasons, at 3.9 million, changed little in December. These individuals, who would have preferred full-time employment, were working part time because their hours had been reduced or they were unable to find full-time jobs."The number of persons working part time for economic reasons increased in December to 3.878 million from 3.688 million in November. This is below pre-recession levels.
These workers are included in the alternate measure of labor underutilization (U-6) that decreased to 6.5% from 6.7% in the previous month. This is down from the record high in April 22.9% and is the lowest level on record (seasonally adjusted) (series started in 1994). This measure is below the level in February 2020 (pre-pandemic).
Unemployed over 26 Weeks
 This graph shows the number of workers unemployed for 27 weeks or more.
 According to the BLS, there are 1.069 million workers who have been unemployed for more than 26 weeks and still want a job, down from 1.215 million the previous month.
This is below pre-pandemic levels.
Summary:
The headline monthly jobs number was above expectations; however, employment for the previous two months was revised down by 28,000, combined.
The headline unemployment rate decreased to 3.5%, and U-6 declined to a record low at 6.5%.
Overall, this was another solid employment report - and a strong year of job gains.
December Employment Report: 223 thousand Jobs, 3.5% Unemployment Rate
by Calculated Risk on 1/06/2023 08:43:00 AM
From the BLS:
Total nonfarm payroll employment increased by 223,000 in December, and the unemployment rate edged down to 3.5 percent, the U.S. Bureau of Labor Statistics reported today. Notable job gains occurred in leisure and hospitality, health care, construction, and social assistance.
...
The change in total nonfarm payroll employment for October was revised down by 21,000, from +284,000 to +263,000, and the change for November was revised down by 7,000, from +263,000 to +256,000. With these revisions, employment gains in October and November combined were 28,000 lower than previously reported.
emphasis added
 Click on graph for larger image.
The first graph shows the job losses from the start of the employment recession, in percentage terms.
The current employment recession was by far the worst recession since WWII in percentage terms.
However, as of August 2022, the total number of jobs had returned and are now 1.24 million above pre-pandemic levels. I'll post this graph through the January 2023 report (includes the annual revision).
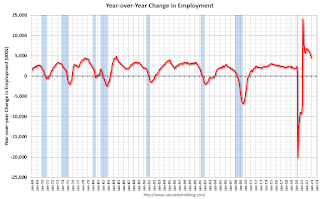 The second graph shows the year-over-year change in total non-farm employment since 1968.
In December, the year-over-year change was 4.53 million jobs. Employment was up significantly year-over-year.
Total payrolls increased by 223 thousand in December. Private payrolls increased by 220 thousand, and public payrolls increased 3 thousand.
Payrolls for October and November were revised down 28 thousand, combined.
The third graph shows the employment population ratio and the participation rate.
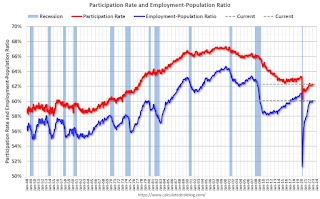 The Labor Force Participation Rate increased to 62.3% in December, from 62.2% in November. This is the percentage of the working age population in the labor force.
The Employment-Population ratio increased to 60.1% from 59.9% (blue line).
I'll post the 25 to 54 age group employment-population ratio graph later.
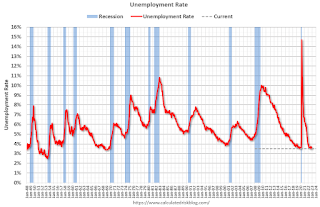 The fourth graph shows the unemployment rate.
The unemployment rate was decreased in December to 3.5% from 3.6% in November.
This was above consensus expectations; however, October and November payrolls were revised down by 28,000 combined.
 The second graph shows the year-over-year change in total non-farm employment since 1968.
In December, the year-over-year change was 4.53 million jobs. Employment was up significantly year-over-year.
Total payrolls increased by 223 thousand in December. Private payrolls increased by 220 thousand, and public payrolls increased 3 thousand.
Payrolls for October and November were revised down 28 thousand, combined.
The third graph shows the employment population ratio and the participation rate.
 The Labor Force Participation Rate increased to 62.3% in December, from 62.2% in November. This is the percentage of the working age population in the labor force.
 The Employment-Population ratio increased to 60.1% from 59.9% (blue line).
I'll post the 25 to 54 age group employment-population ratio graph later.
 The fourth graph shows the unemployment rate.
 The unemployment rate was decreased in December to 3.5% from 3.6% in November.
This was above consensus expectations; however, October and November payrolls were revised down by 28,000 combined.
I'll have more later ...


