by Calculated Risk on 1/11/2023 07:00:00 AM
Wednesday, January 11, 2023
MBA: Mortgage Applications Increase in Latest Weekly Survey
From the MBA: Mortgage Applications Increase in Latest MBA Weekly Survey
Mortgage applications increased 1.2 percent from one week earlier, according to data from the Mortgage Bankers Association’s (MBA) Weekly Mortgage Applications Survey for the week ending January 6, 2023.
... The Refinance Index increased 5 percent from the previous week and was 86 percent lower than the same week one year ago. The seasonally adjusted Purchase Index decreased 1 percent from one week earlier. The unadjusted Purchase Index increased 47 percent compared with the previous week and was 44 percent lower than the same week one year ago.
“Mortgage rates declined last week as markets reacted to data showing a weakening economy and slowing wage growth. All loan types in the survey saw a decline in rates, with the 30-year fixed rate falling to 6.42 percent. Purchase applications continued to be hampered by broader weakness in the housing market and declined slightly over the week, with the index slipping to its lowest level since 2014,” said Joel Kan, MBA’s Vice President and Deputy Chief Economist. “There was an increase in refinance activity as a result of the 16-basis-point decline in rates, as both conventional and government refinance applications increased. However, the overall pace of refinance applications was lower than November and December’s 2022 averages, and over 80 percent lower than a year ago. Refinances were about 30 percent of all applications last week — well below the past decade’s average of 58 percent.”
...
The average contract interest rate for 30-year fixed-rate mortgages with conforming loan balances ($647,200 or less) decreased to 6.42 percent from 6.58 percent, with points remaining at 0.73 (including the origination fee) for 80 percent loan-to-value ratio (LTV) loans.
emphasis added
 Click on graph for larger image.
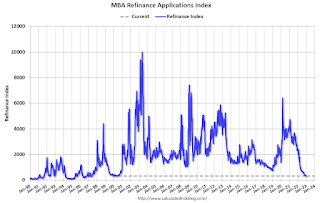
The first graph shows the refinance index since 1990.
Note: Red is a four-week average (blue is weekly).
Tuesday, January 10, 2023
Mortgage Rate Update
by Calculated Risk on 1/10/2023 02:04:00 PM
Today, in the Calculated Risk Real Estate Newsletter: Mortgage Rate Update
A brief excerpt:
A year ago, I wrote Mortgage Rates: Moving on Up and 30-year mortgage rates had only increased to 3.625%!There is much more in the article. You can subscribe at https://calculatedrisk.substack.com/
Now, Mortgage News Daily reports that the most prevalent 30-year fixed rate is now at 6.14% for top tier scenarios. Usually there is a fairly steady spread between the ten-year Treasury yield and 30-year mortgage rates, although - as housing economist Tom Lawler explained in Mortgage/Treasury Spreads, Part I and Part II - the spread has widened due to several factors including volatility and pre-payment speeds.
Second Home Market: South Lake Tahoe in December
by Calculated Risk on 1/10/2023 01:15:00 PM
With the pandemic, there was a surge in 2nd home buying.
I'm looking at data for some second home markets - and I'm tracking those markets to see if there is an impact from lending changes, rising mortgage rates or the easing of the pandemic.
This graph is for South Lake Tahoe since 2004 through December 2022, and shows inventory (blue), and the year-over-year (YoY) change in the median price (12-month average).
Note: The median price is a 12-month average, and is distorted by the mix, but this is the available data.

Following the housing bubble, prices declined for several years in South Lake Tahoe, with the median price falling about 50% from the bubble peak.
Currently inventory is still very low, but still up almost 2-fold from the record low set in February 2022, and up 6% year-over-year. Prices are up 1.3% YoY (and the YoY change has been trending down).
Question #5 for 2023: What will the YoY core inflation rate be in December 2023?
by Calculated Risk on 1/10/2023 08:51:00 AM
Earlier I posted some questions on my blog for next year: Ten Economic Questions for 2023. Some of these questions concern real estate (inventory, house prices, housing starts, new home sales), and I’ll post thoughts on those in the newsletter (others like GDP and employment will be on this blog).
I'm adding some thoughts, and maybe some predictions for each question.
5) Inflation: Core PCE was up 4.7% YoY through November. This was down from a peak of 5.4% in early 2022. The FOMC is forecasting the YoY change in core PCE will be in the 3.2% to 3.7% range in Q4 2023. Will the core inflation rate decrease in 2023, and what will the YoY core inflation rate be in December 2023?
Although there are different measure for inflation, they all show inflation well above the Fed's 2% inflation target.
Note: I follow several measures of inflation, including median CPI and trimmed-mean CPI from the Cleveland Fed. Also core PCE prices (monthly from the BEA) and core CPI (from the BLS).

This graph shows the year-over-year change for these four key measures of inflation. The recent spike in inflation is obvious, and inflation appears to have peaked.
This “dramatic shift” in household formation is leading to Rents Falling Faster than "Seasonality Alone". Since rents are falling - and will likely continue to fall - it probably makes sense to look at inflation ex-shelter for monetary policy over the next several months.
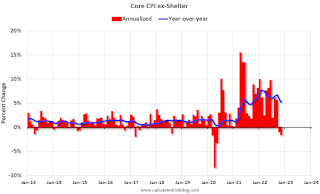
 This graph shows the year-over-year change in Core CPI ex-Shelter (blue), and the one month change annualized (red). The year-over-year change was at 5.2% in November, down from 5.9% in October. And the annualized one-month change was negative in both October and November! Core CPI ex-shelter fell at 1.5% annual rate in November.
Here are the Ten Economic Questions for 2023 and a few predictions:
• Question #1 for 2023: How much will the economy grow in 2023? Will there be a recession in 2023?
• Question #2 for 2023: How much will job growth slow in 2023? Or will the economy lose jobs?
• Question #3 for 2023: What will the unemployment rate be in December 2023?
• Question #4 for 2023: What will the participation rate be in December 2023?
• Question #5 for 2023: What will the YoY core inflation rate be in December 2023?
• Question #6 for 2023: What will the Fed Funds rate be in December 2023?
• Question #7 for 2023: How much will wages increase in 2023?
• Question #8 for 2023: How much will Residential investment change in 2023? How about housing starts and new home sales in 2023?
• Question #9 for 2023: What will happen with house prices in 2023?
• Question #10 for 2023: Will inventory increase further in 2023?
Monday, January 09, 2023
Tuesday: Fed Chair Powell on "Central Bank Independence"
by Calculated Risk on 1/09/2023 09:05:00 PM

[W]hile there was arguably a small amount of push-back in the overnight session, it was quickly erased, and with minimal volatility to boot. This helps legitimize the levels achieved last Friday--especially with Treasury auctions on deck and another high risk event in the form of the CPI data on Thursday. [30 year fixed 6.14%]Tuesday:
emphasis added
• At 6:00 AM ET, NFIB Small Business Optimism Index for December.
• At 9:00 AM: Discussion, Fed Chair Jerome Powell, Central Bank Independence, At the Sveriges Riksbank International Symposium on Central Bank Independence, Stockholm, Sweden
Leading Index for Commercial Real Estate Increases in December
by Calculated Risk on 1/09/2023 04:31:00 PM
From Dodge Data Analytics: Dodge Momentum Index Wraps up 2022 with December Growth
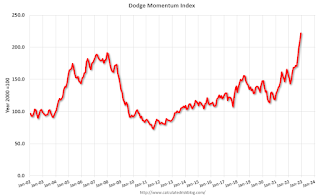
The Dodge Momentum Index (DMI), issued by Dodge Construction Network, improved 6.6% (2000=100) in December to 222.2 from the revised November reading of 208.3. In December, the commercial component of the DMI rose 8.4%, and the institutional component ticked up 2.7%.
“One of the key construction storylines for 2022 was the return of enthusiasm and optimism in prospects for nonresidential growth,” stated Richard Branch, chief economist for Dodge Construction Network. “While some of that will likely erode in 2023 as economic growth wanes, increased demand for some building types like data centers, labs, and healthcare buildings will provide a solid floor for the construction sector.”
Commercial planning in December was supported by broad-based increases across office, warehouse, retail and hotel planning. Meanwhile, institutional growth focused on recreation and public building, with education and healthcare planning activity remaining flat. On a year-over-year basis, the DMI was 40% higher than in December 2021; the commercial component was up 51%, and institutional planning was 20% higher.
...
The DMI is a monthly measure of the initial report for nonresidential building projects in planning, shown to lead construction spending for nonresidential buildings by a full year.
emphasis added
 Click on graph for larger image.
This graph shows the Dodge Momentum Index since 2002. The index was at 222.2 in December, up from 208.3 in November.
According to Dodge, this index leads "construction spending for nonresidential buildings by a full year". This index suggests a solid pickup in commercial real estate construction into 2023.
2nd Look at Local Housing Markets in December
by Calculated Risk on 1/09/2023 12:59:00 PM
Today, in the Calculated Risk Real Estate Newsletter: 2nd Look at Local Housing Markets in December
A brief excerpt:
This is the second look at local markets in December. I’m tracking about 40 local housing markets in the US. Some of the 40 markets are states, and some are metropolitan areas. I’ll update these tables throughout the month as additional data is released.There is much more in the article. You can subscribe at https://calculatedrisk.substack.com/
Closed sales in December were mostly for contracts signed in October and November. Since 30-year fixed mortgage rates were over 7% for most of October (no points) and averaged 6.8% in November (Freddie PMMS with points) closed sales were probably impacted significantly in December.
...
In the Northwest, median sales prices were down slightly year-over-year. From the Northwest MLS: For Northwest MLS brokers, December ends with a “whimper,” and 2022 was “a tale of two housing markets”The median sales price was $570,000, down $2,900 (-0.51%) from the year-ago figure of $572,900. Last year’s median price overall peaked in May 2022, at $660,000.In Charlotte, the median sales price was $373,625, up 6.8% year-over-year.
...
In December, sales were down 43.5%. In November, these same markets were down 43.7% YoY Not Seasonally Adjusted (NSA).
Note that in December 2022, there were the same number of selling days as in December 2021, so the SA decline will be similar to the NSA decline.
This is a similar YoY decline as in November for these early reporting markets. If national sales decline by the same percent as last month, the NAR will report sales for December under 4.0 million SAAR - below the 4.01 million in May 2020 (pandemic low) and the lowest sales rate since 2010.
Many more local markets to come!
AAR: December Rail Carloads and Intermodal Down Year-over-year
by Calculated Risk on 1/09/2023 12:04:00 PM
From the Association of American Railroads (AAR) Rail Time Indicators. Graphs and excerpts reprinted with permission.
In 2022, U.S. railroads originated 11.98 million total carloads, down 0.3% (34,001 carloads) from 2021 and up 6.2% (697,444 carloads) over 2020. Since 1988, when our U.S. rail data begin, only 2020 had fewer total carloads than 2022.
emphasis added
 Click on graph for larger image.
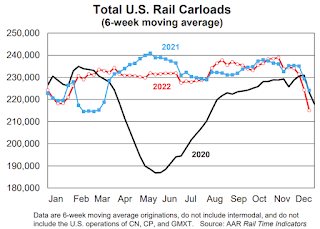
This graph from the Rail Time Indicators report shows the six-week average of U.S. Carloads in 2020, 2021 and 2022:
December is typically one of the lowest volume months of the year, and 2022 was no exception. Total carloads averaged 210,543 per week in December 2022, the fewest for any month in 2022 and down 4.4% from December 2021. The 4.4% decline in total carloads was the biggest for any month since February 2021.
 The second graph shows the six-week average (not monthly) of U.S. intermodal in 2020, 2021 and 2022: (using intermodal or shipping containers):
U.S. intermodal originations in 2022 were 13.45 million, down 4.9% (686,580 units) from 2021 and down 0.02% (3,131 units) from 2020. U.S. intermodal volume in 2022 was the sixth most ever, but also the lowest since 2016. In 2022, containers accounted 93.7% of U.S. intermodal shipments, a record high.
Wholesale Used Car Prices Down 14.9% Year-over-year; Largest Annual Decline on Record
by Calculated Risk on 1/09/2023 09:15:00 AM
From Manheim Consulting today: Wholesale Used-Vehicle Prices Increase in December
Wholesale used-vehicle prices (on a mix, mileage, and seasonally adjusted basis) increased 0.8% in December from November. The Manheim Used Vehicle Value Index (MUVVI) rose to 219.3, down 14.9% from a year ago. This was the largest annualized decline in the series’ history. December’s increase was driven by the seasonal adjustment. The non-adjusted price change in December was a decline of 1.9% compared to November, moving the unadjusted average price down 13.1% year over year.
emphasis added
 Click on graph for larger image.
This index from Manheim Consulting is based on all completed sales transactions at Manheim’s U.S. auctions.
Housing January 9th Weekly Update: Inventory Decreased 4% Week-over-week
by Calculated Risk on 1/09/2023 08:32:00 AM
 Click on graph for larger image.
This inventory graph is courtesy of Altos Research.

Mike Simonsen discusses this data regularly on Youtube.


