by Calculated Risk on 1/13/2023 09:57:00 AM
Friday, January 13, 2023
3rd Look at Local Housing Markets in December
Today, in the Calculated Risk Real Estate Newsletter: 3rd Look at Local Housing Markets in December
A brief excerpt:
This is the third look at local markets in December. I’m tracking about 40 local housing markets in the US. Some of the 40 markets are states, and some are metropolitan areas. I’ll update these tables throughout the month as additional data is released.There is much more in the article. You can subscribe at https://calculatedrisk.substack.com/
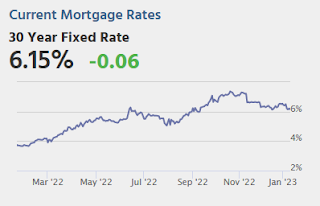
Closed sales in December were mostly for contracts signed in October and November. Since 30-year fixed mortgage rates were over 7% for most of October (no points) and averaged 6.8% in November (Freddie PMMS with points) closed sales were probably impacted significantly in December.
From the Houston Association of REALTORS®: The Economic Headwinds of 2022 Bring Houston’s Home Sales Hot Streak to an EndFor the month of December, single-family home sales dropped 32.6 percent. That marks the ninth straight monthly decline of 2022 and the steepest. … The median price of a single-family home – the figure at which half of the homes sold for more and half sold for less – was $330,000 in December. That is the third straight month it has held at that level and is 3.8 percent higher than last December.
emphasis addedHere is a summary of active listings for these housing markets in December.
Inventory in these markets were down 30% YoY in January 2022 and are now up 76% YoY! So, this is a significant change from early in 2022, and about the same YoY inventory increase as in November (up 72% YoY).
Notes for all tables:
1) New additions to table in BOLD.
2) Northwest (Seattle), Santa Clara (San Jose), Jacksonville, Source: Northeast Florida Association of REALTORS®
3) Totals do not include Atlanta, or Denver (included in state totals)
...
Many more local markets to come!
Thursday, January 12, 2023
Question #2 for 2023: How much will job growth slow in 2023? Or will the economy lose jobs?
by Calculated Risk on 1/12/2023 02:55:00 PM
Earlier I posted some questions on my blog for next year: Ten Economic Questions for 2023. Some of these questions concern real estate (inventory, house prices, housing starts, new home sales), and I’ll post thoughts on those in the newsletter (others like GDP and employment will be on this blog).
I'm adding some thoughts, and maybe some predictions for each question.
2) Employment: The economy added 4.5 million jobs in 2022. This makes 2022 the second-best year for job growth in US history, only behind the 6.7 million jobs added in 2021. How much will job growth slow in 2023? Or will the economy lose jobs?
| Job Changes During Recessions | ||
|---|---|---|
| Year | Job Change | Recession |
| 1974 | -379 | '73-'75 |
| 1975 | 365 | '73-'75 |
| 1980 | 271 | '80 |
| 1981 | -48 | '81-'82 |
| 1982 | -2,124 | '81-'82 |
| 1990 | 330 | '90-'91 |
| 1991 | -838 | '90-91 |
| 2001 | -1,727 | '01 |
| 2002 | -510 | '01 |
| 2008 | -3,553 | '07-'09 |
| 2009 | -5,051 | '07-'09 |
| 2020 | -9,292 | '20 |
Here are the Ten Economic Questions for 2023 and a few predictions:
• Question #1 for 2023: How much will the economy grow in 2023? Will there be a recession in 2023?
• Question #2 for 2023: How much will job growth slow in 2023? Or will the economy lose jobs?
• Question #3 for 2023: What will the unemployment rate be in December 2023?
• Question #4 for 2023: What will the participation rate be in December 2023?
• Question #5 for 2023: What will the YoY core inflation rate be in December 2023?
• Question #6 for 2023: What will the Fed Funds rate be in December 2023?
• Question #7 for 2023: How much will wages increase in 2023?
• Question #8 for 2023: How much will Residential investment change in 2023? How about housing starts and new home sales in 2023?
• Question #9 for 2023: What will happen with house prices in 2023?
• Question #10 for 2023: Will inventory increase further in 2023?
Cleveland Fed: Median CPI increased 0.4% and Trimmed-mean CPI increased 0.4% in December
by Calculated Risk on 1/12/2023 11:58:00 AM
The Cleveland Fed released the median CPI and the trimmed-mean CPI:
According to the Federal Reserve Bank of Cleveland, the median Consumer Price Index rose 0.4% in December. The 16% trimmed-mean Consumer Price Index increased 0.4% in December. "The median CPI and 16% trimmed-mean CPI are measures of core inflation calculated by the Federal Reserve Bank of Cleveland based on data released in the Bureau of Labor Statistics’ (BLS) monthly CPI report".
 Click on graph for larger image.
This graph shows the year-over-year change for these four key measures of inflation.
Note: The Cleveland Fed released the median CPI details. "Fuel oil and other fuels" decreased at a 78% annualized rate in December, and "Used Cars" decreased at a 27% annualized rate.
Current State of the Housing Market; Overview for mid-January
by Calculated Risk on 1/12/2023 10:19:00 AM
Today, in the Calculated Risk Real Estate Newsletter: Current State of the Housing Market; Overview for mid-January
A brief excerpt:
And here is a graph comparing the YoY change in the NAR median prices vs the Case-Shiller National Index (the median is distorted by the mix of homes sold, and also lagged since this is for closing prices).There is much more in the article. You can subscribe at https://calculatedrisk.substack.com/
The YoY change in the median price peaked at 25.2% in May 2021 and has now slowed to 3.5%. In general, the NAR median price leads the Case-Shiller index by 2 to 3 months. Note that the median price usually starts falling seasonally in July, so the 2.1% decline in November in the median price was partially seasonal, however the 10.4% decline over the last five months has been much larger than the usual seasonal decline.
It is likely the median price will be down year-over-year in a few months - and Case-Shiller will follow. I’m now forecasting a 10%+ decline in nominal house prices, see: House Prices: 7 Years in Purgatory.
...
On Friday, January 20th, the NAR will release existing home sales for December. This report will likely show another sharp year-over-year decline in sales for December, similar to the YoY decline in November. ... If national sales decline by the same percent as last month, the NAR will report sales for December under 4.0 million SAAR - below the 4.01 million in May 2020 (pandemic low) and the lowest sales rate since 2010.
Weekly Initial Unemployment Claims decrease to 205,000
by Calculated Risk on 1/12/2023 08:37:00 AM
The DOL reported:
In the week ending January 7, the advance figure for seasonally adjusted initial claims was 205,000, a decrease of 1,000 from the previous week's revised level. The previous week's level was revised up by 2,000 from 204,000 to 206,000. The 4-week moving average was 212,500, a decrease of 1,750 from the previous week's revised average. The previous week's average was revised up by 500 from 213,750 to 214,250.The following graph shows the 4-week moving average of weekly claims since 1971.
emphasis added
 Click on graph for larger image.
The dashed line on the graph is the current 4-week average. The four-week average of weekly unemployment claims decreased to 212,500.
The previous week was revised up.
Weekly claims were below the consensus forecast.
BLS: CPI decreased 0.1% in December; Core CPI increased 0.3%
by Calculated Risk on 1/12/2023 08:32:00 AM
The Consumer Price Index for All Urban Consumers (CPI-U) declined 0.1 percent in December on a seasonally adjusted basis, after increasing 0.1 percent in November, the U.S. Bureau of Labor Statistics reported today. Over the last 12 months, the all items index increased 6.5 percent before seasonal adjustment.CPI was below expectations and core CPI was at expectations. I'll post a graph later today after the Cleveland Fed releases the median and trimmed-mean CPI.
The index for gasoline was by far the largest contributor to the monthly all items decrease, more than offsetting increases in shelter indexes. The food index increased 0.3 percent over the month with the food at home index rising 0.2 percent. The energy index decreased 4.5 percent over the month as the gasoline index declined; other major energy component indexes increased over the month.
The index for all items less food and energy rose 0.3 percent in December, after rising 0.2 percent in November. Indexes which increased in December include the shelter, household furnishings and operations, motor vehicle insurance, recreation, and apparel indexes. The indexes for used cars and trucks, and airline fares were among those that decreased over the month.
The all items index increased 6.5 percent for the 12 months ending December; this was the smallest 12-month increase since the period ending October 2021. The all items less food and energy index rose 5.7 percent over the last 12 months. The energy index increased 7.3 percent for the 12 months ending December, and the food index increased 10.4 percent over the last year; all of these increases were smaller than for the 12-month period ending November.
emphasis added
Wednesday, January 11, 2023
Thursday: CPI, Unemployment Claims
by Calculated Risk on 1/11/2023 08:39:00 PM

Thursday:
• At 8:30 AM ET, the initial weekly unemployment claims report will be released. The consensus is for 220 thousand initial claims, up from 204 thousand last week.
• Also, at 8:30 AM, The Consumer Price Index for December from the BLS. The consensus is for 0.1% increase in CPI, and a 0.3% increase in core CPI. The consensus is for CPI to be up 6.5% year-over-year and core CPI to be up 5.7% YoY.
Lawler: Freddie Mac “National” Home Price Index Down Again in November; Rents Continued to Slide
by Calculated Risk on 1/11/2023 02:41:00 PM
Today, in the Calculated Risk Real Estate Newsletter: Lawler: Freddie Mac “National” Home Price Index Down Again in November; Rents Continued to Slide
A brief excerpt:
Freddie Mac recently reported that its “National” Home Price Index (FMNHPI) declined for the fifth straight month on a seasonally adjusted basis in November, putting the FNNHPI down 2.06% from its June 2022 peak. Compared to a year earlier the November FMNHPI was up 6.27%, down from October’s 7.92% YOY gain. The November seasonally adjusted FMHPIs for 29 states plus DC were below their 2022 peaks, with five states showing declines of over 5% from their 2022 peak levels.There is much more in the article. You can subscribe at https://calculatedrisk.substack.com/
CR Note: This is a repeat sales index using only loans purchased by Fannie and Freddie. Freddie has data for all states and many cities. Idaho is down 8.16% seasonally adjusted compared to the peak in 2022. Arizona is down 7.06%, and California is down 5.88%.
Question #3 for 2023: What will the unemployment rate be in December 2023?
by Calculated Risk on 1/11/2023 12:10:00 PM
Earlier I posted some questions on my blog for next year: Ten Economic Questions for 2023. Some of these questions concern real estate (inventory, house prices, housing starts, new home sales), and I’ll post thoughts on those in the newsletter (others like GDP and employment will be on this blog).
I'm adding some thoughts, and maybe some predictions for each question.
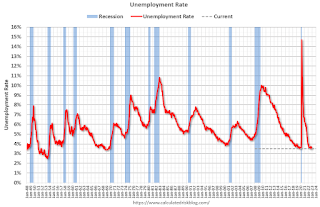
3) Unemployment Rate: The unemployment rate was at 3.5% in December, down 0.4 percentage points year-over-year. Currently the FOMC is forecasting the unemployment rate will increase to the 4.4% to 4.7% range in Q4 2023. What will the unemployment rate be in December 2023?
Here is a graph of the unemployment rate over time:
 Click on graph for larger image.
The unemployment rate is from the household survey (CPS), and the rate decreased gradually in 2022. The unemployment rate decreased in December to 3.5%, down from 3.9% in December 2021. This tied the lowest unemployment rate since 1969.
Forecasting the unemployment rate includes forecasts for economic and payroll growth, and also for changes in the participation rate (previous question).
Here is a table of the participation rate and unemployment rate since 2008.
| Unemployment and Participation Rate for December each Year | |||
|---|---|---|---|
| December of | Participation Rate | Change in Participation Rate (percentage points) | Unemployment Rate |
| 2008 | 65.8% | 7.3% | |
| 2009 | 64.6% | -1.2 | 9.9% |
| 2010 | 64.3% | -0.3 | 9.3% |
| 2011 | 64.0% | -0.3 | 8.5% |
| 2012 | 63.7% | -0.3 | 7.9% |
| 2013 | 62.9% | -0.8 | 6.7% |
| 2014 | 62.8% | -0.1 | 5.6% |
| 2015 | 62.7% | -0.1 | 5.0% |
| 2016 | 62.7% | 0.0 | 4.7% |
| 2017 | 62.7% | 0.0 | 4.1% |
| 2018 | 63.0% | 0.3 | 3.9% |
| 2019 | 63.3% | 0.3 | 3.6% |
| 2020 | 61.5% | -1.8 | 6.7% |
| 2021 | 62.0% | 0.5 | 3.9% |
| 2022 | 62.3% | 0.3 | 3.5% |
Depending on the estimate for the participation rate and job growth (next question), my guess is the unemployment rate will increase to around 4% in December 2023 from the current 3.5%. (Lower than the FOMC forecast of 4.4% to 4.7%).
• Question #1 for 2023: How much will the economy grow in 2023? Will there be a recession in 2023?
• Question #2 for 2023: How much will job growth slow in 2023? Or will the economy lose jobs?
• Question #3 for 2023: What will the unemployment rate be in December 2023?
• Question #4 for 2023: What will the participation rate be in December 2023?
• Question #5 for 2023: What will the YoY core inflation rate be in December 2023?
• Question #6 for 2023: What will the Fed Funds rate be in December 2023?
• Question #7 for 2023: How much will wages increase in 2023?
• Question #8 for 2023: How much will Residential investment change in 2023? How about housing starts and new home sales in 2023?
• Question #9 for 2023: What will happen with house prices in 2023?
• Question #10 for 2023: Will inventory increase further in 2023?
Question #4 for 2023: What will the participation rate be in December 2023?
by Calculated Risk on 1/11/2023 09:21:00 AM
Earlier I posted some questions on my blog for next year: Ten Economic Questions for 2023. Some of these questions concern real estate (inventory, house prices, housing starts, new home sales), and I’ll post thoughts on those in the newsletter (others like GDP and employment will be on this blog).
I'm adding some thoughts, and maybe some predictions for each question.
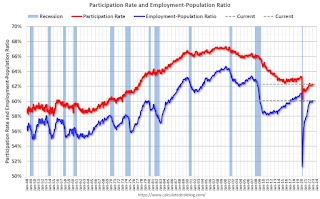
4) Participation Rate: In December 2022, the overall participation rate was at 62.3%, up year-over-year from 62.0% in December 2021, but still below the pre-pandemic level of 63.4%. Long term, the BLS is projecting the overall participation rate will decline to 60.1% by 2031 due to demographics. What will the participation rate be in December 2023?
The overall labor force participation rate is the percentage of the working age population (16 + years old) in the labor force. A large portion of the decline in the participation rate since 2000 was due to demographics and long-term trends.

 The second graph shows the participation rate for "prime age" workers (25 to 54 years old). The 25 to 54 participation rate was at 82.4% in December 2022 (Red), down from the pre-pandemic level of 83.0%. This suggests we might see some further increase in the prime participation rate, however most of the prime age workers have returned to the labor force.
Here are the Ten Economic Questions for 2023 and a few predictions:
• Question #1 for 2023: How much will the economy grow in 2023? Will there be a recession in 2023?
• Question #2 for 2023: How much will job growth slow in 2023? Or will the economy lose jobs?
• Question #3 for 2023: What will the unemployment rate be in December 2023?
• Question #4 for 2023: What will the participation rate be in December 2023?
• Question #5 for 2023: What will the YoY core inflation rate be in December 2023?
• Question #6 for 2023: What will the Fed Funds rate be in December 2023?
• Question #7 for 2023: How much will wages increase in 2023?
• Question #8 for 2023: How much will Residential investment change in 2023? How about housing starts and new home sales in 2023?
• Question #9 for 2023: What will happen with house prices in 2023?
• Question #10 for 2023: Will inventory increase further in 2023?


