 RSS Feed
 by Calculated Risk on 1/15/2023 10:33:00 AM
Sunday, January 15, 2023
Effective Fed Funds Rate and Inflation
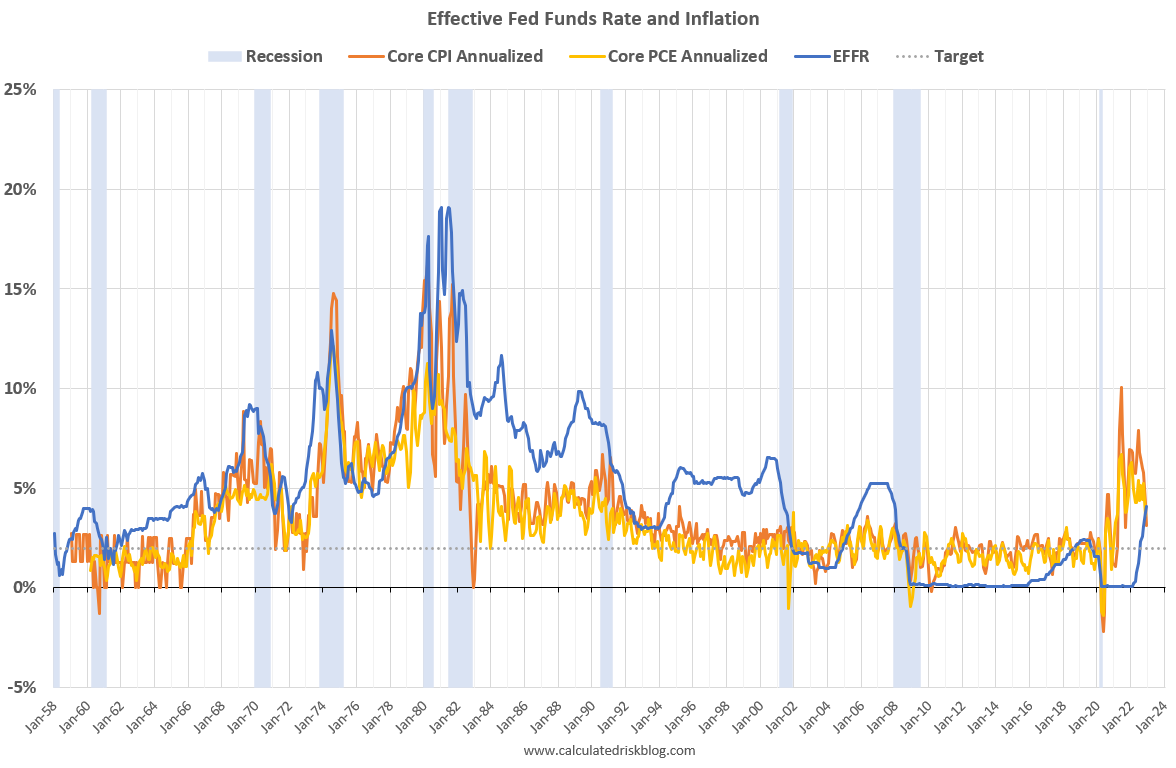
This graph shows the Effective Fed Funds Rate (blue) since 1958.
The graph shows two measures of inflation using a month-over-month change annualized (using a three-month average to smooth the graph). For example, for December 2022, I used an average of December, November and October 2022, divided by the average of November, October and September 2022. (This was just for smoothing).
 Click on graph for larger image.
In 1974, the Fed started cutting rates before inflation peaked. However, in the Volcker period, the Fed waited until after inflation peaked.
The good news is the inflation has clearly peaked. And since rents are falling faster than seasonally normal - due to the pandemic related changes in household formation - it makes sense for the short term to use core CPI ex-shelter. And that is actually negative for the last 3 months!
NOTE: There was a surge in household formation during the pandemic, pushing up rents sharply, and now household formation has slowed sharply just as more supply will be coming on the market.
 This graph shows the year-over-year change in Core CPI ex-Shelter (blue), and the one month change annualized (red). The year-over-year change was at 4.4% in December, down from 5.2% in November. And the annualized one-month change was negative in October, November and December!
Saturday, January 14, 2023
Real Estate Newsletter Articles this Week: A Sharp Decline in Sales, House Prices and Rents Falling
by Calculated Risk on 1/14/2023 02:11:00 PM
At the Calculated Risk Real Estate Newsletter this week:
• 3rd Look at Local Housing Markets in December
• Current State of the Housing Market; Overview for mid-January
• Lawler: Freddie Mac “National” Home Price Index Down Again in November; Rents Continued to Slide
• Mortgage Rate Update
• 2nd Look at Local Housing Markets in December
This is usually published 4 to 6 times a week and provides more in-depth analysis of the housing market.
You can subscribe at https://calculatedrisk.substack.com/
Most content is available for free (and no Ads), but please subscribe!
Schedule for Week of January 15, 2023
by Calculated Risk on 1/14/2023 08:11:00 AM
The key reports this week are December retail sales, housing starts and existing home sales.
For manufacturing, the December Industrial Production report and the January New York and Philly Fed manufacturing surveys will be released.
All US markets will be closed in observance of Martin Luther King Jr. Day
8:30 AM: The New York Fed Empire State manufacturing survey for January. The consensus is for a reading of -8.7, up from -11.2.
7:00 AM ET: The Mortgage Bankers Association (MBA) will release the results for the mortgage purchase applications index.
 8:30 AM: Retail sales for December is scheduled to be released. The consensus is for a 0.8% decrease in retail sales.
This graph shows retail sales since 1992. This is monthly retail sales and food service, seasonally adjusted (total and ex-gasoline).
8:30 AM ET: The Producer Price Index for December from the BLS. The consensus is for a 0.1% decrease in PPI, and a 0.1% increase in core PPI.
 9:15 AM: The Fed will release Industrial Production and Capacity Utilization for December.
This graph shows industrial production since 1967.
The consensus is for a 0.1% decrease in Industrial Production, and for Capacity Utilization to decrease to 79.6%.
10:00 AM: The January NAHB homebuilder survey. The consensus is for a reading of 31, unchanged from 31 in December. Any number below 50 indicates that more builders view sales conditions as poor than good.
2:00 PM: the Federal Reserve Beige Book, an informal review by the Federal Reserve Banks of current economic conditions in their Districts.
8:30 AM: The initial weekly unemployment claims report will be released. The consensus is for 212 thousand initial claims, up from 205 thousand last week.
 8:30 AM: Housing Starts for December.
 This graph shows single and multi-family housing starts since 1968.
The consensus is for 1.358 million SAAR, down from 1.427 million SAAR.
8:30 AM: the Philly Fed manufacturing survey for January.
 10:00 AM: Existing Home Sales for December from the National Association of Realtors (NAR). The consensus is for 3.95 million SAAR, down from 4.09 million.
The graph shows existing home sales from 1994 through the report last month.
Friday, January 13, 2023
COVID Jan 13, 2023: Update on Cases, Hospitalizations and Deaths
by Calculated Risk on 1/13/2023 08:58:00 PM
On COVID (focus on hospitalizations and deaths). Data is now weekly.
| COVID Metrics | ||||
|---|---|---|---|---|
| Now | Week Ago | Goal | ||
| New Cases per Week2 | 414,721 | 477,230 | ≤35,0001 | |
| Hospitalized2 | 38,840 | 39,925 | ≤3,0001 | |
| Deaths per Week2🚩 | 3,907 | 2,705 | ≤3501 | |
| 1my goals to stop weekly posts, 2Weekly for Cases, Currently Hospitalized, and Deaths 🚩 Increasing number weekly for Cases, Hospitalized, and Deaths ✅ Goal met. | ||||
 Click on graph for larger image.
This graph shows the weekly (columns) number of deaths reported.
January was the worst month for the previous two years, and hopefully this January will not see a significant wave.
Lawler: Early Read on Existing Home Sales in December
by Calculated Risk on 1/13/2023 04:18:00 PM
From housing economist Tom Lawler:
Based on publicly-available local realtor/MLS reports released across the country through today, I project that existing home sales as estimated by the National Association of Realtors ran at a seasonally adjusted annual rate of 3.96 million in December, down 3.2% from November’s preliminary pace and down 35.0%% from last December’s seasonally adjusted pace. Sales on an unadjusted basis should show a slightly larger YOY decline.
On an unadjusted basis the YOY % decline in sales was once again the largest in the West.
Local realtor reports, as well as reports from national inventory trackers, suggest that the inventory of existing homes for sale last month was up substantially from a year earlier, and that the YOY % gain was higher than that seen in November. However, the NAR’s estimate may not show the same increase as these reports suggest, as most of these reports exclude listings with pending contracts. E.g., the Realtor.com report for November showed that the average number of listings excluding those with pending contracts was up 54.7% from last December compared to a YOY increase of 46.8% in November, while average listings including pending contracts were up just 6.0% YOY in December compared to an 3.0% rise in November. The NAR’s inventory estimate for the end of November was up 2.7% from a year earlier. The NAR’s inventory estimate has tracked the Realtor.com total inventory measure much more closely than the “ex-pendings” inventory measure, and appears to include pending listings, which are down sharply from a year ago. Just as the NAR inventory numbers understated the decline in “effective” homes for sale during much of last year, they are now significantly understating the recent increase in effective inventory.
Finally, local realtor/MLS reports suggest that the median existing single-family home sales price last month was up by about 2.2% from last December. While median prices on existing home sales can be significantly impacted by the mix of home sales and may not reflect changes in typical home values, it is worth noting that median sales prices in quite of few areas of the country last month were flat to down compared to a year ago, including but not limited to a large number of California counties, Phoenix, Austin, Ada County (includes Boise), Illinois, Denver, Colorado Springs, Northwest Washington, Spokane, Portland, Las Vegas, Reno, Houston, Des Moines, DC (city), and Memphis.
On a separate note: While I’ve been unable to produce national estimates of the NAR’s Pending Home Sales Index (not all local realtor reports include new pending sales, and many that do often revise their numbers significantly), I did notice that the majority of realtor reports that show new pending sales showed somewhat smaller YOY declines in December relative to November. As such, it’s possible that the PHSI may show a “bump” in December from November’s especially low level.
CR Note: The National Association of Realtors (NAR) is scheduled to release December existing home sales on Friday, January 20, 2023, at 10:00 AM ET. The consensus is for 3.95 million SAAR.
Question #1 for 2023: How much will the economy grow in 2023? Will there be a recession in 2023?
by Calculated Risk on 1/13/2023 02:08:00 PM
Earlier I posted some questions on my blog for next year: Ten Economic Questions for 2023. Some of these questions concern real estate (inventory, house prices, housing starts, new home sales), and I’ll post thoughts on those in the newsletter (others like GDP and employment will be on this blog).
I'm adding some thoughts, and maybe some predictions for each question.
1) Economic growth: Economic growth was probably close to 1% in 2022 as the economy slowed following the economic rebound in 2021. The FOMC is expecting growth of just 0.4% to 1.0% Q4-over-Q4 in 2023. How much will the economy grow in 2023? Will there be a recession in 2023?
In December I went on "recession watch", for only the 3rd time in the 18 years that I've been writing this blog, but I noted I didn't see a recession coming yet. The other two times were in early 2007 (housing bust), and in March 2020 (pandemic).
Here are the Ten Economic Questions for 2023 and a few predictions:The FOMC is forecasting an employment recession, and many Wall Street analysts are forecasting an economic recession in 2023. BofA is forecasting GDP will contract 0.3% in 2023. In addition, the Congress is threatening to shut down the government in October and - more worrisome - default on the US debt. Defaulting on the debt with an already weak economy will likely push the economy into recession.
Two key leading indicators are suggesting recession in 2023.
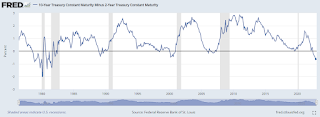 One of the leading indicators for recessions is the yield curve. Here is a graph of 10-Year Treasury Constant Maturity Minus 2-Year Treasury Constant Maturity from FRED.
Click here for interactive graph at FRED.
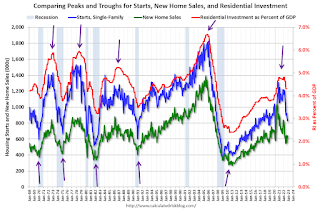 The arrows point to some of the earlier peaks and troughs for these three measures - and the most recent peak.
New home sales and single-family starts turned down last year, but that was partly due to the huge surge in sales during the pandemic - and then rebounded somewhat. Now both new home sales and single-family starts have turned down in response to higher mortgage rates. Residential investment has also peaked.
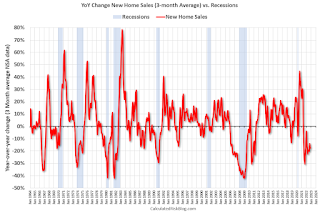 This third graph shows the YoY change in New Home Sales from the Census Bureau. Currently new home sales (based on 3-month average) are down 18% year-over-year.
 One of the leading indicators for recessions is the yield curve. Here is a graph of 10-Year Treasury Constant Maturity Minus 2-Year Treasury Constant Maturity from FRED.
Click here for interactive graph at FRED.
When the yield curve turns negative - the 2-year yields more than the 10-year - that suggests investors think interest rates will decline, usually indicating a coming recession. However, economist Campbell Harvey (yield curve inventor) notes:
My yield-curve indicator has gone Code Red. It is 8 for 8 in forecasting recessions since 1968 —with no false alarms. I have reasons to believe, however, that it is flashing a false signal.One of my favorite models for business cycle forecasting uses new home sales (also housing starts and residential investment). The purpose of the mext graph is to show that these three indicators generally reach peaks and troughs together. Note that Residential Investment is quarterly and single-family starts and new home sales are monthly.
...
The yield curve has now inverted for a ninth time since 1968. Does it spell doom? I am not so sure.
...
These circumstances raise the possibility of dodging the bullet. Ideally, we avoid the hard-landing recession and realize slow growth or minor negative growth. If a recession arrives, it will be mild.
The major wildcard is the Fed, who was late in raising rates. The Fed cannot err twice by overshooting-i.e., continuing to increase rates well beyond when they should have stopped. I believe the time to end the tightening is now.
 The arrows point to some of the earlier peaks and troughs for these three measures - and the most recent peak.
New home sales and single-family starts turned down last year, but that was partly due to the huge surge in sales during the pandemic - and then rebounded somewhat. Now both new home sales and single-family starts have turned down in response to higher mortgage rates. Residential investment has also peaked.
 This third graph shows the YoY change in New Home Sales from the Census Bureau. Currently new home sales (based on 3-month average) are down 18% year-over-year.
Usually when the YoY change in New Home Sales falls about 20%, a recession will follow. An exception for this data series was the mid '60s when the Vietnam buildup kept the economy out of recession. Another exception was in late 2021 - we saw a significant YoY decline in new home sales related to the pandemic and the surge in new home sales in the second half of 2020. I ignored that pandemic distortion. Also note that the sharp decline in 2010 was related to the housing tax credit policy in 2009 - and was just a continuation of the housing bust.
Here is a table of the annual change in real GDP since 2005. Prior to the pandemic, economic activity was mostly in the 2% range since 2010. Given current demographics, that is about what we'd expect: See: 2% is the new 4%..
Note: This table includes both annual change and q4 over the previous q4 (two slightly different measures). For 2022, I used a 2.6% annual growth rate in Q4 2022 (this gives -2.2% Q4 over Q4 or -3.4% real annual growth). This is based on Goldman Sachs estimate: "We left our Q4 GDP tracking estimate unchanged at +2.6% (qoq ar)."
My sense is growth will stay sluggish in 2023, but the economy will avoid recession. Although monetary policy is restrictive, the fiscal policy drag is probably over. Vehicle sales will probably pick up in 2023, but housing will stay low.
Here is a table of the annual change in real GDP since 2005. Prior to the pandemic, economic activity was mostly in the 2% range since 2010. Given current demographics, that is about what we'd expect: See: 2% is the new 4%..
Note: This table includes both annual change and q4 over the previous q4 (two slightly different measures). For 2022, I used a 2.6% annual growth rate in Q4 2022 (this gives -2.2% Q4 over Q4 or -3.4% real annual growth). This is based on Goldman Sachs estimate: "We left our Q4 GDP tracking estimate unchanged at +2.6% (qoq ar)."
| Real GDP Growth | ||
|---|---|---|
| Year | Annual GDP | Q4 / Q4 |
| 2005 | 3.5% | 3.0% |
| 2006 | 2.8% | 2.6% |
| 2007 | 2.0% | 2.2% |
| 2008 | 0.1% | -2.5% |
| 2009 | -2.6% | 0.1% |
| 2010 | 2.7% | 2.8% |
| 2011 | 1.5% | 1.5% |
| 2012 | 2.3% | 1.6% |
| 2013 | 1.8% | 2.5% |
| 2014 | 2.3% | 2.6% |
| 2015 | 2.7% | 1.9% |
| 2016 | 1.7% | 2.0% |
| 2017 | 2.2% | 2.8% |
| 2018 | 2.9% | 2.3% |
| 2019 | 2.3% | 2.6% |
| 2020 | -2.8% | -1.5% |
| 2021 | 5.9% | 5.7% |
| 20221 | 2.0% | 0.9% |
| 1 2022 estimate based on 2.6% Q4 SAAR annualized real growth rate. | ||
My sense is growth will stay sluggish in 2023, but the economy will avoid recession. Although monetary policy is restrictive, the fiscal policy drag is probably over. Vehicle sales will probably pick up in 2023, but housing will stay low.
My guess is that real GDP growth will probably be positive in the 1.0% range in 2023 with downside risk if the FOMC overtightens or Congress forces a debt default. Since two of the best leading indicators are suggesting a recession, I'll stay on recession watch, and I might change my view on a recession in 2023.
• Question #1 for 2023: How much will the economy grow in 2023? Will there be a recession in 2023?
• Question #2 for 2023: How much will job growth slow in 2023? Or will the economy lose jobs?
• Question #3 for 2023: What will the unemployment rate be in December 2023?
• Question #4 for 2023: What will the participation rate be in December 2023?
• Question #5 for 2023: What will the YoY core inflation rate be in December 2023?
• Question #6 for 2023: What will the Fed Funds rate be in December 2023?
• Question #7 for 2023: How much will wages increase in 2023?
• Question #8 for 2023: How much will Residential investment change in 2023? How about housing starts and new home sales in 2023?
• Question #9 for 2023: What will happen with house prices in 2023?
• Question #10 for 2023: Will inventory increase further in 2023?
Q4 GDP Tracking: Solid Q4
by Calculated Risk on 1/13/2023 01:00:00 PM
From BofA:
Overall, our 4Q GDP tracking estimate moved from 1.5% q/q saar as of our last weekly publication to 2.6% q/q saar after our batch update [Jan 6th estimate]From Goldman:
emphasis added
We left our Q4 GDP tracking estimate unchanged at +2.6% (qoq ar). [Jan 10th estimate]And from the Altanta Fed: GDPNow
The GDPNow model estimate for real GDP growth (seasonally adjusted annual rate) in the fourth quarter of 2022 is 4.1 percent on January 10, up from 3.8 percent on January 5. [Jan 10th estimate]
3rd Look at Local Housing Markets in December
by Calculated Risk on 1/13/2023 09:57:00 AM
Today, in the Calculated Risk Real Estate Newsletter: 3rd Look at Local Housing Markets in December
A brief excerpt:
This is the third look at local markets in December. I’m tracking about 40 local housing markets in the US. Some of the 40 markets are states, and some are metropolitan areas. I’ll update these tables throughout the month as additional data is released.There is much more in the article. You can subscribe at https://calculatedrisk.substack.com/
Closed sales in December were mostly for contracts signed in October and November. Since 30-year fixed mortgage rates were over 7% for most of October (no points) and averaged 6.8% in November (Freddie PMMS with points) closed sales were probably impacted significantly in December.
From the Houston Association of REALTORS®: The Economic Headwinds of 2022 Bring Houston’s Home Sales Hot Streak to an EndFor the month of December, single-family home sales dropped 32.6 percent. That marks the ninth straight monthly decline of 2022 and the steepest. … The median price of a single-family home – the figure at which half of the homes sold for more and half sold for less – was $330,000 in December. That is the third straight month it has held at that level and is 3.8 percent higher than last December.
emphasis addedHere is a summary of active listings for these housing markets in December.
Inventory in these markets were down 30% YoY in January 2022 and are now up 76% YoY! So, this is a significant change from early in 2022, and about the same YoY inventory increase as in November (up 72% YoY).
Notes for all tables:
1) New additions to table in BOLD.
2) Northwest (Seattle), Santa Clara (San Jose), Jacksonville, Source: Northeast Florida Association of REALTORS®
3) Totals do not include Atlanta, or Denver (included in state totals)
...
Many more local markets to come!

Thursday, January 12, 2023
Question #2 for 2023: How much will job growth slow in 2023? Or will the economy lose jobs?
by Calculated Risk on 1/12/2023 02:55:00 PM
Earlier I posted some questions on my blog for next year: Ten Economic Questions for 2023. Some of these questions concern real estate (inventory, house prices, housing starts, new home sales), and I’ll post thoughts on those in the newsletter (others like GDP and employment will be on this blog).
I'm adding some thoughts, and maybe some predictions for each question.
2) Employment: The economy added 4.5 million jobs in 2022. This makes 2022 the second-best year for job growth in US history, only behind the 6.7 million jobs added in 2021. How much will job growth slow in 2023? Or will the economy lose jobs?
The FOMC doesn't project job growth, but they do project the unemployment rate. Currently the FOMC is forecasting the unemployment rate will increase to the 4.4% to 4.7% range in Q4 2023. Depending on their outlook for population growth and the participation rate, it appears the FOMC is essentially forecasting between 1 million and 1 1/2 million job losses in 2023. That is a significant employment recession.
Here is a look at the job changes during previous recessions.
| Job Changes During Recessions | ||
|---|---|---|
| Year | Job Change | Recession |
| 1974 | -379 | '73-'75 |
| 1975 | 365 | '73-'75 |
| 1980 | 271 | '80 |
| 1981 | -48 | '81-'82 |
| 1982 | -2,124 | '81-'82 |
| 1990 | 330 | '90-'91 |
| 1991 | -838 | '90-91 |
| 2001 | -1,727 | '01 |
| 2002 | -510 | '01 |
| 2008 | -3,553 | '07-'09 |
| 2009 | -5,051 | '07-'09 |
| 2020 | -9,292 | '20 |
The 2020 recession was due to the pandemic. The '07 to '09 recession was due to the financial crisis following the housing bubble, and the '01 recession was related to the bursting of the stock bubble. Excluding the pandemic and bursting bubbles, only the '81-'82 recession had comparable job losses to the FOMC forecast, and that was a very deep recession.
Job losses in construction haven't started yet because a record number of housing units are under construction. But those losses are already coming.
My sense is the FOMC is overly pessimistic, and my guess is there will be something like 400 to 800 thousand jobs added in 2023. It will depend on inflation and FOMC policy. If the Fed drives the economy into recession (to cool inflation), then we could see job losses in 2023.
Here are the Ten Economic Questions for 2023 and a few predictions:
• Question #1 for 2023: How much will the economy grow in 2023? Will there be a recession in 2023?
• Question #2 for 2023: How much will job growth slow in 2023? Or will the economy lose jobs?
• Question #3 for 2023: What will the unemployment rate be in December 2023?
• Question #4 for 2023: What will the participation rate be in December 2023?
• Question #5 for 2023: What will the YoY core inflation rate be in December 2023?
• Question #6 for 2023: What will the Fed Funds rate be in December 2023?
• Question #7 for 2023: How much will wages increase in 2023?
• Question #8 for 2023: How much will Residential investment change in 2023? How about housing starts and new home sales in 2023?
• Question #9 for 2023: What will happen with house prices in 2023?
• Question #10 for 2023: Will inventory increase further in 2023?
Cleveland Fed: Median CPI increased 0.4% and Trimmed-mean CPI increased 0.4% in December
by Calculated Risk on 1/12/2023 11:58:00 AM
The Cleveland Fed released the median CPI and the trimmed-mean CPI:
According to the Federal Reserve Bank of Cleveland, the median Consumer Price Index rose 0.4% in December. The 16% trimmed-mean Consumer Price Index increased 0.4% in December. "The median CPI and 16% trimmed-mean CPI are measures of core inflation calculated by the Federal Reserve Bank of Cleveland based on data released in the Bureau of Labor Statistics’ (BLS) monthly CPI report".
 Click on graph for larger image.
This graph shows the year-over-year change for these four key measures of inflation.
On a year-over-year basis, the median CPI rose 6.9%, the trimmed-mean CPI rose 6.5%, and the CPI less food and energy rose 5.7%. Core PCE is for November and increased 4.7% year-over-year.
Note: The Cleveland Fed released the median CPI details. "Fuel oil and other fuels" decreased at a 78% annualized rate in December, and "Used Cars" decreased at a 27% annualized rate.
Note that Owners' Equivalent Rent and Rent of Primary Residence account for almost 1/3 of median CPI, and these measures were up an average of close to 10% annualized. This data is lagged, and rents have been declining in recent months. To reflect this, I've added core CPI ex-shelter, and that has declined to 4.4% YoY.


