 RSS Feed
 by Calculated Risk on 1/20/2023 10:46:00 AM
Friday, January 20, 2023
NAR: Existing-Home Sales Decreased to 4.02 million SAAR in December; Median Prices Down 11.3% from Peak in June 2022
Today, in the CalculatedRisk Real Estate Newsletter: NAR: Existing-Home Sales Decreased to 4.02 million SAAR in December
Excerpt:
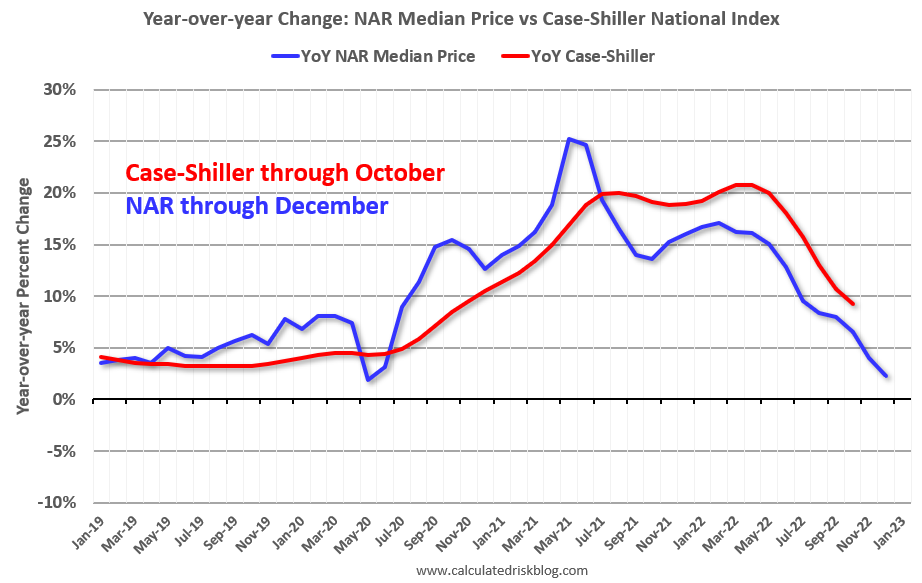
On prices, the NAR reported:There is much more in the article. You can subscribe at https://calculatedrisk.substack.com/ Please subscribe!The median existing-home price for all housing types in December was $366,900, an increase of 2.3% from December 2021 ($358,800), as prices rose in all regions. This marks 130 consecutive months of year-over-year increases, the longest-running streak on record.Median prices are distorted by the mix (repeat sales indexes like Case-Shiller and FHFA are probably better for measuring prices).
The YoY change in the median price peaked at 25.2% in May 2021 and has now slowed to 2.3%. The YoY increase in December was the lowest since May 2020. Note that the median price usually starts falling seasonally in July, so the 1.5% decline in December in the median price was partially seasonal, however the 11.3% decline in the median price over the last six months has been much larger than the usual seasonal decline.
It is likely the median price will be down year-over-year in a few months - and Case-Shiller will follow.
NAR: Existing-Home Sales Decreased to 4.02 million SAAR in December
by Calculated Risk on 1/20/2023 10:11:00 AM
From the NAR: Existing-Home Sales Receded 1.5% in December
Existing-home sales retreated for the eleventh consecutive month in December, according to the National Association of Realtors®. Three of the four major U.S. regions recorded month-over-month drops, while sales in the West were unchanged. All regions experienced year-over-year declines.
Total existing-home sales, completed transactions that include single-family homes, townhomes, condominiums and co-ops – decreased 1.5% from November to a seasonally adjusted annual rate of 4.02 million in December. Year-over-year, sales sagged 34.0% (down from 6.09 million in December 2021).
...
Total housing inventory registered at the end of December was 970,000 units, which was down 13.4% from November but up 10.2% from one year ago (880,000). Unsold inventory sits at a 2.9-month supply at the current sales pace, down from 3.3 months in November but up from 1.7 months in December 2021.
emphasis added
 Click on graph for larger image.
This graph shows existing home sales, on a Seasonally Adjusted Annual Rate (SAAR) basis since 1993.
Sales in December (4.02 million SAAR) were down 1.5% from the previous month and were 34.0% below the December 2021 sales rate.
Sales were just above the pandemic low of 4.01 million SAAR.
The second graph shows nationwide inventory for existing homes.
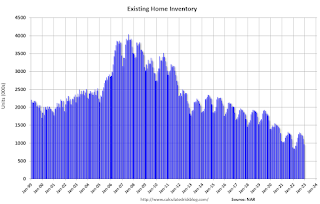 According to the NAR, inventory decreased to 0.97 million in December from 1.12 million in November.
The second graph shows nationwide inventory for existing homes.
 According to the NAR, inventory decreased to 0.97 million in December from 1.12 million in November.
Headline inventory is not seasonally adjusted, and inventory usually decreases to the seasonal lows in December and January, and peaks in mid-to-late summer.
The last graph shows the year-over-year (YoY) change in reported existing home inventory and months-of-supply. Since inventory is not seasonally adjusted, it really helps to look at the YoY change. Note: Months-of-supply is based on the seasonally adjusted sales and not seasonally adjusted inventory.
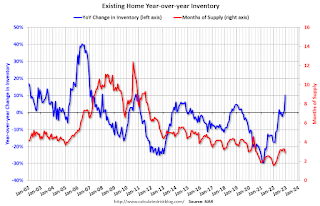 Inventory was up 10.2% year-over-year (blue) in December compared to December 2021.
Months of supply (red) decreased to 2.9 months in December from 3.3 months in November.
This was above the consensus forecast. I'll have more later.
The last graph shows the year-over-year (YoY) change in reported existing home inventory and months-of-supply. Since inventory is not seasonally adjusted, it really helps to look at the YoY change. Note: Months-of-supply is based on the seasonally adjusted sales and not seasonally adjusted inventory.
 Inventory was up 10.2% year-over-year (blue) in December compared to December 2021.
 Months of supply (red) decreased to 2.9 months in December from 3.3 months in November.
This was above the consensus forecast. I'll have more later.
Monetary Policy: The Pause that Refreshes?
by Calculated Risk on 1/20/2023 09:14:00 AM
This morning BofA economists noted a possible shift in FOMC policy:
[O]ur baseline outlook for monetary policy includes 25bp rate hikes in February, March, and May of this year.This is close to my current view: Question #6 for 2023: What will the Fed Funds rate be in December 2023?
That said, if the Fed is comfortable downshifting to 25bp in February, it may be a signal that the committee is closer to terminal than it (and we) thought as recently as December. Recent trends in inflation look more favorable – and trends in economic activity look less favorable – than the median FOMC member projected in December. Should these trends continue, it could open the door for a pause in rate hikes as early as the March FOMC meeting (at a terminal of 4.75-5.0%). FOMC participants could justify this on account of risk management – pausing to assess the lagged effects of prior tightening – or from a real policy rate perspective. The December projections suggest the median member desires a real policy rate of around 150bp; an earlier pause to hikes would prevent monetary policy from becoming “too tight” as inflation falls. Again, this is not our baseline outlook, but, if history is any guide, turning points in the economy can be abrupt, and we cannot rule out an earlier end to policy rate tightening based on the November-December data flow.
Thursday, January 19, 2023
Friday: Existing Home Sales
by Calculated Risk on 1/19/2023 08:36:00 PM
 Note: Mortgage rates are from MortgageNewsDaily.com and are for top tier scenarios.
Friday:
• At 10:00 AM ET, Existing Home Sales for December from the National Association of Realtors (NAR). The consensus is for 3.95 million SAAR, down from 4.09 million.
"Short Memories"
by Calculated Risk on 1/19/2023 04:46:00 PM
This was written in 2014, but I never published it!
A short comment on "short memories" ...
Voters have "short memories". Sometimes "short memories" are good. Albert Schweitzer once said, "Happiness is nothing more than good health and a bad memory".
Many people think having a short memory is helpful in sports (not letting previous failures bother you) and in life (forgetting bad things and / not holding a grudge / letting go).
But for the economy and policy, short memories are a negative. There will be always be another generation of financial alchemists who think they can turn radioactive waste into gold. And once again the riches will flow, until the economy suffers. The next serious bubble and crash is coming, we just don't know when.
For policy, forgetting what actually happened (with the help of political spinners) is standard practice. We'd actually have much better policy if voters had better memories, but unfortunately, they don't. Politicians take advantage of this collective forgetfulness and act up in odd years - something everyone should be aware of as we head into 2015 (edit: now 2023) (I expect some episodes of DC craziness).
As far as the "debt ceiling", the "debt ceiling" sounds virtuous, when, in reality, the vote is about whether or not to the pay the bills - and not paying the bills is reckless and irresponsible. The "debt ceiling" is redundant (once a budget or a continuing resolution is passed, then the impact on the debt is pretty much known). This is like someone not paying their credit card bill to teach themselves not to use so much credit! Irresponsible.
I prefer the term "default ceiling" because that is what it is.
best to all.
"Some BIG Changes to Mortgage Costs Were Just Announced"
by Calculated Risk on 1/19/2023 03:30:00 PM
From Matthew Graham at Mortgage News Daily: Some BIG Changes to Mortgage Costs Were Just Announced
In a single moment, the fees for a vast majority of new mortgages in the US have changed. In some cases, the changes are drastic, both for better and worse. Let's break it down.See Matt's article for a breakdown of what changed.
What do you mean by "fees/costs?"
This refers to Loan Level Price Adjustments (LLPAs) imposed by Fannie Mae and Freddie Mac (the "agencies"), the two entities that guaranty a vast majority of new mortgages. LLPAs are based on loan features such as your credit score, the loan-to-value ratio, occupancy (owner vs non-owner occupied homes), and most recently, your debt-to-income ratio
What lenders/loans does this apply to?
Any loan guaranteed by one of the agencies regardless of the lender. This is MOST loans in the US. Examples of loans that wouldn't be affected would be FHA/VA as well as certain jumbo and specialty products. "Non-conforming" loans are not impacted by this as they are not guaranteed by the agencies. A common example of a non-conforming loan would be a jumbo loan from a retail bank or credit union.
When does this take effect?
This applies to loans that are guaranteed by the agencies starting May 1st, 2023. That means many lenders will begin to implement the changes in March/April.
Here is the announcement from the FHFA: FHFA Announces Updates to the Enterprises’ Single-Family Pricing Framework. The changes are here.
December Housing Starts: Record Number of Housing Units Under Construction
by Calculated Risk on 1/19/2023 09:33:00 AM
Today, in the CalculatedRisk Real Estate Newsletter: December Housing Starts: Record Number of Housing Units Under Construction
Excerpt:
Possibly Important: Multi-family permits averaged 536,000 SAAR over the last two months after averaging close to 650,000 SAAR over the previous 8 months. This decline in permits is a possible signal that the expected decline in multi-family starts has begun (although permits aren’t a perfect leading indicator for starts).There is much more in the post. You can subscribe at https://calculatedrisk.substack.com/
...
The fifth graph shows housing starts under construction, Seasonally Adjusted (SA).
Red is single family units. Currently there are 769 thousand single family units (red) under construction (SA). This was up slightly in December compared to November, but 59 thousand below the recent peak in April and May. Single family units under construction have peaked since single family starts are now declining. The reason there are so many homes under construction is probably due to supply constraints.
Blue is for 2+ units. Currently there are 943 thousand multi-family units under construction. This is the highest level since December 1973! For multi-family, construction delays are probably also a factor. The completion of these units should help with rent pressure.
Combined, there are an all-time record 1.712 million units under construction.
...
The recent weakness has been mostly for single family starts; however, it appears the expected decline in multi-family starts has begun.

Weekly Initial Unemployment Claims decrease to 190,000
by Calculated Risk on 1/19/2023 08:41:00 AM
The DOL reported:
In the week ending January 14, the advance figure for seasonally adjusted initial claims was 190,000, a decrease of 15,000 from the previous week's unrevised level of 205,000. The 4-week moving average was 206,000, a decrease of 6,500 from the previous week's unrevised average of 212,500.The following graph shows the 4-week moving average of weekly claims since 1971.
emphasis added
 Click on graph for larger image.
The dashed line on the graph is the current 4-week average. The four-week average of weekly unemployment claims decreased to 206,000.
The previous week was unrevised.
Weekly claims were below the consensus forecast.
Housing Starts Decreased to 1.382 million Annual Rate in December
by Calculated Risk on 1/19/2023 08:37:00 AM
From the Census Bureau: Permits, Starts and Completions
Housing Starts:
Privately‐owned housing starts in December were at a seasonally adjusted annual rate of 1,382,000. This is 1.4 percent below the revised November estimate of 1,401,000 and is 21.8 percent below the December 2021 rate of 1,768,000. Single‐family housing starts in December were at a rate of 909,000; this is 11.3 percent above the revised November figure of 817,000. The December rate for units in buildings with five units or more was 463,000.
An estimated 1,553,300 housing units were started in 2022. This is 3.0 percent below the 2021 figure of 1,601,000.
Building Permits:
Privately‐owned housing units authorized by building permits in December were at a seasonally adjusted annual rate of 1,330,000. This is 1.6 percent below the revised November rate of 1,351,000 and is 29.9 percent below the December 2021 rate of 1,896,000. Single‐family authorizations in December were at a rate of 730,000; this is 6.5 percent below the revised November figure of 781,000. Authorizations of units in buildings with five units or more were at a rate of 555,000 in December.
An estimated 1,649,400 housing units were authorized by building permits in 2022. This is 5.0 percent below the 2021 figure of 1,737,000.
emphasis added
 Click on graph for larger image.
The first graph shows single and multi-family housing starts for the last several years.
Multi-family starts (blue, 2+ units) decreased in December compared to November. Multi-family starts were down 14.9% year-over-year in December.
Single-family starts (red) increased in December and were down 25.0% year-over-year.
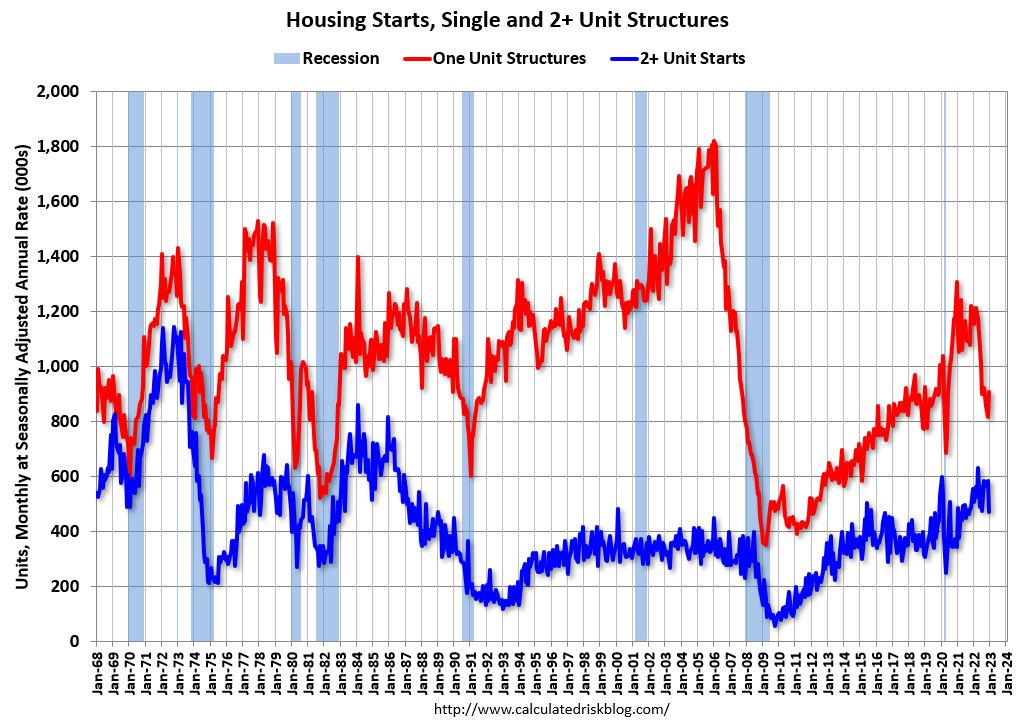 The second graph shows single and multi-family housing starts since 1968.
 This shows the huge collapse following the housing bubble, and then the eventual recovery - and the recent collapse in single-family starts.
Total housing starts in December were above expectations, however, starts in October and November were revised down, combined.
I'll have more later …
Wednesday, January 18, 2023
Thursday: Housing Starts, Unemployment Claims, Philly Fed Mfg
by Calculated Risk on 1/18/2023 09:02:00 PM
 Note: Mortgage rates are from MortgageNewsDaily.com and are for top tier scenarios.
Thursday:
• At 8:30 AM: The initial weekly unemployment claims report will be released. The consensus is for 212 thousand initial claims, up from 205 thousand last week.
• At 8:30 AM: Housing Starts for December. The consensus is for 1.358 million SAAR, down from 1.427 million SAAR.
• At 8:30 AM: the Philly Fed manufacturing survey for January.


