 RSS Feed
 by Calculated Risk on 1/25/2023 12:20:00 PM
Wednesday, January 25, 2023
Black Knight: Mortgage Delinquency Rate Increased in December; Prepayments at Record Low
From Black Knight: Black Knight’s First Look: Mortgage Delinquencies Closed 2022 Down 9% for the Year, While Prepayments Hit Third Consecutive Record Low
• The national delinquency rate inched up 7 basis points in the month to 3.08%, but finished the year 30 basis points (-9%) below its December 2021 levelAccording to Black Knight's First Look report, the percent of loans delinquent increased 2.3% in December compared to November and decreased 9% year-over-year.
• Prepayment activity fell to 0.39% – with single month mortality (SMM) hitting its third consecutive record low dating back to 2000 when Black Knight began reporting the metric
• Serious delinquencies (90+ days past due) continued to improve nationally despite an 8.7K rise in Florida in the wake of Hurricane Ian, with 44 other states seeing seriously past-due volumes decline in the month
• Borrowers 30 days late increased by 40K, up 4.8%, while 60-day delinquencies stayed flat
• Foreclosure starts increased by 15% in the month to 26,900 – the third consecutive increase, but still 30% below pre-pandemic levels
• Foreclosure was started on 4.9% of serious delinquencies in December, up from November, but still 46% below the start rate seen in December 2019 prior to the pandemic
• Active foreclosure inventory rose by 2.3% in the month, though volumes remained subdued throughout 2022 after the record lows of 2021 due to widespread moratoriums and forbearance protections
emphasis added
Black Knight reported the U.S. mortgage delinquency rate (loans 30 or more days past due, but not in foreclosure) was 3.08% in December, up from 3.01% in November.
The percent of loans in the foreclosure process increased slightly in December to 0.37%, from 0.37% in November.
The number of delinquent properties, but not in foreclosure, is down 146,000 properties year-over-year, and the number of properties in the foreclosure process is up 70,000 properties year-over-year.
| Black Knight: Percent Loans Delinquent and in Foreclosure Process | ||||
|---|---|---|---|---|
| Dec 2022 | Nov 2022 | Dec 2021 | Dec 2020 | |
| Delinquent | 3.08% | 3.01% | 3.38% | 6.08% |
| In Foreclosure | 0.37% | 0.37% | 0.24% | 0.33% |
| Number of properties: | ||||
| Number of properties that are delinquent, but not in foreclosure: | 1,653,000 | 1,612,000 | 1,799,000 | 3,251,000 |
| Number of properties in foreclosure pre-sale inventory: | 198,000 | 196,000 | 128,000 | 178,000 |
| Total Properties | 1,850,000 | 1,808,000 | 1,927,000 | 3,429,000 |
AIA: Architecture Billings "Continue to Decline" in December
by Calculated Risk on 1/25/2023 10:06:00 AM
Note: This index is a leading indicator primarily for new Commercial Real Estate (CRE) investment.
From the AIA: Architecture billings continue to decline
Demand for design services from U.S. architecture firms continued to contract in December, according to a new report from the American Institute of Architects (AIA).
The pace of decline during December slowed from November, posting an Architecture Billings Index (ABI) score of 47.5 from 46.6 (any score below 50 indicates a decline in firm billings). Inquiries into new projects posted a positive score of 52.3, however new design contracts remained in negative territory with a score of 49.4.
“Despite strong revenue growth last year, architecture firms have modest expectations regarding business conditions this coming year,” said AIA Chief Economist Kermit Baker, PhD, Hon. AIA. “With ABI scores for the entire fourth quarter of 2022 in negative territory, a slowdown in construction activity is expected later this year, though the depth of the downturn remains unclear.”
...
• Regional averages: Midwest (49.4); South (48.6); Northeast (46.5); West (45.5)
• Sector index breakdown: mixed practice (54.8); institutional (47.3); commercial/industrial (45.2); multi-family residential (44.3)
emphasis added
 Click on graph for larger image.
This graph shows the Architecture Billings Index since 1996. The index was at 47.5 in December, up from 46.6 in November. Anything below 50 indicates contraction in demand for architects' services.
Note: This includes commercial and industrial facilities like hotels and office buildings, multi-family residential, as well as schools, hospitals and other institutions.
This index had been positive for 20 consecutive months but indicated a decline the last three months. This index usually leads CRE investment by 9 to 12 months, so this index suggests a pickup in CRE investment in early 2023, but a slowdown in CRE investment later in 2023.
Note that multi-family billing turned down in September and has been negative for four consecutive months and is at the lowest level since May 2020. This suggests we will see a downturn in multi-family starts sometime in 2023 (multi-family starts probably have already peaked).
MBA: Mortgage Applications Increase in Latest Weekly Survey
by Calculated Risk on 1/25/2023 07:00:00 AM
From the MBA: Mortgage Applications Increase in Latest MBA Weekly Survey
Mortgage applications increased 7.0 percent from one week earlier, according to data from the Mortgage Bankers Association’s (MBA) Weekly Mortgage Applications Survey for the week ending January 20, 2023. This week’s results include an adjustment for the observance of Martin Luther King, Jr. Day.
... The Refinance Index increased 15 percent from the previous week and was 77 percent lower than the same week one year ago. The seasonally adjusted Purchase Index increased 3 percent from one week earlier. The unadjusted Purchase Index decreased 1 percent compared with the previous week and was 39 percent lower than the same week one year ago.
“Mortgage rates declined for the third straight week, which is good news for potential homebuyers looking ahead to the spring homebuying season. Mortgage rates on most loan types decreased last week and the 30-year fixed rate reached its lowest level since September 2022 at 6.2 percent,” said Joel Kan, MBA’s Vice President and Deputy Chief Economist. “Overall applications increased with both gains in purchase and refinance activity, but purchase applications remained almost 39 percent lower than a year ago. Homebuying activity remains tepid, but if rates continue to fall and home prices cool further, we expect to see potential buyers come back into the market. Many have been waiting for affordability challenges to subside.”
Added Kan, “Despite a 15 percent increase in refinances, they were still 77 percent behind last year’s pace, as rates remained more than two percentage points higher, thus providing very little refinance incentive for most borrowers who are locked into lower rates.”
...
The average contract interest rate for 30-year fixed-rate mortgages with conforming loan balances ($726,200 or less) decreased to 6.20 percent from 6.23 percent, with points increasing to 0.69 from 0.67 (including the origination fee) for 80 percent loan-to-value ratio (LTV) loans.
emphasis added
 Click on graph for larger image.
The first graph shows the refinance index since 1990.
With higher mortgage rates, the refinance index declined sharply in 2022.
Three weeks ago, the refinance index was at the lowest level since the year 2000, but it has rebounded a little as rates declined.
The second graph shows the MBA mortgage purchase index.
 According to the MBA, purchase activity is down 39% year-over-year unadjusted.
Note: Red is a four-week average (blue is weekly).
Tuesday, January 24, 2023
Wednesday: MBA Mortgage Applications, Architecture Billings
by Calculated Risk on 1/24/2023 08:33:00 PM
 Note: Mortgage rates are from MortgageNewsDaily.com and are for top tier scenarios.
Wednesday:
• At 7:00 AM ET, The Mortgage Bankers Association (MBA) will release the results for the mortgage purchase applications index.
• During the day, The AIA's Architecture Billings Index for December (a leading indicator for commercial real estate).
BLS: Alaska and Pennsylvania Set New Record Series Low Unemployment rates in December
by Calculated Risk on 1/24/2023 11:07:00 AM
From the BLS: Regional and State Employment and Unemployment Summary
Unemployment rates were higher in December in 7 states, lower in 5 states, and stable in 38 states and the District of Columbia, the U.S. Bureau of Labor Statistics reported today. Thirty-five states and the District had jobless rate decreases from a year earlier, 4 states had increases, and 11 states had little change.Two states set new series record low unemployment rates in December.
...
Utah had the lowest jobless rate in December, 2.2 percent. The next lowest rates were in North Dakota and South Dakota, 2.3 percent each. The rates in Alaska (4.3 percent) and Pennsylvania (3.9 percent) set new series lows. (All state series begin in 1976.) Nevada had the highest unemployment rate, 5.2 percent.
emphasis added
Final Look at Local Housing Markets in December
by Calculated Risk on 1/24/2023 08:48:00 AM
Today, in the Calculated Risk Real Estate Newsletter: Final Look at Local Housing Markets in December
A brief excerpt:
The big story for December existing home sales was the sharp year-over-year (YoY) decline in sales. Another key story was that new listings were down further YoY in December as many potential sellers are locked into their current home (low mortgage rate). And active inventory increased sharply YoY.There is much more in the article. You can subscribe at https://calculatedrisk.substack.com/
This is the final look at local markets in December. I’m tracking about 40 local housing markets in the US. Some of the 40 markets are states, and some are metropolitan areas. I update these tables throughout each month as additional data is released.
NOTE: Hopefully I’ll be adding more markets next month!
First, here is a table comparing the year-over-year Not Seasonally Adjusted (NSA) declines in sales this year from the National Association of Realtors® (NAR) with the local markets I track. So far, these measures have tracked closely. The NAR reported sales were down 36.3% NSA YoY in December.
...
More local data coming in February for activity in January!
My early expectation is we will see a somewhat smaller YoY sales decline in January, than in December, due to the decrease in mortgage rates in December (January sales are mostly for contracts signed in November and December).

Monday, January 23, 2023
Tuesday: Richmond Fed Mfg
by Calculated Risk on 1/23/2023 09:05:00 PM
 From Matthew Graham at Mortgage News Daily: Mortgage Rates Drift Slightly Higher
After hitting the lowest levels in 4 months at times over the past week, rates have drifted up a bit. There hasn't been much rhyme or reason behind the bounce. ... The week ahead is a bit of a wild card as there are no hotly anticipated events on tap. Some market participants might make a case that the first look at Q4 GDP on Thursday or the PCE inflation on Friday are exceptions to that claim, but they pale in comparison to next week's Fed announcement and Friday's jobs report. [30 year fixed 6.20%]Tuesday:
emphasis added
• At 10:00 AM ET, Richmond Fed Survey of Manufacturing Activity for January.
• Also at 10:00 AM, State Employment and Unemployment (Monthly) for December 2022.
MBA Survey: "Share of Mortgage Loans in Forbearance Remains Flat at 0.70% in December"
by Calculated Risk on 1/23/2023 04:00:00 PM
Note: This is as of December 31st.
From the MBA: Share of Mortgage Loans in Forbearance Remains Flat at 0.70% in December
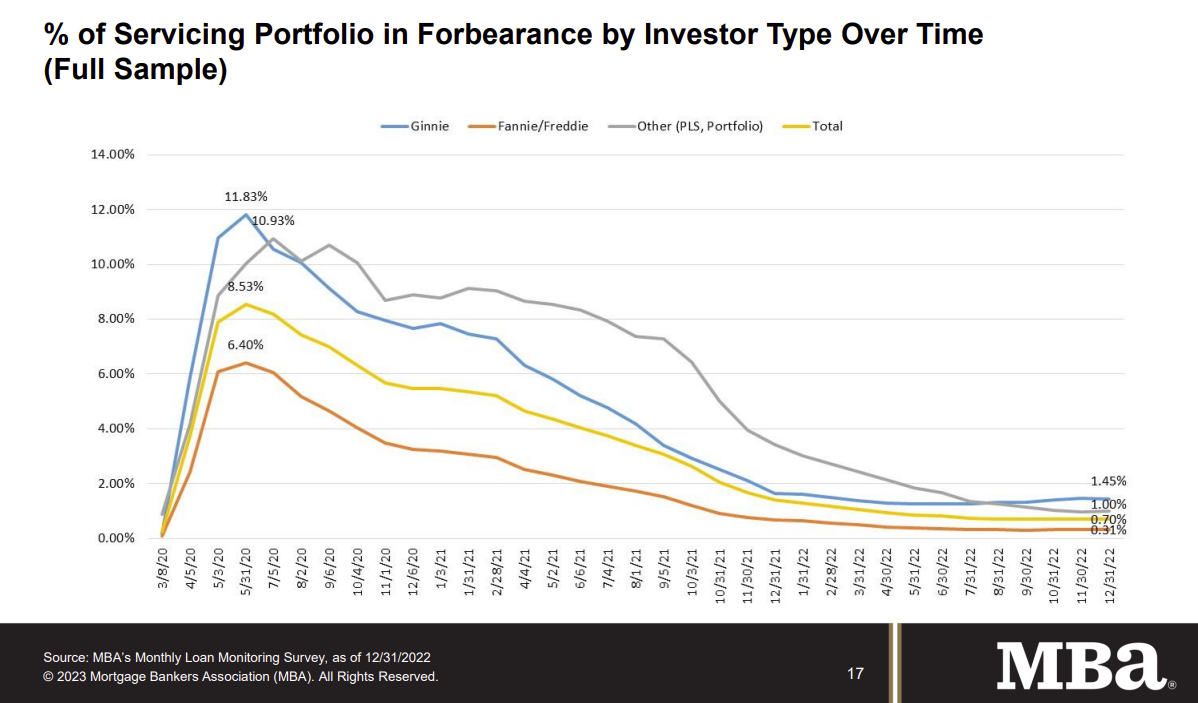
The Mortgage Bankers Association’s (MBA) monthly Loan Monitoring Survey revealed that the total number of loans now in forbearance remained flat relative to the prior month at 0.70% as of December 31, 2022. According to MBA’s estimate, 350,000 homeowners are in forbearance plans.
The share of Fannie Mae and Freddie Mac loans in forbearance decreased 1 basis point to 0.31%. Ginnie Mae loans in forbearance decreased 1 basis point to 1.45%, and the forbearance share for portfolio loans and private-label securities (PLS) increased 3 basis points to 1.00%.
“For three consecutive months, the forbearance rate has remained flat — an indicator that we may have reached a floor on further improvements,” said Marina Walsh, CMB, MBA’s Vice President of Industry Analysis. “New forbearance requests and re-entries continue to trickle in at about the same pace as forbearance exits. The overall performance of servicing portfolios was also flat compared to the previous month, but there was some deterioration in the performance of Ginnie Mae loans.”
Added Walsh, “Forbearance remains an option for struggling homeowners and its usage may continue, especially if unemployment increases as expected. MBA is forecasting for the unemployment rate to reach 5.2 percent in the second half of 2023, up from its current level of 3.5 percent.”
emphasis added
 Click on graph for larger image.
This graph shows the percent of portfolio in forbearance by investor type over time.
The share of forbearance plans had been decreasing, although the percent in forbearance was unchanged in November and December.
At the end of December, there were about 350,000 homeowners in forbearance plans.
LA Port Inbound Traffic Down 20% YoY in December
by Calculated Risk on 1/23/2023 01:18:00 PM
Notes: The expansion to the Panama Canal was completed in 2016 (As I noted several years ago), and some of the traffic that used the ports of Los Angeles and Long Beach is probably going through the canal. This might be impacting TEUs on the West Coast.
Container traffic gives us an idea about the volume of goods being exported and imported - and usually some hints about the trade report since LA area ports handle about 40% of the nation's container port traffic.
The following graphs are for inbound and outbound traffic at the ports of Los Angeles and Long Beach in TEUs (TEUs: 20-foot equivalent units or 20-foot-long cargo container).
To remove the strong seasonal component for inbound traffic, the first graph shows the rolling 12-month average.
 Click on graph for larger image.
On a rolling 12-month basis, inbound traffic decreased 1.6% in December compared to the rolling 12 months ending in November. Outbound traffic increased 1.1% compared to the rolling 12 months ending the previous month.
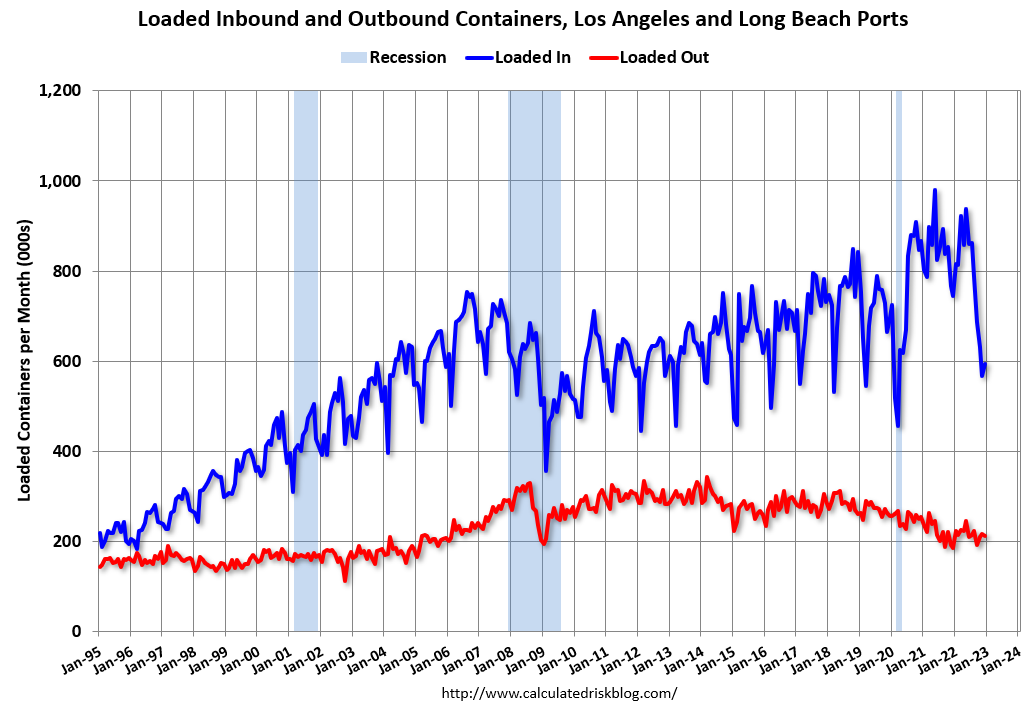
The 2nd graph is the monthly data (with a strong seasonal pattern for imports).
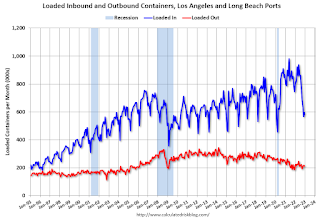 Usually imports peak in the July to October period as retailers import goods for the Christmas holiday, and then decline sharply and bottom in February or March depending on the timing of the Chinese New Year.
 Usually imports peak in the July to October period as retailers import goods for the Christmas holiday, and then decline sharply and bottom in February or March depending on the timing of the Chinese New Year.
Imports were down 20% YoY in December, and exports were up 15% YoY.
It is possible that exports have bottomed after declining for several years (even prior to the pandemic).
1.51 million Total Housing Completions in 2022 including Manufactured Homes; Most Since 2007
by Calculated Risk on 1/23/2023 09:36:00 AM
Today, in the CalculatedRisk Real Estate Newsletter: 1.51 million Total Housing Completions in 2022 including Manufactured Homes; Most Since 2007
Excerpt:
Although total housing starts decreased 3.0% in 2022 compared to 2021, completions increased year-over-year. Construction delays impacted completions in 2022, and that left a record number of housing units under construction. However, there still were 1.507 million total completions and placements in 2021, the most since 2007.There is much more in the article. You can subscribe at https://calculatedrisk.substack.com/ Please subscribe!
Not counting Manufactured homes, there are 1.392 million completions in 2022, up from 1.341 million in 2021, and also the most since 2007.
This graph shows total housing completions and placements since 1968 through 2022. Note that the net addition to the housing stock is less because of demolitions and destruction of older housing units. The housing start report last week indicated 1,021.9 thousand single family completions in 2022, 10.0 thousand in 2-to-4 units, and 360.4 thousand in 5+ units.


