 RSS Feed
 by Calculated Risk on 1/27/2023 08:41:00 AM
Friday, January 27, 2023
Personal Income increased 0.2% in December; Spending decreased 0.2%
The BEA released the Personal Income and Outlays report for December:
Personal income increased $49.5 billion (0.2 percent) in December, according to estimates released today by the Bureau of Economic Analysis. Disposable personal income (DPI) increased $49.2 billion (0.3 percent) and personal consumption expenditures (PCE) decreased $41.6 billion (0.2 percent).The December PCE price index increased 5.0 percent year-over-year (YoY), down from 5.5 percent YoY in November, and down from the recent peak of 7.0 percent in June 2022.
The PCE price index increased 0.1 percent. Excluding food and energy, the PCE price index increased 0.3 percent. Real DPI increased 0.2 percent in December and Real PCE decreased 0.3 percent; goods decreased 0.9 percent and services were unchanged.
emphasis added
The PCE price index, excluding food and energy, increased 4.4 percent YoY, down from 4.7 percent in November, and down from the recent peak of 5.4 percent in February 2022.
The following graph shows real Personal Consumption Expenditures (PCE) through December 2022 (2012 dollars). Note that the y-axis doesn't start at zero to better show the change.
 Click on graph for larger image.
The dashed red lines are the quarterly levels for real PCE.
Personal income was at expectations, and the decrease in PCE was slightly below expectations.
Inflation was close to expectations.
Thursday, January 26, 2023
Friday: Personal Income and Outlays, Pending Home Sales
by Calculated Risk on 1/26/2023 08:49:00 PM
 Note: Mortgage rates are from MortgageNewsDaily.com and are for top tier scenarios.
Friday:
• At 8:30 AM ET, Personal Income and Outlays for December. The consensus is for a 0.2% increase in personal income, and for a 0.1% decrease in personal spending. And for the Core PCE price index to increase 0.3%. PCE prices are expected to be up 5.0% YoY, and core PCE prices up 4.4% YoY.
• At 10:00 AM, Pending Home Sales Index for December. The consensus is for a -1.0% decrease in the index.
• Also at 10:00 AM, University of Michigan's Consumer sentiment index (Final for January). The consensus is for a reading of 64.6.
A Few Comments on Q4 GDP and Investment
by Calculated Risk on 1/26/2023 01:47:00 PM
Note: The first two graphs - Investment Contributions and Residential Investment as a percent of GDP - are useful in predicting Fed induced recessions. RI as a percent of GDP usually turns down well in advance of a recession. This is something I'm watching.
Earlier from the BEA: Gross Domestic Product, Fourth Quarter 2022 (Advance Estimate)
Real gross domestic product (GDP) increased at an annual rate of 2.9 percent in the fourth quarter of 2022, according to the "advance" estimate released by the Bureau of Economic Analysis. In the third quarter, real GDP increased 3.2 percent. ...The advance Q4 GDP report, at 2.9% annualized, was above expectations, partly due to a positive impact from an increase in inventories.
The increase in real GDP reflected increases in private inventory investment, consumer spending, federal government spending, state and local government spending, and nonresidential fixed investment that were partly offset by decreases in residential fixed investment and exports. Imports, which are a subtraction in the calculation of GDP, decreased.
emphasis added
Personal consumption expenditures (PCE) increased at a 2.1% annualized rate in Q4.
The graph below shows the contribution to GDP from residential investment, equipment and software, and nonresidential structures (3 quarter trailing average). This is important to follow because residential investment tends to lead the economy, equipment and software is generally coincident, and nonresidential structure investment trails the economy.
In the graph, red is residential, green is equipment and software, and blue is investment in non-residential structures. So, the usual pattern - both into and out of recessions is - red, green, blue.
Of course - with the sudden economic stop due to COVID-19 - the usual pattern didn't apply.
The dashed gray line is the contribution from the change in private inventories.
 Click on graph for larger image.
Residential investment (RI) decreased at a 26.7% annual rate in Q4. Equipment investment decreased at a 3.7% annual rate, and investment in non-residential structures increased at a 0.4% annual rate.
The contribution to Q4 GDP from investment in private inventories was 1.46 percentage points.
On a 3-quarter trailing average basis, RI (red) is down, equipment (green) is up, and nonresidential structures (blue) is still down.
On a 3-quarter trailing average basis, RI (red) is down, equipment (green) is up, and nonresidential structures (blue) is still down.
I'll post more on the components of non-residential investment once the supplemental data is released.
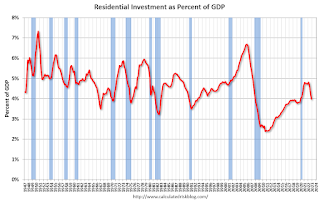 The second graph shows residential investment as a percent of GDP.
Residential Investment as a percent of GDP decreased in Q4.
I'll break down Residential Investment into components after the GDP details are released.
Note: Residential investment (RI) includes new single-family structures, multifamily structures, home improvement, broker's commissions, and a few minor categories.
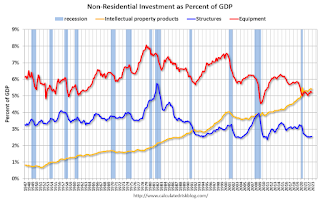 The third graph shows non-residential investment in
structures, equipment and "intellectual property products".
The third graph shows non-residential investment in
structures, equipment and "intellectual property products".
Investment in non-residential structures increased slightly in Q4 as a percent GDP.
New Home Sales at 616,000 Annual Rate in December; Previous 3 Months Revised Down Sharply
by Calculated Risk on 1/26/2023 10:47:00 AM
Today, in the Calculated Risk Real Estate Newsletter: New Home Sales at 616,000 Annual Rate in December; Previous 3 Months Revised Down Sharply
Brief excerpt:
The next graph shows the months of supply by stage of construction. “Months of supply” is inventory at each stage, divided by the sales rate.You can subscribe at https://calculatedrisk.substack.com/.
There are 1.4 months of completed supply (red line). This is close to the normal level.
The inventory of new homes under construction is at 5.7 months (blue line). This elevated level of homes under construction is due to supply chain constraints.
And about 1.9 months of potential inventory have not been started (grey line) - about double the normal level. Homebuilders are probably waiting to start some homes until they have a firmer grasp on prices and demand.
...
As previously discussed, the Census Bureau overestimates sales, and underestimates inventory when cancellation rates are rising, see: New Home Sales and Cancellations: Net vs Gross Sales. So, take the headline sales number with a large grain of salt - the actual negative impact on the homebuilders is far greater than the headline number suggests!
This will reverse when cancellation rates start declining. When a previously cancelled home is resold, the home builder counts it as a sale, but the Census Bureau does not (since it was already counted).
There are a large number of homes under construction, and this suggests we will see a further sharp increase in completed inventory over the next several months - and that will keep pressure on new home prices.

New Home Sales at 616,000 Annual Rate in December; Annual Sales down 16.4% in 2022
by Calculated Risk on 1/26/2023 10:09:00 AM
The Census Bureau reports New Home Sales in December were at a seasonally adjusted annual rate (SAAR) of 616 thousand.
The previous three months were revised down sharply.
Sales of new single‐family houses in December 2022 were at a seasonally adjusted annual rate of 616,000, according to estimates released jointly today by the U.S. Census Bureau and the Department of Housing and Urban Development. This is 2.3 percent above the revised November rate of 602,000, but is 26.6 percent below the December 2021 estimate of 839,000.
An estimated 644,000 new homes were sold in 2022. This is 16.4 percent below the 2021 figure of 771,000.
emphasis added
 Click on graph for larger image.
The first graph shows New Home Sales vs. recessions since 1963. The dashed line is the current sales rate.
New home sales are below pre-pandemic levels.
The second graph shows New Home Months of Supply.
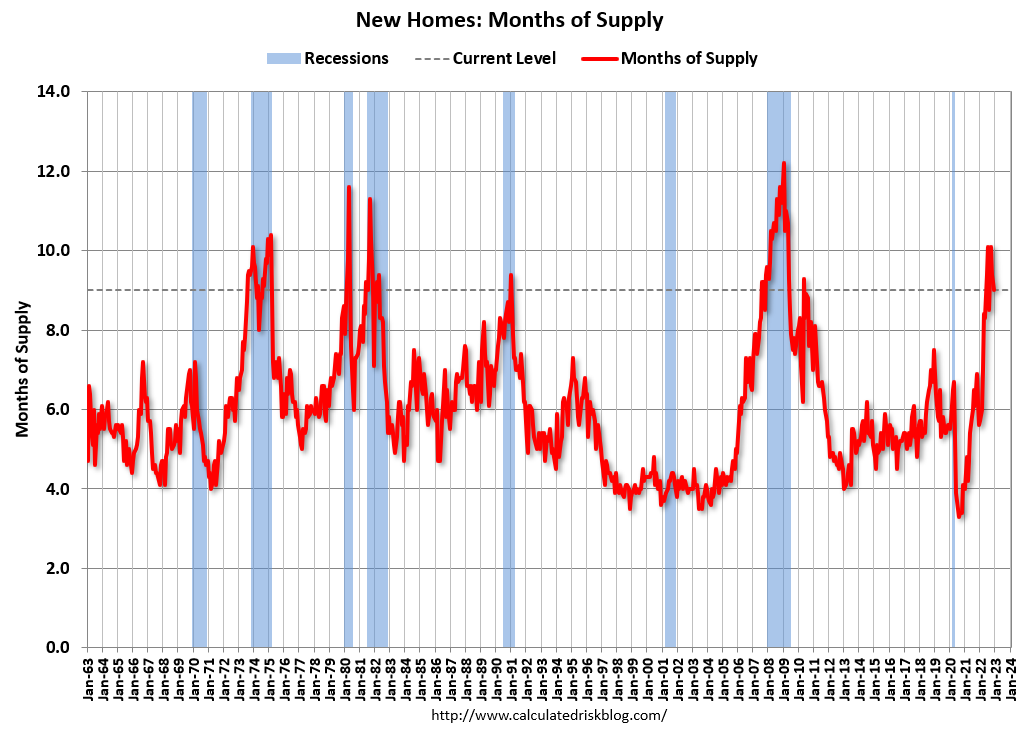 The months of supply decreased in December to 9.0 months from 9.2 months in November.
 The all-time record high was 12.1 months of supply in January 2009. The all-time record low was 3.5 months, most recently in October 2020.
This is well above the top of the normal range (about 4 to 6 months of supply is normal).
"The seasonally‐adjusted estimate of new houses for sale at the end of December was 461,000. This represents a supply of 9.0 months at the current sales rate."
 The last graph shows sales NSA (monthly sales, not seasonally adjusted annual rate).
In December 2022 (red column), 47 thousand new homes were sold (NSA). Last year, 61 thousand homes were sold in November.
The all-time high for December was 87 thousand in 2005, and the all-time low for December was 23 thousand in 2010.
This was at expectations of 614 thousand SAAR, however sales in the three previous months were revised down sharply. I'll have more later today.
Weekly Initial Unemployment Claims decrease to 186,000
by Calculated Risk on 1/26/2023 08:37:00 AM
The DOL reported:
In the week ending January 21, the advance figure for seasonally adjusted initial claims was 186,000, a decrease of 6,000 from the previous week's revised level. The previous week's level was revised up by 2,000 from 190,000 to 192,000. The 4-week moving average was 197,500, a decrease of 9,250 from the previous week's revised average. The previous week's average was revised up by 750 from 206,000 to 206,750.The following graph shows the 4-week moving average of weekly claims since 1971.
emphasis added
 Click on graph for larger image.
The dashed line on the graph is the current 4-week average. The four-week average of weekly unemployment claims decreased to 197,500.
The previous week was revised up.
Weekly claims were below the consensus forecast.
BEA: Real GDP increased at 2.9% Annualized Rate in Q4
by Calculated Risk on 1/26/2023 08:32:00 AM
From the BEA: Gross Domestic Product, Fourth Quarter 2022 (Advance Estimate)
Real gross domestic product (GDP) increased at an annual rate of 2.9 percent in the fourth quarter of 2022, according to the "advance" estimate released by the Bureau of Economic Analysis. In the third quarter, real GDP increased 3.2 percent. ...PCE increased at a 2.1% rate, and residential investment decreased at a 26.7% rate. The advance Q4 GDP report, with 2.9% annualized increase, was above expectations.
The increase in real GDP reflected increases in private inventory investment, consumer spending, federal government spending, state and local government spending, and nonresidential fixed investment that were partly offset by decreases in residential fixed investment and exports. Imports, which are a subtraction in the calculation of GDP, decreased.
The increase in private inventory investment was led by manufacturing (mainly petroleum and coal products as well as chemicals) as well as mining, utilities, and construction industries (led by utilities). The increase in consumer spending reflected increases in both services and goods. Within services, the increase was led by health care, housing and utilities, and "other" services (notably, personal care services). Within goods, the leading contributor was motor vehicles and parts. Within federal government spending, the increase was led by nondefense spending. The increase in state and local government spending primarily reflected an increase in compensation of state and local government employees. Within nonresidential fixed investment, an increase in intellectual property products was partly offset by a decrease in equipment.
Within residential fixed investment, the leading contributors to the decrease were new single-family construction as well as brokers' commissions. Within exports, a decrease in goods (led by nondurable goods excluding petroleum) was partly offset by an increase in services (led by travel as well as transport). Within imports, the decrease primarily reflected a decrease in goods (led by durable consumer goods).
Compared to the third quarter, the deceleration in real GDP in the fourth quarter primarily reflected a downturn in exports and decelerations in nonresidential fixed investment, state and local government spending, and consumer spending. These movements were partly offset by an upturn in private inventory investment, an acceleration in federal government spending, and a smaller decrease in residential fixed investment. Imports decreased less in the fourth quarter than in the third quarter.
emphasis added
I'll have more later ...
Wednesday, January 25, 2023
Thursday: GDP, New Home Sales, Durable Goods, Unemployment Claims
by Calculated Risk on 1/25/2023 09:00:00 PM
 Note: Mortgage rates are from MortgageNewsDaily.com and are for top tier scenarios.
Thursday:
• At 8:30 AM ET, Gross Domestic Product, 4th quarter and Year 2022 (Advance estimate). The consensus is that real GDP increased 2.6% annualized in Q4.
• Also at 8:30 AM, The initial weekly unemployment claims report will be released. The consensus is for 205 thousand initial claims, up from 190 thousand last week.
• Also at 8:30 AM, Durable Goods Orders for December. The consensus is for a 2.6% increase in durable goods.
• Also at 8:30 AM, Chicago Fed National Activity Index for December. This is a composite index of other data.
• At 10:00 AM, New Home Sales for December from the Census Bureau. The consensus is for 614 thousand SAAR, down from 640 thousand in November.
• At 11:00 AM, the Kansas City Fed manufacturing survey for January.
Freddie Mac: Mortgage Serious Delinquency Rate unchanged in December
by Calculated Risk on 1/25/2023 04:52:00 PM
Freddie Mac reported that the Single-Family serious delinquency rate in December was 0.66%, unchanged from 0.66% November. Freddie's rate is down year-over-year from 1.12% in December 2021.
Freddie's serious delinquency rate peaked in February 2010 at 4.20% following the housing bubble and peaked at 3.17% in August 2020 during the pandemic.
These are mortgage loans that are "three monthly payments or more past due or in foreclosure".
 Click on graph for larger image
Mortgages in forbearance are being counted as delinquent in this monthly report but are not reported to the credit bureaus.
The serious delinquency rate was at 0.60% just prior to the pandemic; this is almost back to that level.
Note that multi-family delinquencies have been increasing and were at 0.12% in December, up from 0.08% in December 2021.
Vehicle Sales Forecast: Vehicle Sales to Increase in January
by Calculated Risk on 1/25/2023 02:48:00 PM
From WardsAuto: U.S. Light-Vehicle Sales to Rise 5th Straight Month in January; Q1 Forecast for 4% Gain (pay content). Brief excerpt:
The bottom line is raw volume is growing, albeit slowly, with a forecast year-over-year gain in January, as well as the entire first quarter. Because of the chaos of the past three years, January’s upward spike to a 15.6 million-unit seasonally adjusted annual rate from December’s 13.4 million is more a result of disruption to typical year-end seasonal trends than a sudden surge in demand.
emphasis added
 Click on graph for larger image.
This graph shows actual sales from the BEA (Blue), and Wards forecast for January (Red).
The Wards forecast of 15.6 million SAAR, would be up 17% from last month, and up 3% from a year ago.
Vehicle sales are usually a transmission mechanism for Federal Open Market Committee (FOMC) policy, far behind housing. This time vehicle sales have been more suppressed by supply chain issues, but sales are probably now also being impacted by higher interest rates.


