 RSS Feed
 by Calculated Risk on 2/06/2023 01:12:00 PM
Monday, February 06, 2023
Heavy Truck Sales Up 6% Year-over-year
The BEA released their estimate of vehicle sales for January last week.
This graph shows heavy truck sales since 1967 using data from the BEA. The dashed line is the January 2023 seasonally adjusted annual sales rate (SAAR).
Heavy truck sales really collapsed during the great recession, falling to a low of 180 thousand SAAR in May 2009. Then heavy truck sales increased to a new all-time high of 570 thousand SAAR in April 2019.
 Click on graph for larger image.
Note: "Heavy trucks - trucks more than 14,000 pounds gross vehicle weight."
Heavy truck sales declined sharply at the beginning of the pandemic, falling to a low of 308 thousand SAAR in May 2020.
Heavy truck sales were at 466 thousand SAAR in January, down from 501 thousand in December, and up 6.4% from 438 thousand SAAR in January 2022.
Usually, heavy truck sales decline sharply prior to a recession. Sales were solid in January.
Black Knight Mortgage Monitor: Home Prices Declined in December; Down 5.3% since June
by Calculated Risk on 2/06/2023 09:39:00 AM
Today, in the Calculated Risk Real Estate Newsletter: Black Knight Mortgage Monitor: Home Prices Declined in December; Down 5.3% since June
A brief excerpt:
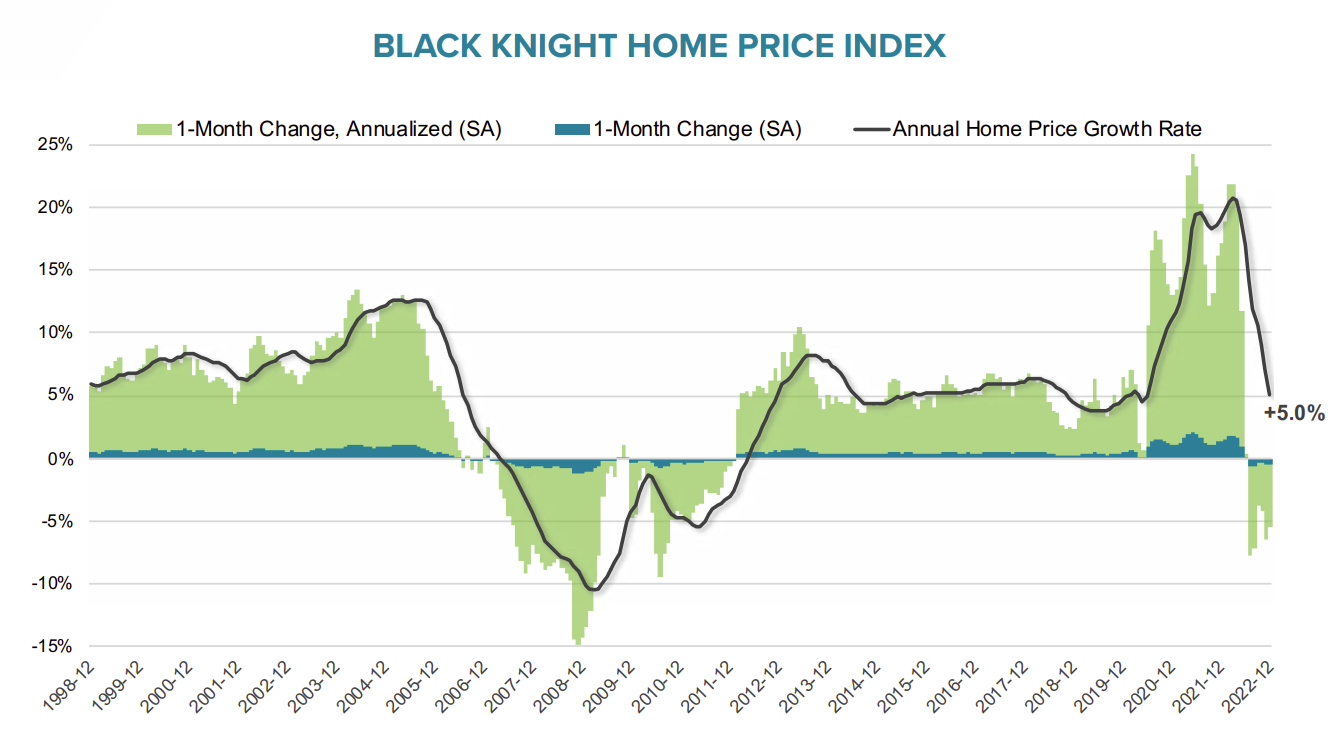
Here is a graph of the Black Knight HPI. The index is still up 5.0% year-over-year but declined for the sixth straight month in December and is now 5.3% off the peak in June.There is much more in the article. You can subscribe at https://calculatedrisk.substack.com/
• December’s 0.45% seasonally adjusted decline was roughly on par with the 0.48% average seen over the past 6 months, with an even sharper 0.89% decline on an unadjusted basis
• Nationally, home prices are now 5.3% off their summer peak (2.9% when accounting for typical seasonal patterns)
• December’s decline pushed the annual home price growth rate down to 5.0% -- now only 0.4% above its 30-year average – and the slowest home price growth rate since June 2020 in the early stages of the pandemic
• If the current rate of monthly declines persists, we would see the annual home price growth rate go negative within the next three months
Housing February 6th Weekly Update: Inventory Decreased 1.9% Week-over-week
by Calculated Risk on 2/06/2023 08:11:00 AM
Altos reports inventory was down 1.9% week-over-week. Usually inventory bottoms in early February; however, in 2022, inventory bottomed in early March.
Here are the same week inventory changes for the last five years:
2023: -8.7K
2022: -16.0K
2021: -13.4K
2020: -4.3K
2019: -10.9K
 Click on graph for larger image.
This inventory graph is courtesy of Altos Research.
As of February 3rd, inventory was at 457 thousand (7-day average), compared to 466 thousand the prior week.

The red line is for 2023. The black line is for 2019. Note that inventory is up from the previous two years (the record low was in 2022), but still well below normal levels.
Inventory was up 78.8% compared to the same week in 2022 (last week it was up 71.5%), and down 44.0% compared to the same week in 2019 (last week down 43.7%).
A key will be when inventory starts increasing in 2023 - so far inventory has declined about 6.9% over the first five weeks of 2023.
Mike Simonsen discusses this data regularly on Youtube.
Sunday, February 05, 2023
Sunday Night Futures
by Calculated Risk on 2/05/2023 06:15:00 PM
Weekend:
• Schedule for Week of February 5, 2023
Monday:
• No major economic releases scheduled.
From CNBC: Pre-Market Data and Bloomberg futures S&P 500 futures are down 13 and DOW futures are down 81 (fair value).
Oil prices were down over the last week with WTI futures at $73.39 per barrel and Brent at $79.94 per barrel. A year ago, WTI was at $92, and Brent was at $97 - so WTI oil prices are DOWN 20% year-over-year.
Here is a graph from Gasbuddy.com for nationwide gasoline prices. Nationally prices are at $3.43 per gallon. A year ago, prices were at $3.28 per gallon, so gasoline prices are up $0.15 per gallon year-over-year.
Hotels: Occupancy Rate Down 0.3% Compared to Same Week in 2019
by Calculated Risk on 2/05/2023 10:02:00 AM
U.S. hotel performance increased from the previous week, according to STR‘s latest data through Jan. 28.The following graph shows the seasonal pattern for the hotel occupancy rate using the four-week average.
Jan. 22-28, 2023 (percentage change from comparable week in 2019*):
• Occupancy: 56.3% (-0.3%)
• Average daily rate (ADR): $142.66 (+13.4%)
• Revenue per available room (RevPAR): $80.32 (+13.0%)
*Due to the pandemic impact, STR is measuring recovery against comparable time periods from 2019. Year-over-year comparisons will once again become standard after the first quarter.
emphasis added
 Click on graph for larger image.
The red line is for 2023, black is 2020, blue is the median, and dashed light blue is for 2022. Dashed purple is 2019 (STR is comparing to a strong year for hotels).
The 4-week average of the occupancy rate is at the median rate for the previous 20 years (Blue).
Note: Y-axis doesn't start at zero to better show the seasonal change.
The 4-week average of the occupancy rate will increase seasonally over the next few months.
Saturday, February 04, 2023
Real Estate Newsletter Articles this Week: Case-Shiller: National House Price Index "Continued to Decline"
by Calculated Risk on 2/04/2023 02:11:00 PM
At the Calculated Risk Real Estate Newsletter this week:
• Case-Shiller: National House Price Index "Continued to Decline" to 7.7% year-over-year increase in November
• Rents Continue to Decline; "Apartment Market Loosens"
• Inflation Adjusted House Prices 3.6% Below Peak
• Lawler: Net Home Orders and Sales Cancellations of Large Publicly-Traded Home Builders
• Lawler: D.R. Horton (DHI) Net Order Price Declined "Roughly" 10% from Peak
This is usually published 4 to 6 times a week and provides more in-depth analysis of the housing market.
You can subscribe at https://calculatedrisk.substack.com/
Most content is available for free (and no Ads), but please subscribe!
Schedule for Week of February 5, 2023
by Calculated Risk on 2/04/2023 08:11:00 AM
This will be light week for economic data.
The key report this week is the December trade deficit.
----- Monday, February 6th -----
No major economic releases scheduled.
----- Tuesday, February 7th -----
8:00 AM ET: Corelogic House Price index for December.
 8:30 AM: Trade Balance report for December from the Census Bureau.
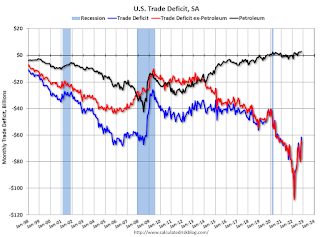
This graph shows the U.S. trade deficit, with and without petroleum, through the most recent report. The blue line is the total deficit, and the black line is the petroleum deficit, and the red line is the trade deficit ex-petroleum products.
The consensus is the trade deficit to be $68.5 billion. The U.S. trade deficit was at $61.5 billion in November.
12:40 PM, Discussion Fed Chair Jerome Powell, Conversation with David Rubenstein, Chairman of the Economic Club of Washington, D.C. at the Economic Club of Washington, D.C.
----- Wednesday, February 8th -----
7:00 AM ET: The Mortgage Bankers Association (MBA) will release the results for the mortgage purchase applications index.
----- Thursday, February 9th -----
8:30 AM: The initial weekly unemployment claims report will be released. The consensus is for 194 thousand initial claims, up from 183 thousand last week.
----- Friday, February 10th -----
10:00 AM: University of Michigan's Consumer sentiment index (Preliminary for February). The consensus is for a reading of 67.0.
No major economic releases scheduled.
8:00 AM ET: Corelogic House Price index for December.
 8:30 AM: Trade Balance report for December from the Census Bureau.
 This graph shows the U.S. trade deficit, with and without petroleum, through the most recent report. The blue line is the total deficit, and the black line is the petroleum deficit, and the red line is the trade deficit ex-petroleum products.
The consensus is the trade deficit to be $68.5 billion. The U.S. trade deficit was at $61.5 billion in November.
12:40 PM, Discussion Fed Chair Jerome Powell, Conversation with David Rubenstein, Chairman of the Economic Club of Washington, D.C. at the Economic Club of Washington, D.C.
7:00 AM ET: The Mortgage Bankers Association (MBA) will release the results for the mortgage purchase applications index.
8:30 AM: The initial weekly unemployment claims report will be released. The consensus is for 194 thousand initial claims, up from 183 thousand last week.
10:00 AM: University of Michigan's Consumer sentiment index (Preliminary for February). The consensus is for a reading of 67.0.
Friday, February 03, 2023
COVID Feb 3, 2023: Update on Cases, Hospitalizations and Deaths
by Calculated Risk on 2/03/2023 09:24:00 PM
 Note: Mortgage rates are from MortgageNewsDaily.com and are for top tier scenarios.
On COVID (focus on hospitalizations and deaths). Data is now weekly.
| COVID Metrics | ||||
|---|---|---|---|---|
| Now | Week Ago | Goal | ||
| New Cases per Week2 | 280,911 | 301,243 | ≤35,0001 | |
| Hospitalized2 | 25,603 | 29,306 | ≤3,0001 | |
| Deaths per Week2 | 3,452 | 3,792 | ≤3501 | |
| 1my goals to stop weekly posts, 2Weekly for Cases, Currently Hospitalized, and Deaths 🚩 Increasing number weekly for Cases, Hospitalized, and Deaths ✅ Goal met. | ||||
 Click on graph for larger image.
This graph shows the weekly (columns) number of deaths reported.
January was the worst month for the previous two years, and January 2023 saw a much smaller increase in deaths.
AAR: January Rail Carloads Increased and Intermodal Decreased Year-over-year
by Calculated Risk on 2/03/2023 04:17:00 PM
From the Association of American Railroads (AAR) Rail Time Indicators. Graphs and excerpts reprinted with permission.
U.S. rail traffic started January 2023 with both discouraging and encouraging aspects.
On the encouraging side, total U.S. carloads rose 2.2% in January 2023. January 2022 was the worst January for total carloads in our records that begin in 1988. Still, growth is better than a decline.
...
On the discouraging side, January 2023 was the worst January for intermodal since 2013, with originations down 8.1% from last year. In recent months, major retailers have cut inventories; consumer spending — especially on goods — has contracted; and truck rates have fallen.
emphasis added
 Click on graph for larger image.
This graph from the Rail Time Indicators report shows the six-week average of U.S. Carloads in 2021, 2022 and 2022:
The good news is total U.S. carloads were up 2.2%, or 19,827 carloads, in January 2023 over January 2022. The bad news is January 2022 was the worst January for total carloads in our records that go back to 1988, so a 2.2% increase — while certainly better than some alternatives — is less impressive than it could be.
 The second graph shows the six-week average (not monthly) of U.S. intermodal in 2021, 2022 and 2023: (using intermodal or shipping containers):
U.S. railroads also originated 919,928 intermodal containers and trailers in January 2023, down 8.1%, or 81,443 units, from January 2022. Intermodal volume averaged 229,982 units per week in January 2023, the fewest for January since 2013. January 2023 was the first time since March 2017 that the number of originated carloads exceeded the number of originated intermodal units on U.S. railroads.
Lawler: Net Home Orders and Sales Cancellations of Large Publicly-Traded Home Builders
by Calculated Risk on 2/03/2023 01:04:00 PM
Today, in the Calculated Risk Real Estate Newsletter: Lawler: Net Home Orders and Sales Cancellations of Large Publicly-Traded Home Builders
A brief excerpt:
Note from Bill McBride: The data below via Tom Lawler illustrates the point I’ve made about the Census Bureau overstating sales when cancellation rates are rising.There is much more in the article. You can subscribe at https://calculatedrisk.substack.com/
...
From housing economist Tom Lawler:
Below is a table of net home orders (gross orders less sales cancellations) of selected publicly-traded home builders for last quarter compared to the comparable quarter of 2021. (Note: sales cancellations from some builders are derived from reported cancellation rates, and may be off due to rounding). Also shown are gross orders, as well as unadjusted new home sales reported by Census.
As the table shows, net orders of these builders last quarter were down 41.3% YOY, sales cancellations were up 58.7%, and gross orders were down 27.5%. Census preliminary estimates of new home sales last quarter, in contrast, were down 19.3% YOY.


