by Calculated Risk on 2/08/2023 07:00:00 AM
Wednesday, February 08, 2023
MBA: Mortgage Applications Increased in Latest Weekly Survey
From the MBA: Mortgage Applications Increase in Latest MBA Weekly Survey
Mortgage applications increased 7.4 percent from one week earlier, according to data from the Mortgage Bankers Association’s (MBA) Weekly Mortgage Applications Survey for the week ending February 3, 2023.
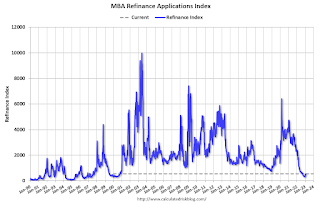
... The Refinance Index increased 18 percent from the previous week and was 75 percent lower than the same week one year ago. The seasonally adjusted Purchase Index increased 3 percent from one week earlier. The unadjusted Purchase Index increased 4 percent compared with the previous week and was 37 percent lower than the same week one year ago.
“Applications rose last week as the 30-year fixed mortgage rate inched lower to 6.18 percent, its fifth consecutive weekly decline. The 30-year fixed rate is almost a percentage point below its recent high of 7.16 percent in October 2022,” said Joel Kan, MBA’s Vice President and Deputy Chief Economist. “Both purchase and refinance applications increased last week and have shown gains in three of the past four weeks because of lower rates. Overall applications remained 58 percent lower than a year ago and rates are still significantly higher, however, this week’s results are a step in the right direction. Purchase activity that was put on hold last year due to the quick runup in rates is gradually coming back as rates ease and housing demand remains strong, driven by supportive demographics and the ongoing strength in the job market.”
Added Kan, “The average loan size on a purchase application increased to $428,500 – the largest average since May 2022. This increase is a sign that the recent upward trend in purchase activity remains skewed toward larger loan sizes and less first-time homebuyer activity, as entry level housing remains undersupplied, and buyers struggle with affordability in many markets.”
...
The average contract interest rate for 30-year fixed-rate mortgages with conforming loan balances ($726,200 or less) decreased to 6.18 percent from 6.19 percent, with points decreasing to 0.64 from 0.65 (including the origination fee) for 80 percent loan-to-value ratio (LTV) loans.
emphasis added
 Click on graph for larger image.
The first graph shows the refinance index since 1990.
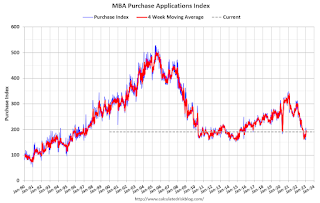 According to the MBA, purchase activity is down 37% year-over-year unadjusted. This has increased a little with lower rates, but is still near housing bust levels.
Tuesday, February 07, 2023
Leading Index for Commercial Real Estate Decreases in January
by Calculated Risk on 2/07/2023 07:48:00 PM
From Dodge Data Analytics: Dodge Momentum Index Dips in January
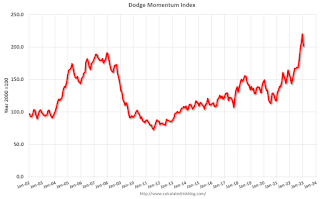
The Dodge Momentum Index (DMI), issued by Dodge Construction Network, fell 8.4% in January to 201.5 (2000=100) from the revised December reading of 220.0. In January, the commercial component of the DMI fell 10.0%, and the institutional component receded 4.7%.
“The Dodge Momentum Index weakened in January, after 10 consecutive months of gains. While planning activity slowed, the Index remains elevated, and the volume of projects remains steady,” stated Sarah Martin, associate director of forecasting for Dodge Construction Network. “After such strong growth in 2022, we expect the Index to work its way back towards historical norms this year, in tandem with weaker economic growth. Overall, levels of planning activity remained comparatively strong over the month — which bodes well for the construction sector.”
Weakness in commercial planning in January was broad-based, with office, warehouse, retail and hotel activity declining. Slower activity in education and amusement projects drove down the institutional portion of the Index, nullifying the impact of gains in healthcare and public planning over the month. On a year-over-year basis, the DMI remains 32% higher than in January 2022. The commercial component was up 40%, and the institutional component was 16% higher.
...
The DMI is a monthly measure of the initial report for nonresidential building projects in planning, shown to lead construction spending for nonresidential buildings by a full year.
emphasis added
 Click on graph for larger image.
This graph shows the Dodge Momentum Index since 2002. The index was at 201.5 in January, down from 220.0 in December.
According to Dodge, this index leads "construction spending for nonresidential buildings by a full year". This index suggests a solid pickup in commercial real estate construction into 2023.
Freddie Mac House Price Index Declines for 7th Consecutive Month in December
by Calculated Risk on 2/07/2023 11:20:00 AM
Today, in the Calculated Risk Real Estate Newsletter: Freddie Mac House Price Index Declines for 7th Consecutive Month in December
A brief excerpt:
Freddie Mac recently reported that its “National” Home Price Index (FMHPI) declined for the seventh consecutive month on a seasonally adjusted basis in December, putting the National FNHPI down 2.5% from its May 2022 peak, and down 5.0% Not Seasonally Adjusted (NSA) from the peak.There is much more in the article. You can subscribe at https://calculatedrisk.substack.com/
On a year-over-year basis, the National FMHPI was up 4.1% in December, down from 6.0% YoY in November. The YoY increase peaked at 19.3% in July 2021.
In December, 36 states and D.C. were below their 2022 peaks in December, Seasonally Adjusted. The largest seasonally adjusted declines from the recent peak were in Arizona (-8.5%), Idaho (-7.2%), Nevada (-6.8%), Washington (-6.7%), California (-6.3%), Utah (-5.4%), and Colorado (-5.2%).
...
Based on the recent trend, this index will be negative year-over-year in March.
Wholesale Used Car Prices Increased in January, Down 12.8% Year-over-year
by Calculated Risk on 2/07/2023 09:37:00 AM
From Manheim Consulting today: Wholesale Used-Vehicle Prices Increase in January
Wholesale used-vehicle prices (on a mix, mileage, and seasonally adjusted basis) increased 2.5% in January compared to December. The Manheim Used Vehicle Value Index (MUVVI) rose to 224.8, down 12.8% from a year ago. January’s increase was driven in part by the seasonal adjustment. The non-adjusted price change in January was an increase of 1.5% compared to December, moving the unadjusted average price down 11.0% year over year.
emphasis added
 Click on graph for larger image.
This index from Manheim Consulting is based on all completed sales transactions at Manheim’s U.S. auctions.
Trade Deficit increased to $67.4 Billion in December
by Calculated Risk on 2/07/2023 08:40:00 AM
From the Department of Commerce reported:
The U.S. Census Bureau and the U.S. Bureau of Economic Analysis announced today that the goods and services deficit was $67.4 billion in December, up $6.4 billion from $61.0 billion in November, revised.
December exports were $250.2 billion, $2.2 billion less than November exports. December imports were $317.6 billion, $4.2 billion more than November imports.
emphasis added
 Click on graph for larger image.
Exports decreased and imports increased in December.
Exports are up 8% year-over-year; imports are up 2% year-over-year.
Both imports and exports decreased sharply due to COVID-19 and then bounced back. Both have decreased recently.
The second graph shows the U.S. trade deficit, with and without petroleum.
 The blue line is the total deficit, and the black line is the petroleum deficit, and the red line is the trade deficit ex-petroleum products.
Note that net, exports of petroleum products are positive.
The trade deficit with China decreased to $23.5 billion in December, from $36.2 billion a year ago.
CoreLogic: House Prices up 6.9% YoY in December; Declined 0.4% MoM in December NSA
by Calculated Risk on 2/07/2023 08:00:00 AM
Notes: This CoreLogic House Price Index report is for December. The recent Case-Shiller index release was for November. The CoreLogic HPI is a three-month weighted average and is not seasonally adjusted (NSA).
From CoreLogic: Peak Fall Mortgage Rates Further Cooled Home Price Growth in December, CoreLogic Reports
CoreLogic® ... today released the CoreLogic Home Price Index (HPI™) and HPI Forecast™ for December 2022.
The effect of rising mortgage rates on housing demand in 2022 became even more evident in December, with annual home price growth dipping to 6.9%, down from a series high of 20% appreciation in April. Only nine states registered double-digit year-over-year price increases in December, compared with 48 that posted double-digit gains in April.
...
“The continued slowing of home prices at the end of 2022 reflects weaker housing market demand, primarily caused by higher mortgage rates and a more pessimistic economic outlook in general,” said Selma Hepp, chief economist at CoreLogic. “But while prices continued to fall from November, the rate of decline was lower than that seen in the summer and still adds up to only a 3% cumulative drop in prices since last spring’s peak.”
“Some exurban regions that became increasingly popular during the COVID-19 pandemic saw prices jump and affordability erode at the time, but these areas are now seeing major corrections,” Hepp continued. “And while price deceleration will likely persist into the spring of 2023, when the market will probably see some year-over-year declines, the recent decrease in mortgage rates has stimulated buyer demand and could result in a more optimistic homebuying season than many expected.”
...
U.S. home prices (including distressed sales) increased by 6.9% year over year in December 2022 compared to December 2021. On a month-over-month basis, home prices declined by 0.4% compared to November 2022.
emphasis added
Monday, February 06, 2023
Tuesday: Trade Deficit, Fed Chair Powell
by Calculated Risk on 2/06/2023 09:00:00 PM
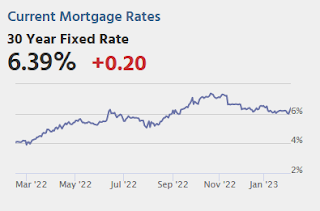
Mortgage rates were already under quite a bit of pressure on Friday following the stunningly strong jobs report in the morning. Strong economic data is generally bad for rates. One reason for that is the data's impact on decisions made by the Federal Reserve. This is especially true of the jobs report. ...Tuesday:
In the space of just two days, the average lender is nearly half a percent higher on a top tier conventional 30yr scenario. [30 year fixed 6.39%]
emphasis added
• At 8:00 AM ET, CoreLogic House Price index for December.
• At 8:30 AM, Trade Balance report for December from the Census Bureau. The consensus is the trade deficit to be $68.5 billion. The U.S. trade deficit was at $61.5 billion in November.
• At 12:40 PM, Discussion Fed Chair Jerome Powell, Conversation with David Rubenstein, Chairman of the Economic Club of Washington, D.C. at the Economic Club of Washington, D.C.
Fed Survey: Banks reported Tighter Standards, Weaker Demand for Residential Real Estate and HELOCs
by Calculated Risk on 2/06/2023 07:10:00 PM
From the Federal Reserve: The January 2023 Senior Loan Officer Opinion Survey on Bank Lending Practices
The January 2023 Senior Loan Officer Opinion Survey (SLOOS) on Bank Lending Practices addressed changes in the standards and terms on, and demand for, bank loans to businesses and households over the past three months, which generally correspond to the fourth quarter of 2022.
Regarding loans to businesses, survey respondents on balance reported tighter standards and weaker demand for commercial and industrial (C&I) loans to large, middle-market, and small firms over the fourth quarter.2 Meanwhile, banks reported tighter standards and weaker demand for all commercial real estate (CRE) loan categories.
For loans to households, banks reported that lending standards tightened or remained basically unchanged across all categories of residential real estate (RRE) loans and demand for these loans weakened. In addition, banks reported tighter standards and weaker demand for home equity lines of credit (HELOCs). Standards tightened and demand weakened, on balance, for credit card, auto, and other consumer loans.
emphasis added
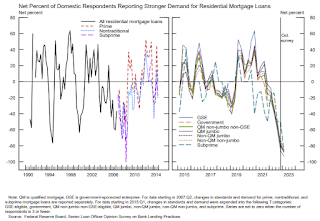 Click on graph for larger image.
This graph on Residential Real Estate demand is from the Senior Loan Officer Survey Charts.
This shows that demand has declined sharply.
Heavy Truck Sales Up 6% Year-over-year
by Calculated Risk on 2/06/2023 01:12:00 PM
This graph shows heavy truck sales since 1967 using data from the BEA. The dashed line is the January 2023 seasonally adjusted annual sales rate (SAAR).
Heavy truck sales really collapsed during the great recession, falling to a low of 180 thousand SAAR in May 2009. Then heavy truck sales increased to a new all-time high of 570 thousand SAAR in April 2019.
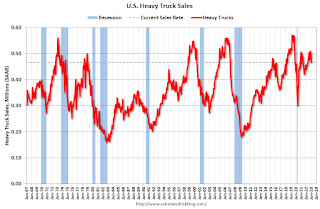 Click on graph for larger image.
Note: "Heavy trucks - trucks more than 14,000 pounds gross vehicle weight."
Heavy truck sales declined sharply at the beginning of the pandemic, falling to a low of 308 thousand SAAR in May 2020.
Black Knight Mortgage Monitor: Home Prices Declined in December; Down 5.3% since June
by Calculated Risk on 2/06/2023 09:39:00 AM
Today, in the Calculated Risk Real Estate Newsletter: Black Knight Mortgage Monitor: Home Prices Declined in December; Down 5.3% since June
A brief excerpt:
Here is a graph of the Black Knight HPI. The index is still up 5.0% year-over-year but declined for the sixth straight month in December and is now 5.3% off the peak in June.There is much more in the article. You can subscribe at https://calculatedrisk.substack.com/
• December’s 0.45% seasonally adjusted decline was roughly on par with the 0.48% average seen over the past 6 months, with an even sharper 0.89% decline on an unadjusted basis
• Nationally, home prices are now 5.3% off their summer peak (2.9% when accounting for typical seasonal patterns)
• December’s decline pushed the annual home price growth rate down to 5.0% -- now only 0.4% above its 30-year average – and the slowest home price growth rate since June 2020 in the early stages of the pandemic
• If the current rate of monthly declines persists, we would see the annual home price growth rate go negative within the next three months


