by Calculated Risk on 2/09/2023 03:56:00 PM
Thursday, February 09, 2023
Realtor.com Reports Weekly Active Inventory Up 70% YoY; New Listings Down 11% YoY
Realtor.com has monthly and weekly data on the existing home market. Here is their weekly report released today from Chief Economist Danielle Hale: Weekly Housing Trends View — Data Week Ending Feb 4, 2023
• Active inventory growth continued to climb with for-sale homes up 70% above one year ago. Inventories of for-sale homes rose again, but climbed at a slightly slower yearly pace than last week.
...
• New listings–a measure of sellers putting homes up for sale–were again down, this week by 11% from one year ago. For 31 weeks now, fewer homeowners put their homes on the market for sale than at this time last year. After smaller declines in the first few weeks of the year, the gap has widened for a second week. High costs and mortgage rates can significantly up the ante for homeowners hoping to trade-up and remain in their current area.
 Here is a graph of the year-over-year change in inventory according to realtor.com. NOTE: The release says active inventory is up 70% YoY, but the data shows up 79% (graph based on data).
In early 2022, inventory was declining rapidly, so the year-over-year change is up sharply.
Energy expenditures as a percentage of PCE
by Calculated Risk on 2/09/2023 02:11:00 PM
During the early stages of the pandemic, energy expenditures as a percentage of PCE hit an all-time low of 3.3% of PCE. Then energy expenditures increased to 2018 levels by the end of 2021.
This graph shows expenditures on energy goods and services as a percent of total personal consumption expenditures. This is one of the measures that Professor Hamilton at Econbrowser looks at to evaluate any drag on GDP from energy prices.

Click on graph for larger image.
Data source: BEA.
In general, energy expenditures as a percent of PCE has been trending down for decades. The huge spikes in energy prices during the oil crisis of 1973 and 1979 are obvious. As is the increase in energy prices during the 2001 through 2008 period.
Hotels: Occupancy Rate Down 7.3% Compared to Same Week in 2019
by Calculated Risk on 2/09/2023 11:29:00 AM
U.S. hotel performance fell slightly from the previous week, according to STR‘s latest data through Feb. 4.The following graph shows the seasonal pattern for the hotel occupancy rate using the four-week average.
Jan. 29 to Feb. 4, 2023 (percentage change from comparable week in 2019*):
• Occupancy: 55.3% (-7.3%)
• Average daily rate (ADR): $145.35 (+13.9%)
• Revenue per available room (RevPAR): $80.45 (+5.6%)
*Due to the pandemic impact, STR is measuring recovery against comparable time periods from 2019. Year-over-year comparisons will once again become standard after Q1.
emphasis added
 Click on graph for larger image.
The red line is for 2023, black is 2020, blue is the median, and dashed light blue is for 2022. Dashed purple is 2019 (STR is comparing to a strong year for hotels).
Weekly Initial Unemployment Claims increase to 196,000
by Calculated Risk on 2/09/2023 08:33:00 AM
The DOL reported:
In the week ending February 4, the advance figure for seasonally adjusted initial claims was 196,000, an increase of 13,000 from the previous week's unrevised level of 183,000. The 4-week moving average was 189,250, a decrease of 2,500 from the previous week's unrevised average of 191,750.The following graph shows the 4-week moving average of weekly claims since 1971.
emphasis added
 Click on graph for larger image.
The dashed line on the graph is the current 4-week average. The four-week average of weekly unemployment claims decreased to 189,250.
The previous week was unrevised.
Weekly claims were close to the consensus forecast.
Wednesday, February 08, 2023
Thursday: Unemployment Claims
by Calculated Risk on 2/08/2023 08:12:00 PM

Thursday:
• At 8:30 AM: The initial weekly unemployment claims report will be released. The consensus is for 194 thousand initial claims, up from 183 thousand last week.
U.S. Courts: Bankruptcy Filings Decline 6 Percent in 2022
by Calculated Risk on 2/08/2023 04:25:00 PM
From the U.S. Courts: Bankruptcy Filings Drop 6.3 Percent
Bankruptcy filings fell 6.3 percent for the 12-month period ending Dec. 31, 2022, continuing a fall that coincided with the start of the COVID-19 pandemic. But individual filings under Chapter 13 increased significantly.
Annual bankruptcy filings in calendar year 2022 totaled 387,721, compared with 413,616 cases in 2021, according to statistics released by the Administrative Office of the U.S. Courts.
Business filings fell 6 percent, from 14,347 to 13,481 in the year ending Dec. 31, 2022. Non-business bankruptcy filings fell 6.3 percent, to 374,240, compared with 399,269 in the previous year.
 Click on graph for larger image.
This graph shows the business and non-business bankruptcy filings by calendar year since 1997.
The sharp decline in 2006 was due to the so-called "Bankruptcy Abuse Prevention and Consumer Protection Act of 2005". (a good example of Orwellian named legislation since this was more a "Lender Protection Act").
Second Home Market: South Lake Tahoe in January
by Calculated Risk on 2/08/2023 01:39:00 PM
With the pandemic, there was a surge in 2nd home buying.
I'm looking at data for some second home markets - and I'm tracking those markets to see if there is an impact from lending changes, rising mortgage rates or the easing of the pandemic.
This graph is for South Lake Tahoe since 2004 through January 2023, and shows inventory (blue), and the year-over-year (YoY) change in the median price (12-month average).
Note: The median price is a 12-month average, and is distorted by the mix, but this is the available data.

Following the housing bubble, prices declined for several years in South Lake Tahoe, with the median price falling about 50% from the bubble peak.
Currently inventory is still very low, but still up over 50% from the record low set in February 2022, and up 24% year-over-year. Prices are up 1.1% YoY (and the YoY change has been trending down).
1st Look at Local Housing Markets in January
by Calculated Risk on 2/08/2023 09:36:00 AM
Today, in the Calculated Risk Real Estate Newsletter:
1st Look at Local Housing Markets in January
A brief excerpt:
This is the first look at local markets in January. I’m tracking about 40 local housing markets in the US. Some of the 40 markets are states, and some are metropolitan areas. I’ll update these tables throughout the month as additional data is released.There is much more in the article. You can subscribe at https://calculatedrisk.substack.com/
Closed sales in January were mostly for contracts signed in November and December. Since 30-year fixed mortgage rates were over 6% for all of November and December closed sales were down significantly year-over-year in January, however, the impact was probably not as severe as for closed sales in December (rates were the highest in October and November 2022 when contracts were signed for closing in December)..
...
Median sales prices for single family homes were down 2.3% year-over year (YoY) in Las Vegas, and down 3.5% YoY in San Diego and up 0.4% YoY in the Northwest (Seattle).
...
In January, sales were down 35.9%. In December, these same markets were down 42.1% YoY Not Seasonally Adjusted (NSA).
This is a smaller YoY decline than in December for these early reporting markets. The early data suggests NAR reported sales will rebound in January to the mid-4 million range (Seasonally adjusted annual rate) from 4.02 million SAAR in December.
This will still be a significant YoY decline, and the 17th consecutive month with a YoY decline.
Note: Even if existing home sales activity bottomed in December, there are usually two bottoms for housing - the first for activity and the second for prices. See Has Housing "Bottomed"?
Many more local markets to come!
MBA: Mortgage Applications Increased in Latest Weekly Survey
by Calculated Risk on 2/08/2023 07:00:00 AM
From the MBA: Mortgage Applications Increase in Latest MBA Weekly Survey
Mortgage applications increased 7.4 percent from one week earlier, according to data from the Mortgage Bankers Association’s (MBA) Weekly Mortgage Applications Survey for the week ending February 3, 2023.
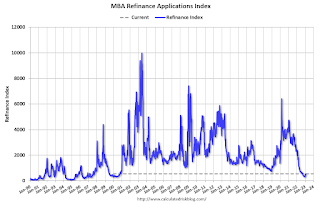
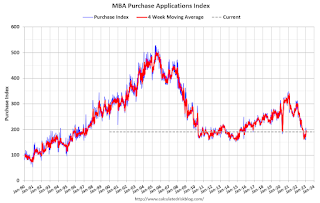
... The Refinance Index increased 18 percent from the previous week and was 75 percent lower than the same week one year ago. The seasonally adjusted Purchase Index increased 3 percent from one week earlier. The unadjusted Purchase Index increased 4 percent compared with the previous week and was 37 percent lower than the same week one year ago.
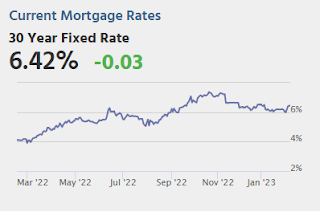
“Applications rose last week as the 30-year fixed mortgage rate inched lower to 6.18 percent, its fifth consecutive weekly decline. The 30-year fixed rate is almost a percentage point below its recent high of 7.16 percent in October 2022,” said Joel Kan, MBA’s Vice President and Deputy Chief Economist. “Both purchase and refinance applications increased last week and have shown gains in three of the past four weeks because of lower rates. Overall applications remained 58 percent lower than a year ago and rates are still significantly higher, however, this week’s results are a step in the right direction. Purchase activity that was put on hold last year due to the quick runup in rates is gradually coming back as rates ease and housing demand remains strong, driven by supportive demographics and the ongoing strength in the job market.”
Added Kan, “The average loan size on a purchase application increased to $428,500 – the largest average since May 2022. This increase is a sign that the recent upward trend in purchase activity remains skewed toward larger loan sizes and less first-time homebuyer activity, as entry level housing remains undersupplied, and buyers struggle with affordability in many markets.”
...
The average contract interest rate for 30-year fixed-rate mortgages with conforming loan balances ($726,200 or less) decreased to 6.18 percent from 6.19 percent, with points decreasing to 0.64 from 0.65 (including the origination fee) for 80 percent loan-to-value ratio (LTV) loans.
emphasis added
 Click on graph for larger image.
The first graph shows the refinance index since 1990.
 According to the MBA, purchase activity is down 37% year-over-year unadjusted. This has increased a little with lower rates, but is still near housing bust levels.
Tuesday, February 07, 2023
Leading Index for Commercial Real Estate Decreases in January
by Calculated Risk on 2/07/2023 07:48:00 PM
From Dodge Data Analytics: Dodge Momentum Index Dips in January
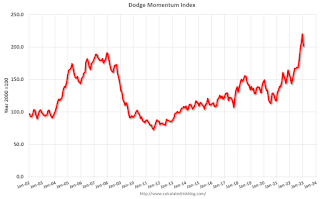
The Dodge Momentum Index (DMI), issued by Dodge Construction Network, fell 8.4% in January to 201.5 (2000=100) from the revised December reading of 220.0. In January, the commercial component of the DMI fell 10.0%, and the institutional component receded 4.7%.
“The Dodge Momentum Index weakened in January, after 10 consecutive months of gains. While planning activity slowed, the Index remains elevated, and the volume of projects remains steady,” stated Sarah Martin, associate director of forecasting for Dodge Construction Network. “After such strong growth in 2022, we expect the Index to work its way back towards historical norms this year, in tandem with weaker economic growth. Overall, levels of planning activity remained comparatively strong over the month — which bodes well for the construction sector.”
Weakness in commercial planning in January was broad-based, with office, warehouse, retail and hotel activity declining. Slower activity in education and amusement projects drove down the institutional portion of the Index, nullifying the impact of gains in healthcare and public planning over the month. On a year-over-year basis, the DMI remains 32% higher than in January 2022. The commercial component was up 40%, and the institutional component was 16% higher.
...
The DMI is a monthly measure of the initial report for nonresidential building projects in planning, shown to lead construction spending for nonresidential buildings by a full year.
emphasis added
 Click on graph for larger image.
This graph shows the Dodge Momentum Index since 2002. The index was at 201.5 in January, down from 220.0 in December.
According to Dodge, this index leads "construction spending for nonresidential buildings by a full year". This index suggests a solid pickup in commercial real estate construction into 2023.


