 RSS Feed
 by Calculated Risk on 2/14/2023 08:42:00 AM
Tuesday, February 14, 2023
Core CPI ex-Shelter declines to 3.9% YoY
The good news is that inflation has clearly peaked. And since rents are falling faster than seasonally normal - due to the pandemic related changes in household formation - it makes sense for the short term to use core CPI ex-shelter.
NOTE: There was a surge in household formation during the pandemic, pushing up rents sharply, and now household formation has slowed sharply just as more supply will be coming on the market.
 Click on graph for larger image.
This graph shows the year-over-year change in Core CPI ex-Shelter (blue), and the one month change annualized (red). The year-over-year change was at 3.9% in January, down from 4.5% in December.
Core CPI ex-Shelter has increased at a 1.3% annual rate over the last four months.
BLS: CPI increased 0.5% in January; Core CPI increased 0.4%
by Calculated Risk on 2/14/2023 08:32:00 AM
The Consumer Price Index for All Urban Consumers (CPI-U) rose 0.5 percent in January on a seasonally adjusted basis, after increasing 0.1 percent in December, the U.S. Bureau of Labor Statistics reported today. Over the last 12 months, the all items index increased 6.4 percent before seasonal adjustment.Both CPI and core CPI were at expectations. I'll post a graph later today after the Cleveland Fed releases the median and trimmed-mean CPI.
The index for shelter was by far the largest contributor to the monthly all items increase, accounting for nearly half of the monthly all items increase, with the indexes for food, gasoline, and natural gas also contributing. The food index increased 0.5 percent over the month with the food at home index rising 0.4 percent. The energy index increased 2.0 percent over the month as all major energy component indexes rose over the month.
The index for all items less food and energy rose 0.4 percent in January. Categories which increased in January include the shelter, motor vehicle insurance, recreation, apparel, and household furnishing s and operations indexes. The indexes for used cars and trucks, medical care, and airline fares were among those that decreased over the month.
The all items index increased 6.4 percent for the 12 months ending January; this was the smallest 12-month increase since the period ending October 2021. The all items less food and energy index rose 5.6 percent over the last 12 months, its smallest 12-month increase since December 2021. The energy index increased 8.7 percent for the 12 months ending January, and the food index increased 10.1 percent over the last year.
emphasis added
Monday, February 13, 2023
Tuesday: CPI
by Calculated Risk on 2/13/2023 08:58:00 PM
 Note: Mortgage rates are from MortgageNewsDaily.com and are for top tier scenarios.
Tuesday:
• At 6:00 AM ET, NFIB Small Business Optimism Index for January.
• At 8:30 AM, The Consumer Price Index for January from the BLS. The consensus is for 0.5% increase in CPI, and a 0.4% increase in core CPI. The consensus is for CPI to be up 6.2% year-over-year and core CPI to be up 5.5% YoY.
Demographics for Housing are not as Favorable as Projected 3 Years Ago
by Calculated Risk on 2/13/2023 01:15:00 PM
Almost a decade ago, I was positive on household formation and new home sales in the 2020s due to demographics.
In 2019 I wrote: I've also been positive on demographics too, but unfortunately with less immigration and more prime age deaths, the demographic outlook isn't as favorable as a few years ago (See Lawler:Lawler: Updated “Demographic” Outlook Using Recent Population Estimates by Age)
Census 2017 materially over-predicted births, materially under-predicted deaths (mainly for non-elderly adults), and somewhat over-predicted net international migration (NIM) for each of the last several years.
Then 3 years ago I linked to some population projections from the Census Bureau: A Changing Nation: Population Projections Under Alternative Immigration Scenarios. These projections were not as positive as the earlier projections that I used in the early 2010s.
In 2020, the Census Bureau had four immigration alternatives: main, low, high - and no immigration.
Using recently released data for 2022 - see Net Immigration and Household Formation - we can compare the various 2020 projections for 2022 with 2022 actuals.
In 2020, the Census Bureau had four immigration alternatives: main, low, high - and no immigration.
Using recently released data for 2022 - see Net Immigration and Household Formation - we can compare the various 2020 projections for 2022 with 2022 actuals.
Population and Projections (four immigration scenarios):
2022 Actual: 333,287,557
2020 Census Main: 337,342,000
2020 Census Low: 334,289,000
2020 Census High: 341,921,000
2020 Census None: 328,183,000
So, the actual was less than the low immigration projections from 3 years ago, although immigration was somewhat above housing economist Tom Lawler's projections last year. It is important to continually adjust our outlook based on updated data!
2nd Look at Local Housing Markets in January
by Calculated Risk on 2/13/2023 09:27:00 AM
Today, in the Calculated Risk Real Estate Newsletter:
2nd Look at Local Housing Markets in January
A brief excerpt:
This is the second look at local markets in January. I’m tracking about 40 local housing markets in the US. Some of the 40 markets are states, and some are metropolitan areas. I’ll update these tables throughout the month as additional data is released.There is much more in the article. You can subscribe at https://calculatedrisk.substack.com/
Closed sales in January were mostly for contracts signed in November and December. Since 30-year fixed mortgage rates were over 6% for all of November and December closed sales were down significantly year-over-year in January, however, the impact was probably not as severe as for closed sales in December (rates were the highest in October and November 2022 when contracts were signed for closing in December).
...
And here is a table for new listings in January. For these areas, new listings were down 9.2% YoY. Potential sellers that are locked into their current homes with low mortgage rates has pushed down new listings.
Last month, new listings in these markets were down 21.7% YoY. This is a significantly smaller YoY decline in new listings, and something to watch. There are certain markets - like Georgia and Florida - where new listings are up YoY!
Realtor.com is showing a much smaller YoY decline in new listings in January too.
...
Many more local markets to come!

Housing February 13th Weekly Update: Inventory Decreased 3.0% Week-over-week
by Calculated Risk on 2/13/2023 08:33:00 AM
Altos reports inventory was down 3.0% week-over-week. Usually inventory bottoms in early February, so we'd expect inventory to bottom seasonally soon.
Here are the same week inventory changes for the last five years:
2023: -13.6K
2022: -6.5K
2021: -12.0K
2020: -9.7K
2019: -4.1K
 Click on graph for larger image.
This inventory graph is courtesy of Altos Research.
As of February 10th, inventory was at 443 thousand (7-day average), compared to 457 thousand the prior week.

The red line is for 2023. The black line is for 2019. Note that inventory is up from the previous two years (the record low was in 2022), but still well below normal levels.
Inventory was up 78.0% compared to the same week in 2022 (last week it was up 78.8%), and down 45.4% compared to the same week in 2019 (last week down 44.0%).
A key will be when inventory starts increasing in 2023 - so far inventory has declined about 9.7% over the first six weeks of 2023.
Mike Simonsen discusses this data regularly on Youtube.
Sunday, February 12, 2023
Sunday Night Futures
by Calculated Risk on 2/12/2023 10:58:00 PM
Weekend:
• Schedule for Week of February 12, 2023
Monday:
• No major economic releases scheduled.
From CNBC: Pre-Market Data and Bloomberg futures S&P 500 futures are down 14 and DOW futures are down 90 (fair value).
Oil prices were up over the last week with WTI futures at $79.01 per barrel and Brent at $85.70 per barrel. A year ago, WTI was at $93, and Brent was at $98 - so WTI oil prices are DOWN 15% year-over-year.
Here is a graph from Gasbuddy.com for nationwide gasoline prices. Nationally prices are at $3.37 per gallon. A year ago, prices were at $3.45 per gallon, so gasoline prices are down $0.08 per gallon year-over-year.
Weather Boosted Employment by About 125,000 in January
by Calculated Risk on 2/12/2023 08:11:00 AM
Just some interesting data:
The BLS reported 251 thousand people were employed in non-agriculture industries, with a job, but not at work due to bad weather. The average for January over the previous 10 years was 273 thousand (median 247 thousand), so close to normal.
The BLS also reported 382 thousand people that are usually full-time employees were working part time in January due to bad weather. The average for January over the previous 10 years was 831 thousand (median was 645 thousand). This series suggests weather positively impacted employment more than usual (boosting seasonally adjusted employment).
The San Francisco Fed estimates Weather-Adjusted Change in Total Nonfarm Employment (monthly change, seasonally adjusted). They use local area weather to estimate the impact on employment. For January, the BLS reported 517 thousand jobs added, the San Francisco Fed estimated that weather boosted employment by around 125 thousand.
So, we should expect some negative payback in coming months.
Saturday, February 11, 2023
Real Estate Newsletter Articles this Week: "Home Prices Declined in December; Down 5.3% since June"
by Calculated Risk on 2/11/2023 02:11:00 PM
At the Calculated Risk Real Estate Newsletter this week:
• Black Knight Mortgage Monitor: Home Prices Declined in December; Down 5.3% since June
• Freddie Mac House Price Index Declines for 7th Consecutive Month in December
• 1st Look at Local Housing Markets in January
• Net Immigration and Household Formation
This is usually published 4 to 6 times a week and provides more in-depth analysis of the housing market.
You can subscribe at https://calculatedrisk.substack.com/
Most content is available for free (and no Ads), but please subscribe!
Schedule for Week of February 12, 2023
by Calculated Risk on 2/11/2023 08:11:00 AM
The key reports this week are January CPI, Housing Starts, and Retail sales.
For manufacturing, the January Industrial Production report, and the February NY and Philly Fed manufacturing surveys will be released this week.
No major economic releases scheduled.
6:00 AM: NFIB Small Business Optimism Index for January.
8:30 AM: The Consumer Price Index for January from the BLS. The consensus is for 0.5% increase in CPI, and a 0.4% increase in core CPI. The consensus is for CPI to be up 6.2% year-over-year and core CPI to be up 5.5% YoY.
7:00 AM ET: The Mortgage Bankers Association (MBA) will release the results for the mortgage purchase applications index.
 8:30 AM: Retail sales for January is scheduled to be released. The consensus is for a 1.5% increase in retail sales.
This graph shows retail sales since 1992. This is monthly retail sales and food service, seasonally adjusted (total and ex-gasoline).
8:30 AM: The New York Fed Empire State manufacturing survey for February. The consensus is for a reading of -20.0, up from -32.9.
 9:15 AM: The Fed will release Industrial Production and Capacity Utilization for January.
This graph shows industrial production since 1967.
The consensus is for a 0.5% increase in Industrial Production, and for Capacity Utilization to increase to 79.1%.
10:00 AM: The February NAHB homebuilder survey. The consensus is for a reading of 37, up from 35. Any number below 50 indicates that more builders view sales conditions as poor than good.
8:30 AM: The initial weekly unemployment claims report will be released. The consensus is for 200 thousand initial claims, up from 196 thousand last week.
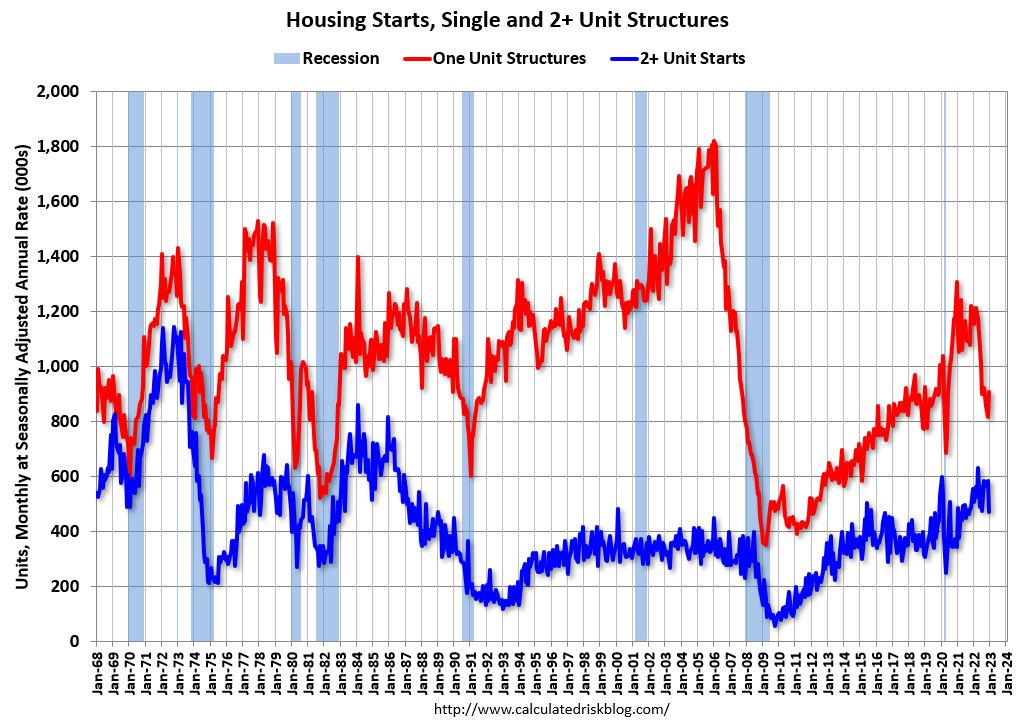 8:30 AM: Housing Starts for January.
 This graph shows single and multi-family housing starts since 1968.
The consensus is for 1.361 million SAAR, down from 1.382 million SAAR.
8:30 AM ET: The Producer Price Index for December from the BLS. The consensus is for a 0.4% increase in PPI, and a 0.3% increase in core PPI.
8:30 AM: the Philly Fed manufacturing survey for February. The consensus is for a reading of -6.7, up from -8.9.
11:00 AM: NY Fed: Q4 Quarterly Report on Household Debt and Credit
No major economic releases scheduled.


