 RSS Feed
 by Calculated Risk on 2/16/2023 08:30:00 AM
Thursday, February 16, 2023
Weekly Initial Unemployment Claims decrease to 194,000
The DOL reported:
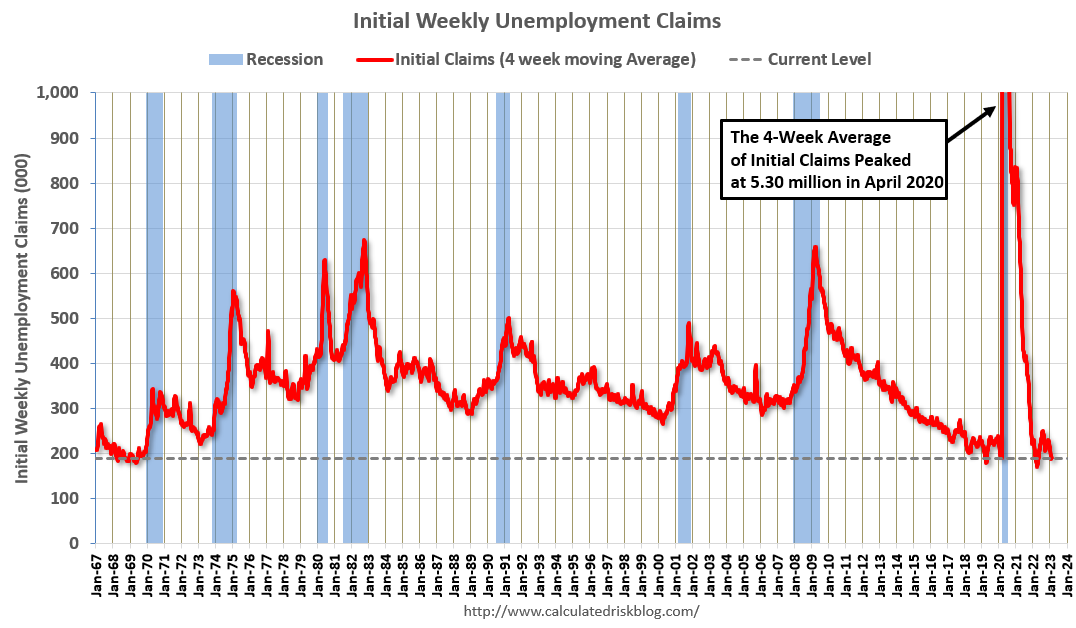
In the week ending February 11, the advance figure for seasonally adjusted initial claims was 194,000, a decrease of 1,000 from the previous week's revised level. The previous week's level was revised down by 1,000 from 196,000 to 195,000. The 4-week moving average was 189,500, an increase of 500 from the previous week's revised average. The previous week's average was revised down by 250 from 189,250 to 189,000.The following graph shows the 4-week moving average of weekly claims since 1971.
emphasis added
 Click on graph for larger image.
The dashed line on the graph is the current 4-week average. The four-week average of weekly unemployment claims increased to 189,500.
The previous week was revised down.
Weekly claims were below the consensus forecast.
Wednesday, February 15, 2023
Thursday: Housing Starts, Unemployment Claims, PPI, Philly Fed Mfg, NY Fed Household Debt and Credit
by Calculated Risk on 2/15/2023 08:53:00 PM
 Note: Mortgage rates are from MortgageNewsDaily.com and are for top tier scenarios.
Thursday:
• At 8:30 AM ET, The initial weekly unemployment claims report will be released. The consensus is for 200 thousand initial claims, up from 196 thousand last week.
• Also at 8:30 AM, Housing Starts for January. The consensus is for 1.361 million SAAR, down from 1.382 million SAAR.
• Also at 8:30 AM, The Producer Price Index for December from the BLS. The consensus is for a 0.4% increase in PPI, and a 0.3% increase in core PPI.
• Also at 8:30 AM, the Philly Fed manufacturing survey for February. The consensus is for a reading of -6.7, up from -8.9.
• At 11:00 AM, NY Fed: Q4 Quarterly Report on Household Debt and Credit
Update: Some "Good News" for Homebuilders
by Calculated Risk on 2/15/2023 12:39:00 PM
Today, in the Calculated Risk Real Estate Newsletter: Update: Some "Good News" for Homebuilders
A brief excerpt:
Last October I wrote: Some "Good News" for HomebuildersThere is much more in the article. You can subscribe at https://calculatedrisk.substack.com/
I noted:Even though we can expect significant further declines in new home sales and single-family housing starts, the good news for the homebuilders is activity usually picks up quickly following an interest rate induced slowdown (as opposed to following the housing bust when the recovery took many years).I included the following graph to illustrate this point. The following graph shows new home sales for three periods: 1978-1982, 2005-2020, and current (red). The prior peak in sales is set to 100 (updated through the December New Home sales release).
...
My sense is this downturn will have some similarities to the 1980 period, see: Housing: Don't Compare the Current Housing Boom to the Bubble and Bust

NAHB: Builder Confidence Increased in February
by Calculated Risk on 2/15/2023 10:07:00 AM
The National Association of Home Builders (NAHB) reported the housing market index (HMI) was at 42, up from 35 last month. Any number below 50 indicates that more builders view sales conditions as poor than good.
From the NAHB: Cautious Optimism for Builders in February
Two consecutive solid monthly gains for builder confidence, spurred in part by easing mortgage rates, signal that the housing market may be turning a corner even as builders continue to contend with high construction costs and building material supply chain logjams. Builder confidence in the market for newly built single-family homes in February rose seven points to 42, according to the National Association of Home Builders (NAHB)/Wells Fargo Housing Market Index (HMI) released today. This is the strongest reading since September of last year.
...
“While the HMI remains below the breakeven level of 50, the increase from 31 to 42 from December to February is a positive sign for the market,” said NAHB Chief Economist Robert Dietz. “Even as the Federal Reserve continues to tighten monetary policy conditions, forecasts indicate that the housing market has passed peak mortgage rates for this cycle. And while we expect ongoing volatility for mortgage rates and housing costs, the building market should be able to achieve stability in the coming months, followed by a rebound back to trend home construction levels later in 2023 and the beginning of 2024.”And while builders continue to offer a variety of incentives to attract buyers during this housing downturn, recent data indicate that the housing market is showing signs of stabilizing off a cyclical low:
• 31% of builders reduced home prices in February, down from 35% in December and 36% in November.
• The average price drop in February was 6%, down from 8% in December, and tied with 6% in November.
• 57% offered some kind of incentive in February, down from 62% in December and 59% in November.
...
All three HMI indices posted gains for the second consecutive month. The HMI index gauging current sales conditions in February rose six points to 46, the component charting sales expectations in the next six months increased 11 points to 48 and the gauge measuring traffic of prospective buyers increased six points to 29.
Looking at the three-month moving averages for regional HMI scores, the Northeast rose four points to 37, the Midwest edged one-point higher to 33, the South increased four points to 40 and the West moved three points higher to 30
emphasis added
 Click on graph for larger image.
This graph shows the NAHB index since Jan 1985.
This was above the consensus forecast.
The "traffic of prospective buyers" is still well below breakeven at 29 (below 50).
Industrial Production Unchanged in January
by Calculated Risk on 2/15/2023 09:22:00 AM
From the Fed: Industrial Production and Capacity Utilization
Industrial production was unchanged in January after falling 0.6 percent and 1.0 percent in November and December, respectively. In January, manufacturing output moved up 1.0 percent and mining output rose 2.0 percent following two months with substantial decreases for each sector. The output of utilities fell 9.9 percent in January, as a swing from unseasonably cool weather in December to unseasonably warm weather in January depressed the demand for heating. At 103.0 percent of its 2017 average, total industrial production in January was 0.8 percent above its year-earlier level. Capacity utilization declined 0.1 percentage point in January to 78.3 percent, a rate that is 1.3 percentage points below its long-run (1972–2022) average.
emphasis added
 Click on graph for larger image.
This graph shows Capacity Utilization. This series is up from the record low set in April 2020, and above the level in February 2020 (pre-pandemic).
Capacity utilization at 78.3% is 1.3% below the average from 1972 to 2021. This was below consensus expectations.
Note: y-axis doesn't start at zero to better show the change.
 The second graph shows industrial production since 1967.
Industrial production increased slightly in January to 103.0. This is above the pre-pandemic level.
The change in industrial production was below consensus expectations.
Retail Sales Increased 3.0% in January
by Calculated Risk on 2/15/2023 08:39:00 AM
On a monthly basis, retail sales were up 3.0% from December to January (seasonally adjusted), and sales were up 6.4 percent from January 2022.
From the Census Bureau report:
Advance estimates of U.S. retail and food services sales for January 2023, adjusted for seasonal variation and holiday and trading-day differences, but not for price changes, were $697.0 billion, up 3.0 percent from the previous month, and up 6.4 percent above January 2022.
emphasis added
 Click on graph for larger image.
This graph shows retail sales since 1992. This is monthly retail sales and food service, seasonally adjusted (total and ex-gasoline).
Retail sales ex-gasoline were up 3.2% in January.
The second graph shows the year-over-year change in retail sales and food service (ex-gasoline) since 1993.
Retail and Food service sales, ex-gasoline, increased by 6.8% on a YoY basis.
 Sales in January were well above expectations, however, sales in November and December were revised down, combined.
MBA: Mortgage Applications Decreased in Latest Weekly Survey
by Calculated Risk on 2/15/2023 07:00:00 AM
From the MBA: Mortgage Applications Decrease in Latest MBA Weekly Survey
Mortgage applications decreased 7.7 percent from one week earlier, according to data from the Mortgage Bankers Association’s (MBA) Weekly Mortgage Applications Survey for the week ending February 10, 2023.
... The Refinance Index decreased 13 percent from the previous week and was 76 percent lower than the same week one year ago. The seasonally adjusted Purchase Index decreased 6 percent from one week earlier. The unadjusted Purchase Index decreased 5 percent compared with the previous week and was 43 percent lower than the same week one year ago.
“Mortgage rates increased across the board last week, pushed higher by market expectations that inflation will persist, thus requiring the Federal Reserve to keep monetary policy restrictive for a longer time. After five straight weeks of decreases, the 30-year fixed rate increased by 21 basis points to 6.39 percent,” said Joel Kan, MBA’s Vice President and Deputy Chief Economist. “Mortgage applications decreased for the second time in three weeks because of these higher rates. Refinance borrowers, both rate/term and cash-out, remain on the sidelines as current rates provide little financial incentive to act.”
Added Kan, “Purchase applications dropped to their lowest level since the beginning of this year and were more than 40 percent lower than a year ago. Potential buyers remain quite sensitive to the current level of mortgage rates, which are more than two percentage points above last year’s levels and have significantly reduced buyers’ purchasing power.”
...
The average contract interest rate for 30-year fixed-rate mortgages with conforming loan balances ($726,200 or less) increased to 6.39 percent from 6.18 percent, with points increasing to 0.70 from 0.64 (including the origination fee) for 80 percent loan-to-value ratio (LTV) loans.
emphasis added
 Click on graph for larger image.
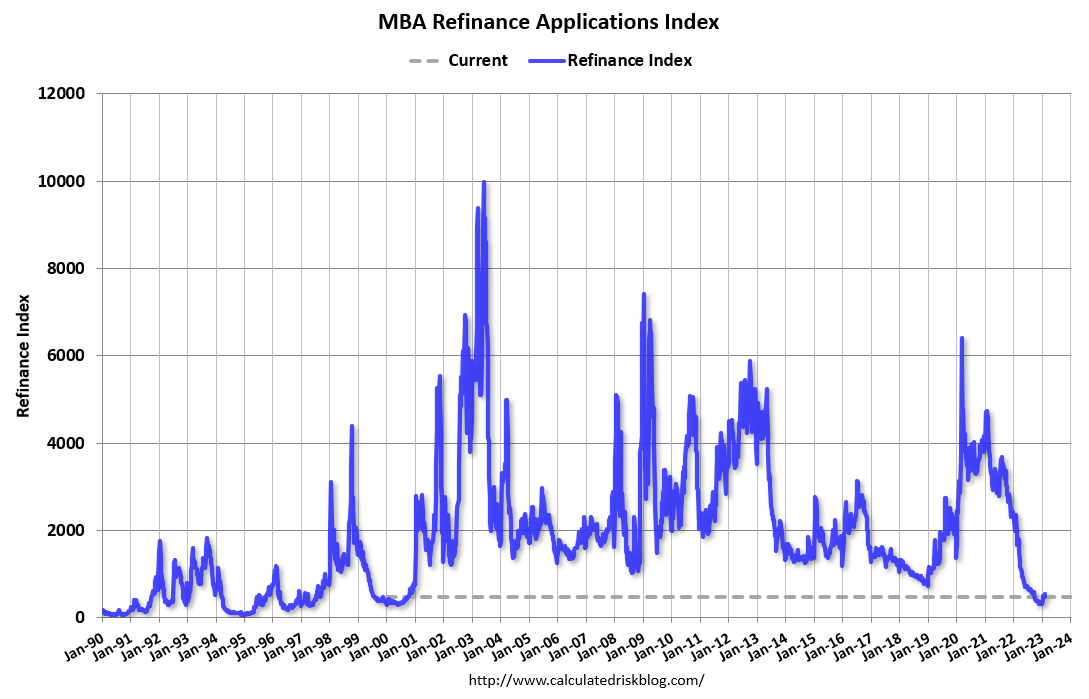
The first graph shows the refinance index since 1990.
With higher mortgage rates, the refinance index declined sharply in 2022.
Five weeks ago, the refinance index was at the lowest level since the year 2000, but it has rebounded somewhat as rates declined.
The second graph shows the MBA mortgage purchase index.
 According to the MBA, purchase activity is down 43% year-over-year unadjusted. This has increased a little with lower rates but is still near housing bust levels.
Note: Red is a four-week average (blue is weekly).
Tuesday, February 14, 2023
Wednesday: Retail Sales, Industrial Production, Homebuilder Survey, NY Fed Mfg
by Calculated Risk on 2/14/2023 09:01:00 PM
 Note: Mortgage rates are from MortgageNewsDaily.com and are for top tier scenarios.
Wednesday:
• At 7:00 AM ET, The Mortgage Bankers Association (MBA) will release the results for the mortgage purchase applications index.
• At 8:30 AM, Retail sales for January is scheduled to be released. The consensus is for a 1.5% increase in retail sales.
• Also at 8:30 AM, The New York Fed Empire State manufacturing survey for February. The consensus is for a reading of -20.0, up from -32.9.
• At 9:15 AM, The Fed will release Industrial Production and Capacity Utilization for January. The consensus is for a 0.5% increase in Industrial Production, and for Capacity Utilization to increase to 79.1%.
• At 10:00 AM, The February NAHB homebuilder survey. The consensus is for a reading of 37, up from 35. Any number below 50 indicates that more builders view sales conditions as poor than good.
Cleveland Fed: Median CPI increased 0.7% and Trimmed-mean CPI increased 0.6% in January
by Calculated Risk on 2/14/2023 04:20:00 PM
The Cleveland Fed released the median CPI and the trimmed-mean CPI:
According to the Federal Reserve Bank of Cleveland, the median Consumer Price Index rose 0.7% in January. The 16% trimmed-mean Consumer Price Index increased 0.6% in January. "The median CPI and 16% trimmed-mean CPI are measures of core inflation calculated by the Federal Reserve Bank of Cleveland based on data released in the Bureau of Labor Statistics’ (BLS) monthly CPI report".
 Click on graph for larger image.
This graph shows the year-over-year change for these four key measures of inflation.
On a year-over-year basis, the median CPI rose 7.1%, the trimmed-mean CPI rose 6.6%, and the CPI less food and energy rose 5.6%. Core PCE is for December and increased 4.4% year-over-year.
Note: The Cleveland Fed released the median CPI details. "Fuel oil and other fuels" decreased at a 38% annualized rate in January, and "Used Cars" decreased at a 21% annualized rate.
Note that Owners' Equivalent Rent and Rent of Primary Residence account for 1/3 of median CPI, and these measures were up an average of close to 8.5% annualized. This data is lagged, and rents have been declining in recent months (due to the sharp slowdown in household formation). To reflect this, I've added core CPI ex-shelter, and that has declined to 3.8% YoY.
Current State of the Housing Market: Overview for mid-February
by Calculated Risk on 2/14/2023 08:53:00 AM
Today, in the Calculated Risk Real Estate Newsletter: Current State of the Housing Market: Overview for mid-February
A brief excerpt:
Here is a graph of new listing from Realtor.com’s January Housing Trends Report showing new listings were down about 5% year-over-year in January. Although new listings are at a record low for January, the year-over-year decline was smaller in January than in Q4 2022. From Realtor.com:There is much more in the article. You can subscribe at https://calculatedrisk.substack.com/In January, the number of homes newly-listed for sale declined by 5.4% compared to the same time last year. This is a much lower rate of decline than last month’s 21.0% decrease and November’s 17.2% decrease. However, new listings remain 25.0% below pre-pandemic 2017 to 2019 levels.And the local markets I track that have reported so far, show new listings were down less in January than in December.
For these areas, new listings were down 9.2% YoY. … Last month, new listings in these markets were down 21.7% YoY. This is a significantly smaller YoY decline in new listings, and something to watch.


