 RSS Feed
 by Calculated Risk on 2/18/2023 08:11:00 AM
Saturday, February 18, 2023
Schedule for Week of February 19, 2023
The key reports this week are January New and Existing Home sales, the second estimate of Q4 GDP and Personal Income and Outlays for January.
All US markets will be closed in observance of the Presidents' Day holiday.
 10:00 AM: Existing Home Sales for January from the National Association of Realtors (NAR). The consensus is for 4.10 million SAAR, up from 4.02 million.
The graph shows existing home sales from 1994 through the report last month.
Housing economist Tom Lawler expects the NAR to report sales of 4.18 million SAAR for January.
7:00 AM ET: The Mortgage Bankers Association (MBA) will release the results for the mortgage purchase applications index.
During the day: The AIA's Architecture Billings Index for January (a leading indicator for commercial real estate).
2:00 PM: FOMC Minutes, Meeting of January 31-February 1, 2023
8:30 AM: The initial weekly unemployment claims report will be released. The consensus is for 200 thousand initial claims, up from 194 thousand last week.
8:30 AM: Gross Domestic Product, 4th quarter 2022 (Second estimate). The consensus is that real GDP increased 2.9% annualized in Q4, unchanged from the advance estimate of 2.9%.
8:30 AM ET: Chicago Fed National Activity Index for January. This is a composite index of other data.
11:00 AM: the Kansas City Fed manufacturing survey for February.
8:30 AM ET: Personal Income and Outlays for January. The consensus is for a 0.9% increase in personal income, and for a 1.3% increase in personal spending. And for the Core PCE price index to increase 0.4%. PCE prices are expected to be up 4.9% YoY, and core PCE prices up 4.3% YoY.
 10:00 AM: New Home Sales for January from the Census Bureau.
 This graph shows New Home Sales since 1963.
The dashed line is the sales rate for last month.
The consensus is that new home sales increased to 620 thousand SAAR, down from 616 thousand in December.
10:00 AM: University of Michigan's Consumer sentiment index (Final for February). The consensus is for a reading of 66.4.
10:00 AM: University of Michigan's Consumer sentiment index (Final for February). The consensus is for a reading of 66.4.
Friday, February 17, 2023
COVID Feb 17, 2023: Update on Cases, Hospitalizations and Deaths
by Calculated Risk on 2/17/2023 09:00:00 PM
 Note: Mortgage rates are from MortgageNewsDaily.com and are for top tier scenarios.
On COVID (focus on hospitalizations and deaths). Data is now weekly.
| COVID Metrics | ||||
|---|---|---|---|---|
| Now | Week Ago | Goal | ||
| New Cases per Week2 | 259,339 | 282,901 | ≤35,0001 | |
| Hospitalized2 | 22,059 | 23,937 | ≤3,0001 | |
| Deaths per Week2 | 2,838 | 3,166 | ≤3501 | |
| 1my goals to stop weekly posts, 2Weekly for Cases, Currently Hospitalized, and Deaths 🚩 Increasing number weekly for Cases, Hospitalized, and Deaths ✅ Goal met. | ||||
 Click on graph for larger image.
This graph shows the weekly (columns) number of deaths reported.
The pandemic low was the week of July 7, 2021, at 1,690 deaths.
3rd Look at Local Housing Markets in January; Lawler: Early Read on Existing Home Sales in January
by Calculated Risk on 2/17/2023 03:20:00 PM
Today, in the Calculated Risk Real Estate Newsletter: 3rd Look at Local Housing Markets in January
A brief excerpt:
From housing economist Tom Lawler:There is much more in the article. You can subscribe at https://calculatedrisk.substack.com/Based on publicly-available local realtor/MLS reports released across the country through today, I project that existing home sales as estimated by the National Association of Realtors ran at a seasonally adjusted annual rate of 4.18 million in January, up 4.0% from December’s preliminary pace and down 35.6% from last January’s seasonally adjusted pace....In January, sales were down 33.9% in these markets. In December, these same markets were down 37.5% YoY Not Seasonally Adjusted (NSA).
This is a smaller YoY decline than in December for these markets. This data suggests NAR reported sales will rebound in January from 4.02 million SAAR in December.
This will still be a significant YoY decline, and the 17th consecutive month with a YoY decline.

Realtor.com Reports Weekly Active Inventory Up 70% YoY; New Listings Down 13% YoY
by Calculated Risk on 2/17/2023 12:42:00 PM
Realtor.com has monthly and weekly data on the existing home market. Here is their weekly report released today from Chief Economist Danielle Hale: Weekly Housing Trends View — Data Week Ending Feb 11, 2023
• Active inventory growth continued to climb with for-sale homes up 70% above one year ago. Inventories of for-sale homes rose again, on par with the yearly gains we saw last week. Still-low buyer interest amid high costs rather than an influx of sellers is driving this increase. Even after these huge gains, January data show that nationwide there are still more than 40% fewer homes for sale than were available pre-pandemic,
...
• New listings–a measure of sellers putting homes up for sale–were again down, this week by 13% from one year ago. For 32 weeks now, fewer homeowners put their homes on the market for sale than at this time last year. After smaller declines in the first few weeks of the year, the gap has widened for a third week, indicating lower seller interest than we saw one year ago.
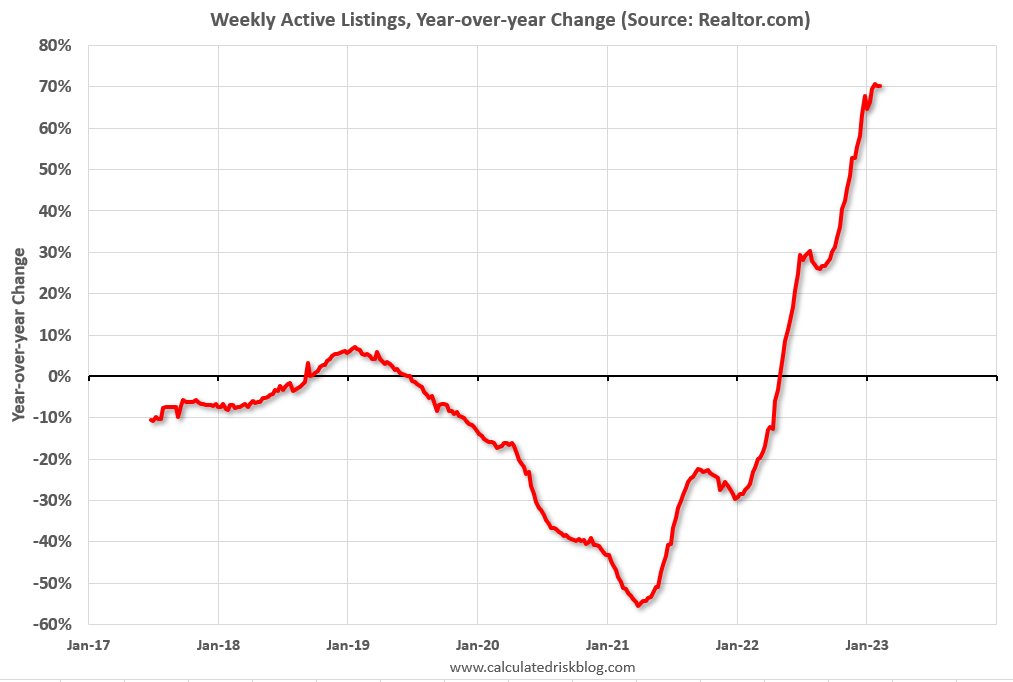 Here is a graph of the year-over-year change in inventory according to realtor.com.
 In early 2022, inventory was declining rapidly, so the year-over-year change is up sharply.
Q1 GDP Tracking: Around 1.5%
by Calculated Risk on 2/17/2023 09:40:00 AM
From BofA:
On net,this week’s data initiated our 1Q US GDP tracking estimate at 1.5% q/q saar, somewat above our official forecast of 1.0%. The data also reduced our 4Q US GDP tracking estimate from 3.2% q/q saar to 2.9%. [Feb 17th estimate]From Goldman:
emphasis added
We left our Q1 GDP tracking estimate unchanged at +1.4% (qoq ar) and our domestic final sales forecast unchanged at +1.9%. We also left our past-quarter GDP tracking estimate for Q4 unchanged at +3.0%, compared to +2.9% as originally reported. [Feb 16th estimate]And from the Altanta Fed: GDPNow
The GDPNow model estimate for real GDP growth (seasonally adjusted annual rate) in the first quarter of 2023 is 2.5 percent on February 16, up from February 15. After this morning’s housing starts report from the US Census Bureau, the nowcast of first-quarter real residential investment growth increased from -10.4 percent to -8.1 percent. [Feb 16th estimate]
Hotels: Occupancy Rate Down 8.7% Compared to Same Week in 2019
by Calculated Risk on 2/17/2023 08:34:00 AM
U.S. hotel performance increased from the previous week, according to STR‘s latest data through Feb. 11.The following graph shows the seasonal pattern for the hotel occupancy rate using the four-week average.
Feb. 5-11, 2023 (percentage change from comparable week in 2019*):
• Occupancy: 57.8% (-8.7%)
• Average daily rate (ADR): $150.97 (+13.4%)
• Revenue per available room (RevPAR): $87.21 (+3.6%)
*Due to the pandemic impact, STR is measuring recovery against comparable time periods from 2019. Year-over-year comparisons will once again become standard after the first quarter.
emphasis added
 Click on graph for larger image.
The red line is for 2023, black is 2020, blue is the median, and dashed light blue is for 2022. Dashed purple is 2019 (STR is comparing to a strong year for hotels).
The 4-week average of the occupancy rate is close to the median rate for the previous 20 years (Blue).
Note: Y-axis doesn't start at zero to better show the seasonal change.
The 4-week average of the occupancy rate will increase seasonally over the next two months.
Thursday, February 16, 2023
MBA: "Mortgage Delinquencies Increase in the Fourth Quarter of 2022"
by Calculated Risk on 2/16/2023 01:42:00 PM
From the MBA: Mortgage Delinquencies Increase in the Fourth Quarter of 2022
The delinquency rate for mortgage loans on one-to-four-unit residential properties increased to a seasonally adjusted rate of 3.96 percent of all loans outstanding at the end of the fourth quarter of 2022, according to the Mortgage Bankers Association’s (MBA) National Delinquency Survey.
The delinquency rate was up 51 basis points from the third quarter of 2022 but still down 69 basis points from one year ago. The percentage of loans on which foreclosure actions were started in the fourth quarter fell by 1 basis point to 0.14 percent.
“As expected, the overall national mortgage delinquency rate increased in the fourth quarter of 2022 from its previous quarterly survey low,” said Marina Walsh, CMB, MBA’s Vice President of Industry Analysis. “The weaker economy and ongoing inflationary pressures contributed to the uptick in delinquencies. The delinquency rate – while still low – increased from the previous quarter across all loan types and across all stages of delinquency.”
According to Walsh, for the past 15 years, mortgage delinquencies have tracked very closely with employment conditions. Despite recent indicators of resiliency in the job market, including the unemployment rate declining to 3.4 percent in January, MBA still forecasts for slower hiring and rising unemployment, with the rate rising to 5.2 percent by the end of the year. This will likely mean further increases in mortgage delinquencies.
Added Walsh, “Notwithstanding the fourth-quarter increase in mortgage delinquencies, the foreclosure starts rate of 0.14 percent was well below the historical quarterly average of 0.40 percent. Many distressed homeowners have loss mitigation options available to them and have accumulated home equity, which can ease financial hardship and avert foreclosure actions.”
emphasis added
 Click on graph for larger image.
This graph shows the percent of loans delinquent by days past due. Overall delinquencies increased in Q4 from a record low in Q3.
From the MBA:
Compared to last quarter, the seasonally adjusted mortgage delinquency rate increased for all loans outstanding. By stage, the 30-day delinquency rate increased 26 basis points to 1.92 percent, the 60-day delinquency rate increased 13 basis points to 0.66 percent, and the 90-day delinquency bucket increased 11 basis points to 1.38 percent.The sharp increase in 2020 in the 90-day bucket was due to loans in forbearance (included as delinquent, but not reported to the credit bureaus).
...
The delinquency rate includes loans that are at least one payment past due but does not include loans in the process of foreclosure. The percentage of loans in the foreclosure process at the end of the fourth quarter was 0.57 percent, up 1 basis point from the third quarter of 2022 and 15 basis points higher than one year ago.
The percent of loans in the foreclosure process increased year-over-year in Q4 with the end of the foreclosure moratoriums but are still historically low.
NY Fed Q4 Report: Household Debt Increases, Mortgage and Auto Loan Growth Slows
by Calculated Risk on 2/16/2023 11:21:00 AM
From the NY Fed: Total Household Debt Reaches $16.90 trillion in Q4 2022; Mortgage and Auto Loan Growth Slows
The Federal Reserve Bank of New York's Center for Microeconomic Data today issued its Quarterly Report on Household Debt and Credit. The Report shows an increase in total household debt in the fourth quarter of 2022, increasing by $394 billion (2.4%) to $16.90 trillion. Balances now stand $2.75 trillion higher than at the end of 2019, before the pandemic recession. The report is based on data from the New York Fed's nationally representative Consumer Credit Panel.
Mortgage balances rose by $254 billion in the fourth quarter of 2022 and stood at $11.92 trillion at the end of December, marking a nearly $1 trillion increase in mortgage balances in 2022.
Credit card balances increased $61 billion in the fourth quarter to $986 billion, surpassing the pre-pandemic high of $927 billion. Auto loan balances increased by $28 billion in the fourth quarter, consistent with the upward trajectory seen since 2011. Student loan balances now stand at $1.60 trillion, up by $21 billion from the previous quarter. In total, non-housing balances grew by $126 billion.
Mortgage originations, which include refinances, fell to $498 billion in the fourth quarter, representing a return to lower levels last seen in 2019. The volume of newly originated auto loans was $186 billion, representing a slight increase from the previous quarter. Aggregate limits on credit card accounts increased by $88 billion in the fourth quarter and now stand at $4.4 trillion.
The share of current debt becoming delinquent increased again in the fourth quarter for nearly all debt types, following two years of historically low delinquency transitions. The delinquency transition rate for credit cards and auto loans increased by 0.6 and 0.4 percentage points, respectively.
"Credit card balances grew robustly in the 4th quarter, while mortgage and auto loan balances grew at a more moderate pace, reflecting activity consistent with pre-pandemic levels," said Wilbert van der Klaauw, economic research advisor at the New York Fed. "Although historically low unemployment has kept consumer's financial footing generally strong, stubbornly high prices and climbing interest rates may be testing some borrowers' ability to repay their debts."
emphasis added
 Click on graph for larger image.
Here are three graphs from the report:
The first graph shows aggregate consumer debt increased in Q4. Household debt previously peaked in 2008 and bottomed in Q3 2013. Unlike following the great recession, there wasn't a decline in debt during the pandemic.
From the NY Fed:
Aggregate household debt balances increased by $394 billion in the fourth quarter of 2022, a 2.4% rise from 2022Q3. Balances now stand at $16.90 trillion and have increased by $2.75 trillion since the end of 2019, just before the pandemic recession.
 The second graph shows the percent of debt in delinquency.
The overall delinquency rate decreased in Q4. From the NY Fed:
Aggregate delinquency rates decreased in the fourth quarter of 2022 and remained low, after declining sharply through the beginning of the pandemic, although there has been some shift in the composition, with increases in the share of balances that are 30- 59 days past due and declines in seriously delinquent balances. As of December, 2.5% of outstanding debt was in some stage of delinquency, 2.2 percentage points lower than last quarter of 2019, just before the COVID-19 pandemic hit the United States.
 The third graph shows Mortgage Originations by Credit Score.
From the NY Fed:
Mortgage originations, measured as appearances of new mortgages on consumer credit reports, declined to $498 billion in 2022Q4, back to the lower levels seen in 2019. ... The median credit score of newly originated mortgages declined again, to 766, down from a series high in 2021Q1 of 788 and returning to pre-covid levels which remain very high and reflect continuing high lending standards. The median credit score on newly originated auto loans was down slightly, to 711, but remained about level with the past two years.There is much more in the report.
January Housing Starts: Near Record Number of Housing Units Under Construction
by Calculated Risk on 2/16/2023 09:26:00 AM
Today, in the CalculatedRisk Real Estate Newsletter: January Housing Starts: Near Record Number of Housing Units Under Construction
Excerpt:
Possibly Important: Multi-family permits averaged 547,000 SAAR over the last three months after averaging close to 650,000 SAAR over the previous 8 months. This decline in permits is a possible signal that the expected decline in multi-family starts has begun (although permits aren’t a perfect leading indicator for starts).There is much more in the post. You can subscribe at https://calculatedrisk.substack.com/
...
The fourth graph shows housing starts under construction, Seasonally Adjusted (SA).
Red is single family units. Currently there are 752 thousand single family units (red) under construction (SA). This was down in January compared to December, and 76 thousand below the recent peak in April and May 2022. Single family units under construction have peaked since single family starts are now declining. The reason there are still so many homes under construction is probably due to supply constrain
Blue is for 2+ units. Currently there are 948 thousand multi-family units under construction. This is the highest level since November 1973! For multi-family, construction delays are probably also a factor. The completion of these units should help with rent pressure.
Combined, there are 1.700 million units under construction, just below the all-time record of 1.711 million set in October 2022.
...
The weakness in 2022 was mostly for single family starts; however, it appears the expected decline in multi-family starts has begun.

Housing Starts Decreased to 1.309 million Annual Rate in January
by Calculated Risk on 2/16/2023 08:42:00 AM
From the Census Bureau: Permits, Starts and Completions
Housing Starts:
Privately‐owned housing starts in January were at a seasonally adjusted annual rate of 1,309,000. This is 4.5 percent below the revised December estimate of 1,371,000 and is 21.4 percent below the January 2022 rate of 1,666,000. Single‐family housing starts in January were at a rate of 841,000; this is 4.3 percent below the revised December figure of 879,000. The January rate for units in buildings with five units or more was 457,000.
Building Permits:
Privately‐owned housing units authorized by building permits in January were at a seasonally adjusted annual rate of 1,339,000. This is 0.1 percent above the revised December rate of 1,337,000, but is 27.3 percent below the January 2022 rate of 1,841,000. Single‐family authorizations in January were at a rate of 718,000; this is 1.8 percent below the revised December figure of 731,000. Authorizations of units in buildings with five units or more were at a rate of 563,000 in January
emphasis added
 Click on graph for larger image.
The first graph shows single and multi-family housing starts for the last several years.
Multi-family starts (blue, 2+ units) decreased in January compared to December. Multi-family starts were down 8.1% year-over-year in January.
Single-family starts (red) decreased in January and were down 27.3% year-over-year.
 The second graph shows single and multi-family housing starts since 1968.
 This shows the huge collapse following the housing bubble, and then the eventual recovery - and the recent collapse in single-family starts.
Total housing starts in January were below expectations, however, starts in November and December were revised up slightly, combined.
I'll have more later …


