 RSS Feed
 by Calculated Risk on 2/21/2023 10:47:00 AM
Tuesday, February 21, 2023
NAR: Existing-Home Sales Decreased to 4.00 million SAAR in January; Median Prices Down 13.2% from Peak in June 2022
Today, in the CalculatedRisk Real Estate Newsletter: NAR: Existing-Home Sales Decreased to 4.00 million SAAR in January
Excerpt:
On prices, the NAR reported:There is much more in the article. You can subscribe at https://calculatedrisk.substack.com/ Please subscribe!The median existing-home price3 for all housing types in January was $359,000, an increase of 1.3% from January 2022 ($354,300), as prices climbed in three out of four U.S. regions while falling in the West. This marks 131 consecutive months of year-over-year increases, the longest-running streak on record.Median prices are distorted by the mix (repeat sales indexes like Case-Shiller and FHFA are probably better for measuring prices).
The YoY change in the median price peaked at 25.2% in May 2021 and has now slowed to 1.3%. Note that the median price usually starts falling seasonally in July, so the 2.0% decline in January in the median price was partially seasonal, however the 13.2% decline in the median price over the last seven months has been much larger than the usual seasonal decline.
It is likely the median price will be down year-over-year soon - and the Case-Shiller index will follow.

NAR: Existing-Home Sales Decreased to 4.00 million SAAR in January
by Calculated Risk on 2/21/2023 10:15:00 AM
From the NAR: Existing-Home Sales Descended 0.7% in January
Existing-home sales fell for the twelfth straight month in January, according to the National Association of Realtors®. Month-over-month sales were mixed among the four major U.S. regions, as the South and West registered increases, while the East and Midwest experienced declines. All regions recorded year-over-year declines.
Total existing-home sales, completed transactions that include single-family homes, townhomes, condominiums and co-ops – slid 0.7% from December 2022 to a seasonally adjusted annual rate of 4.00 million in January. Year-over-year, sales retreated 36.9% (down from 6.34 million in January 2022).
...
Total housing inventory registered at the end of January was 980,000 units, up 2.1% from December and 15.3% from one year ago (850,000). Unsold inventory sits at a 2.9-month supply at the current sales pace, unchanged from December but up from 1.6 months in January 2022.
emphasis added
 Click on graph for larger image.
This graph shows existing home sales, on a Seasonally Adjusted Annual Rate (SAAR) basis since 1993.
Sales in January (4.00 million SAAR) were down 0.7% from the previous month and were 36.9% below the January 2022 sales rate.
The second graph shows nationwide inventory for existing homes.
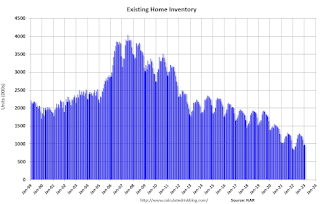 According to the NAR, inventory increased to 0.99 million in January from 0.96 million in December.
 According to the NAR, inventory increased to 0.99 million in January from 0.96 million in December.
Headline inventory is not seasonally adjusted, and inventory usually decreases to the seasonal lows in December and January, and peaks in mid-to-late summer.
The last graph shows the year-over-year (YoY) change in reported existing home inventory and months-of-supply. Since inventory is not seasonally adjusted, it really helps to look at the YoY change. Note: Months-of-supply is based on the seasonally adjusted sales and not seasonally adjusted inventory.
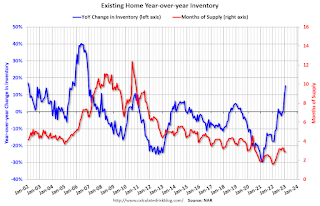 Inventory was up 15.3% year-over-year (blue) in January compared to January 2022.
Months of supply (red) was unchanged at 2.9 months in January from 2.9 months in December.
This was below the consensus forecast. I'll have more later.
The last graph shows the year-over-year (YoY) change in reported existing home inventory and months-of-supply. Since inventory is not seasonally adjusted, it really helps to look at the YoY change. Note: Months-of-supply is based on the seasonally adjusted sales and not seasonally adjusted inventory.
 Inventory was up 15.3% year-over-year (blue) in January compared to January 2022.
 Months of supply (red) was unchanged at 2.9 months in January from 2.9 months in December.
This was below the consensus forecast. I'll have more later.
CoreLogic: "US Annual Rent Price Growth Dropped by Nearly Half in December"
by Calculated Risk on 2/21/2023 08:24:00 AM
CoreLogic: US Annual Rent Price Growth Dropped by Nearly Half in December
Rent price gains declined in December for the eighth straight month on an annual basis, but the 6.4% national increase remained higher than pre-pandemic levels. ...
“U.S. single-family rental price growth closed out 2022 at about half of what it was one year ago,” said Molly Boesel, principal economist at CoreLogic. “However, while rent growth has been slowing, it still rose at more than double the pre-pandemic rate. Rental price gains began increasing near the end of 2020 and have risen by about an average of $300 in the past two years. Annual single-family rent growth is projected to slow throughout 2023, but it will likely not decline by enough to wipe out gains from the past two years.”
emphasis added
 Click on graph for larger image.
This graph from CoreLogic shows the year-over-year change in rents for several price tiers.
This index was reported to be up 6.4% YoY in December, after rising 7.5% YoY in November and 8.8% YoY in October.
Monday, February 20, 2023
Tuesday: Existing Home Sales
by Calculated Risk on 2/20/2023 06:21:00 PM
Weekend:
• Schedule for Week of February 19, 2023
Tuesday:
• At 10:00 AM ET, Existing Home Sales for January from the National Association of Realtors (NAR). The consensus is for 4.10 million SAAR, up from 4.02 million.
From CNBC: Pre-Market Data and Bloomberg futures S&P 500 futures are down 10 and DOW futures are down 85 (fair value).
Oil prices were up over the last week with WTI futures at $77.13 per barrel and Brent at $83.90 per barrel. A year ago, WTI was at $91, and Brent was at $99 - so WTI oil prices are DOWN 15% year-over-year.
Here is a graph from Gasbuddy.com for nationwide gasoline prices. Nationally prices are at $3.36 per gallon. A year ago, prices were at $3.48 per gallon, so gasoline prices are down $0.12 per gallon year-over-year.
Fannie "Real Estate Owned" inventory increased in Q4; Expected to increase further in 2023
by Calculated Risk on 2/20/2023 01:37:00 PM
Fannie reported results for Q4 2022. Here is some information on single-family Real Estate Owned (REOs).
First, a note on the pandemic from Fannie:
"In response to the COVID-19 pandemic, a number of legislative and executive actions were taken by the federal government and state and local governments to assist affected borrowers and renters and to slow the spread of the pandemic, including actions that applied to the loans we guarantee. While most of these actions are no longer in effect, the COVID-19 national emergency remains in place. In January 2023, the Administration announced it intends to extend the COVID-19 national emergency to May 11, 2023, and end the emergency on that date. We continue to offer forbearance relief and other home retention solutions to borrowers affected by the COVID-19 pandemic ..."
emphasis added
One of those actions was a foreclosure moratorium that ended in mid-2021. Since then, foreclosures have increased slightly.
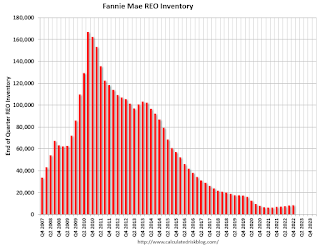
Fannie Mae reported the number of REOs increased to 8,779 at the end of Q4 2022, up 23% from 7,166 at the end of Q4 2021. For Fannie, this is down 95% from the 166,787 peak number of REOs in Q3 2010.
 Click on graph for larger image.
Here is a graph of Fannie Real Estate Owned (REO).
This is well below a normal level of REOs for Fannie, and REO levels will increase further in 2023, but there will not be a huge wave of foreclosures.
 Click on graph for larger image.
Here is a graph of Fannie Real Estate Owned (REO).
This is well below a normal level of REOs for Fannie, and REO levels will increase further in 2023, but there will not be a huge wave of foreclosures.
First time ever more "Built-for-Rent" Units started Quarterly than "Built-for-Sale"
by Calculated Risk on 2/20/2023 10:37:00 AM
Today, in the Calculated Risk Real Estate Newsletter: First time ever more "Built-for-Rent" Units started Quarterly than "Built-for-Sale"
A brief excerpt:
Along with the monthly housing starts report for January last week, the Census Bureau released Housing Units Started by Purpose and Design through Q4 2022.There is much more in the article. You can subscribe at https://calculatedrisk.substack.com/
This graph shows the NSA quarterly intent for four start categories since 1975: single family built for sale, owner built (includes contractor built for owner), starts built for rent, and multi-family built for sale.Single family starts built for sale (red) were down 34% in Q4 2022 compared to Q4 2021. And owner built starts (orange) were down 10% year-over-year.
Multi-family built for sale decreased and are still low.The 'units built for rent' (blue) and were up 15% in Q4 2022 compared to Q4 2021. For the first time since this series started in 1974, there were more units built-for-rent started in Q4 2022 than single family units built-for-sale started.

Housing February 20th Weekly Update: Inventory Decreased 1.5% Week-over-week
by Calculated Risk on 2/20/2023 08:32:00 AM
Altos reports that active single-family inventory was down 1.5% week-over-week. Usually inventory bottoms in early February, so we'd expect inventory to bottom seasonally soon.
Here are the same week inventory changes for the last five years:
2023: -6.9K
2022: -1.8K
2021: -10.5K
2020: +4.6K
2019: +6.7K
 Click on graph for larger image.
This inventory graph is courtesy of Altos Research.
As of February 17th, inventory was at 437 thousand (7-day average), compared to 443 thousand the prior week.

The red line is for 2023. The black line is for 2019. Note that inventory is up from the previous two years (the record low was in 2022), but still well below normal levels.
Inventory was up 76.4% compared to the same week in 2022 (last week it was up 78.0%), and down 46.7% compared to the same week in 2019 (last week down 45.4%).
A key will be when inventory starts increasing in 2023 - so far inventory has declined about 11.1% over the first seven weeks of 2023.
Mike Simonsen discusses this data regularly on Youtube.
Sunday, February 19, 2023
LA Port Inbound Traffic Down 22% YoY in January
by Calculated Risk on 2/19/2023 08:30:00 PM
Notes: The expansion to the Panama Canal was completed in 2016 (As I noted several years ago), and some of the traffic that used the ports of Los Angeles and Long Beach is probably going through the canal. This might be impacting TEUs on the West Coast.
Container traffic gives us an idea about the volume of goods being exported and imported - and usually some hints about the trade report since LA area ports handle about 40% of the nation's container port traffic.
The following graphs are for inbound and outbound traffic at the ports of Los Angeles and Long Beach in TEUs (TEUs: 20-foot equivalent units or 20-foot-long cargo container).
To remove the strong seasonal component for inbound traffic, the first graph shows the rolling 12-month average.
 Click on graph for larger image.
On a rolling 12-month basis, inbound traffic decreased 1.9% in January compared to the rolling 12 months ending in December. Outbound traffic decreased 0.6% compared to the rolling 12 months ending the previous month.
The 2nd graph is the monthly data (with a strong seasonal pattern for imports).
 Usually imports peak in the July to October period as retailers import goods for the Christmas holiday, and then decline sharply and bottom in February or March depending on the timing of the Chinese New Year.
 Usually imports peak in the July to October period as retailers import goods for the Christmas holiday, and then decline sharply and bottom in February or March depending on the timing of the Chinese New Year.
Imports were down 22% YoY in January, and exports were down 7% YoY.
It is possible that exports have bottomed after declining for several years (even prior to the pandemic).
Existing Home Sales: Lawler vs. the Consensus
by Calculated Risk on 2/19/2023 12:14:00 PM
Housing economist Tom Lawler has been sending me his predictions of what the NAR will report for almost 13 years. He has graciously allowed me to share his predictions with the readers of this blog.
The table below shows the consensus for each month, Lawler's predictions, and the NAR's initially reported level of sales. Lawler hasn't always been closer than the consensus, but usually when there has been a fairly large spread between Lawler's estimate and the "consensus", Lawler has been closer.
The NAR is scheduled to release Existing Home Sales for January on Tuesday at 10:00 AM, February 21st. The consensus is for 4.10 million SAAR in January. Tom Lawler estimates the NAR will report sales of 4.18 million SAAR.
Take the OVER this month!
Over the last 12+ years, the consensus average miss was 144 thousand (median 110 thousand), and Lawler's average miss was 72 thousand (median 60 thousand).
Over the last 12+ years, the consensus average miss was 144 thousand (median 110 thousand), and Lawler's average miss was 72 thousand (median 60 thousand).
Note on Median Prices: Lawler has also been very close on median prices, and he expects the NAR to report prices up "about 2.4% from last January".
| Existing Home Sales, Forecasts and NAR Report millions, seasonally adjusted annual rate basis (SAAR) | |||
|---|---|---|---|
| Month | Consensus | Lawler | NAR reported1 |
| May-10 | 6.20 | 5.83 | 5.66 |
| Jun-10 | 5.30 | 5.30 | 5.37 |
| Jul-10 | 4.66 | 3.95 | 3.83 |
| Aug-10 | 4.10 | 4.10 | 4.13 |
| Sep-10 | 4.30 | 4.50 | 4.53 |
| Oct-10 | 4.50 | 4.46 | 4.43 |
| Nov-10 | 4.85 | 4.61 | 4.68 |
| Dec-10 | 4.90 | 5.13 | 5.28 |
| Jan-11 | 5.20 | 5.17 | 5.36 |
| Feb-11 | 5.15 | 5.00 | 4.88 |
| Mar-11 | 5.00 | 5.08 | 5.10 |
| Apr-11 | 5.20 | 5.15 | 5.05 |
| May-11 | 4.75 | 4.80 | 4.81 |
| Jun-11 | 4.90 | 4.71 | 4.77 |
| Jul-11 | 4.92 | 4.69 | 4.67 |
| Aug-11 | 4.75 | 4.92 | 5.03 |
| Sep-11 | 4.93 | 4.83 | 4.91 |
| Oct-11 | 4.80 | 4.86 | 4.97 |
| Nov-11 | 5.08 | 4.40 | 4.42 |
| Dec-11 | 4.60 | 4.64 | 4.61 |
| Jan-12 | 4.69 | 4.66 | 4.57 |
| Feb-12 | 4.61 | 4.63 | 4.59 |
| Mar-12 | 4.62 | 4.59 | 4.48 |
| Apr-12 | 4.66 | 4.53 | 4.62 |
| May-12 | 4.57 | 4.66 | 4.55 |
| Jun-12 | 4.65 | 4.56 | 4.37 |
| Jul-12 | 4.50 | 4.47 | 4.47 |
| Aug-12 | 4.55 | 4.87 | 4.82 |
| Sep-12 | 4.75 | 4.70 | 4.75 |
| Oct-12 | 4.74 | 4.84 | 4.79 |
| Nov-12 | 4.90 | 5.10 | 5.04 |
| Dec-12 | 5.10 | 4.97 | 4.94 |
| Jan-13 | 4.90 | 4.94 | 4.92 |
| Feb-13 | 5.01 | 4.87 | 4.98 |
| Mar-13 | 5.03 | 4.89 | 4.92 |
| Apr-13 | 4.92 | 5.03 | 4.97 |
| May-13 | 5.00 | 5.20 | 5.18 |
| Jun-13 | 5.27 | 4.99 | 5.08 |
| Jul-13 | 5.13 | 5.33 | 5.39 |
| Aug-13 | 5.25 | 5.35 | 5.48 |
| Sep-13 | 5.30 | 5.26 | 5.29 |
| Oct-13 | 5.13 | 5.08 | 5.12 |
| Nov-13 | 5.02 | 4.98 | 4.90 |
| Dec-13 | 4.90 | 4.96 | 4.87 |
| Jan-14 | 4.70 | 4.67 | 4.62 |
| Feb-14 | 4.64 | 4.60 | 4.60 |
| Mar-14 | 4.56 | 4.64 | 4.59 |
| Apr-14 | 4.67 | 4.70 | 4.65 |
| May-14 | 4.75 | 4.81 | 4.89 |
| Jun-14 | 4.99 | 4.96 | 5.04 |
| Jul-14 | 5.00 | 5.09 | 5.15 |
| Aug-14 | 5.18 | 5.12 | 5.05 |
| Sep-14 | 5.09 | 5.14 | 5.17 |
| Oct-14 | 5.15 | 5.28 | 5.26 |
| Nov-14 | 5.20 | 4.90 | 4.93 |
| Dec-14 | 5.05 | 5.15 | 5.04 |
| Jan-15 | 5.00 | 4.90 | 4.82 |
| Feb-15 | 4.94 | 4.87 | 4.88 |
| Mar-15 | 5.04 | 5.18 | 5.19 |
| Apr-15 | 5.22 | 5.20 | 5.04 |
| May-15 | 5.25 | 5.29 | 5.35 |
| Jun-15 | 5.40 | 5.45 | 5.49 |
| Jul-15 | 5.41 | 5.64 | 5.59 |
| Aug-15 | 5.50 | 5.54 | 5.31 |
| Sep-15 | 5.35 | 5.56 | 5.55 |
| Oct-15 | 5.41 | 5.33 | 5.36 |
| Nov-15 | 5.32 | 4.97 | 4.76 |
| Dec-15 | 5.19 | 5.36 | 5.46 |
| Jan-16 | 5.32 | 5.36 | 5.47 |
| Feb-16 | 5.30 | 5.20 | 5.08 |
| Mar-16 | 5.27 | 5.27 | 5.33 |
| Apr-16 | 5.40 | 5.44 | 5.45 |
| May-16 | 5.64 | 5.55 | 5.53 |
| Jun-16 | 5.48 | 5.62 | 5.57 |
| Jul-16 | 5.52 | 5.41 | 5.39 |
| Aug-16 | 5.44 | 5.49 | 5.33 |
| Sep-16 | 5.35 | 5.55 | 5.47 |
| Oct-16 | 5.44 | 5.47 | 5.60 |
| Nov-16 | 5.54 | 5.60 | 5.61 |
| Dec-16 | 5.54 | 5.55 | 5.49 |
| Jan-17 | 5.55 | 5.60 | 5.69 |
| Feb-17 | 5.55 | 5.41 | 5.48 |
| Mar-17 | 5.61 | 5.74 | 5.71 |
| Apr-17 | 5.67 | 5.56 | 5.57 |
| May-17 | 5.55 | 5.65 | 5.62 |
| Jun-17 | 5.58 | 5.59 | 5.52 |
| Jul-17 | 5.57 | 5.38 | 5.44 |
| Aug-17 | 5.48 | 5.39 | 5.35 |
| Sep-17 | 5.30 | 5.38 | 5.39 |
| Oct-17 | 5.30 | 5.60 | 5.48 |
| Nov-17 | 5.52 | 5.77 | 5.81 |
| Dec-17 | 5.75 | 5.66 | 5.57 |
| Jan-18 | 5.65 | 5.48 | 5.38 |
| Feb-18 | 5.42 | 5.44 | 5.54 |
| Mar-18 | 5.28 | 5.51 | 5.60 |
| Apr-18 | 5.60 | 5.48 | 5.46 |
| May-18 | 5.56 | 5.47 | 5.43 |
| Jun-18 | 5.45 | 5.35 | 5.38 |
| Jul-18 | 5.43 | 5.40 | 5.34 |
| Aug-18 | 5.36 | 5.36 | 5.34 |
| Sep-18 | 5.30 | 5.20 | 5.15 |
| Oct-18 | 5.20 | 5.31 | 5.22 |
| Nov-18 | 5.19 | 5.23 | 5.32 |
| Dec-18 | 5.24 | 4.97 | 4.99 |
| Jan-19 | 5.05 | 4.92 | 4.94 |
| Feb-19 | 5.08 | 5.46 | 5.51 |
| Mar-19 | 5.30 | 5.40 | 5.21 |
| Apr-19 | 5.36 | 5.31 | 5.19 |
| May-19 | 5.29 | 5.40 | 5.34 |
| Jun-19 | 5.34 | 5.25 | 5.27 |
| Jul-19 | 5.39 | 5.40 | 5.42 |
| Aug-19 | 5.38 | 5.42 | 5.49 |
| Sep-19 | 5.45 | 5.36 | 5.38 |
| Oct-19 | 5.49 | 5.36 | 5.46 |
| Nov-19 | 5.45 | 5.43 | 5.35 |
| Dec-19 | 5.43 | 5.40 | 5.54 |
| Jan-20 | 5.45 | 5.42 | 5.46 |
| Feb-20 | 5.50 | 5.58 | 5.77 |
| Mar-20 | 5.30 | 5.25 | 5.27 |
| Apr-20 | 4.30 | 4.17 | 4.33 |
| May-20 | 4.38 | 3.80 | 3.91 |
| Jun-20 | 4.86 | 4.65 | 4.72 |
| Jul-20 | 5.39 | 5.85 | 5.86 |
| Aug-20 | 6.00 | 5.92 | 6.00 |
| Sep-20 | 6.25 | 6.38 | 6.54 |
| Oct-20 | 6.45 | 6.63 | 6.85 |
| Nov-20 | 6.70 | 6.50 | 6.69 |
| Dec-20 | 6.55 | 6.62 | 6.76 |
| Jan-21 | 6.60 | 6.48 | 6.69 |
| Feb-21 | 6.51 | 6.29 | 6.22 |
| Mar-21 | 6.17 | 6.02 | 6.01 |
| Apr-21 | 6.09 | 5.96 | 5.85 |
| May-21 | 5.74 | 5.78 | 5.80 |
| Jun-21 | 5.90 | 5.79 | 5.86 |
| Jul-21 | 5.84 | 5.86 | 5.99 |
| Aug-21 | 5.88 | 5.90 | 5.88 |
| Sep-21 | 6.06 | 6.20 | 6.29 |
| Oct-21 | 6.20 | 6.34 | 6.34 |
| Nov-21 | 6.20 | 6.45 | 6.46 |
| Dec-21 | 6.45 | 6.33 | 6.18 |
| Jan-22 | 6.12 | 6.36 | 6.50 |
| Feb-22 | 6.16 | 5.97 | 6.02 |
| Mar-22 | 5.80 | 5.74 | 5.77 |
| Apr-22 | 5.62 | 5.57 | 5.61 |
| May-22 | 5.41 | 5.35 | 5.41 |
| Jun-22 | 5.40 | 5.12 | 5.12 |
| Jul-22 | 4.88 | 4.90 | 4.81 |
| Aug-22 | 4.70 | 4.84 | 4.80 |
| Sep-22 | 4.69 | 4.82 | 4.71 |
| Oct-22 | 4.39 | 4.49 | 4.43 |
| Nov-22 | 4.20 | 4.16 | 4.09 |
| Dec-22 | 3.95 | 3.96 | 4.02 |
| Jan-22 | 4.10 | 4.18 | NA |
| 1NAR initially reported before revisions. | |||
Saturday, February 18, 2023
Real Estate Newsletter Articles this Week: "Near Record Number of Housing Units Under Construction"
by Calculated Risk on 2/18/2023 02:11:00 PM
At the Calculated Risk Real Estate Newsletter this week:
• 3rd Look at Local Housing Markets in January Lawler: Early Read on Existing Home Sales in January
• January Housing Starts: Near Record Number of Housing Units Under Construction
• Current State of the Housing Market: Overview for mid-February
• Update: Some "Good News" for Homebuilders
• 2nd Look at Local Housing Markets in January
This is usually published 4 to 6 times a week and provides more in-depth analysis of the housing market.
You can subscribe at https://calculatedrisk.substack.com/
Most content is available for free (and no Ads), but please subscribe!


