 RSS Feed
 by Calculated Risk on 2/23/2023 08:34:00 AM
Thursday, February 23, 2023
Weekly Initial Unemployment Claims decrease to 192,000
The DOL reported:
In the week ending February 18, the advance figure for seasonally adjusted initial claims was 192,000, a decrease of 3,000 from the previous week's revised level. The previous week's level was revised up by 1,000 from 194,000 to 195,000. The 4-week moving average was 191,250, an increase of 1,500 from the previous week's revised average. The previous week's average was revised up by 250 from 189,500 to 189,750.The following graph shows the 4-week moving average of weekly claims since 1971.
emphasis added
 Click on graph for larger image.
The dashed line on the graph is the current 4-week average. The four-week average of weekly unemployment claims increased to 191,250.
The previous week was revised up.
Weekly claims were below the consensus forecast.
Wednesday, February 22, 2023
Thursday: GDP, Unemployment Claims
by Calculated Risk on 2/22/2023 09:01:00 PM
 Note: Mortgage rates are from MortgageNewsDaily.com and are for top tier scenarios.
Thursday:
• At 8:30 AM ET, The initial weekly unemployment claims report will be released. The consensus is for 200 thousand initial claims, up from 194 thousand last week.
• Also at 8:30 AM, Gross Domestic Product, 4th quarter 2022 (Second estimate). The consensus is that real GDP increased 2.9% annualized in Q4, unchanged from the advance estimate of 2.9%.
• Alsot at 8:30 AM, Chicago Fed National Activity Index for January. This is a composite index of other data.
• At 11:00 AM, the Kansas City Fed manufacturing survey for February.
Vehicle Sales Forecast: Vehicle Sales to be up Year-over-year in February
by Calculated Risk on 2/22/2023 05:38:00 PM
From WardsAuto: U.S. Light-Vehicle Sales, Inventory Continue Upward Climb in February (pay content). Brief excerpt:
With inventory expected to record big gains by the end of the first quarter, consumers could be on the verge of seeing an easing up in pricing through a combination of greater availability of more affordable vehicles and increased incentives, especially when the industry gets into the spring selling season.
emphasis added
 Click on graph for larger image.
This graph shows actual sales from the BEA (Blue), and Wards forecast for February (Red).
The Wards forecast of 14.6 million SAAR, would be down 7% from last month, and up 6.5% from a year ago.
Vehicle sales are usually a transmission mechanism for Federal Open Market Committee (FOMC) policy, far behind housing. This time vehicle sales have been more suppressed by supply chain issues but have picked up recently.
FOMC Minutes: All participants continued to anticipate ongoing rate increases
by Calculated Risk on 2/22/2023 03:20:00 PM
From the Fed: Minutes of the Federal Open Market Committee, January 31–February 1, 2023. Excerpt:
In their consideration of appropriate monetary policy actions at this meeting, participants concurred that the Committee had made significant progress over the past year in moving toward a sufficiently restrictive stance of monetary policy. Even so, participants agreed that, while there were recent signs that the cumulative effect of the Committee's tightening of the stance of monetary policy had begun to moderate inflationary pressures, inflation remained well above the Committee's longer-run goal of 2 percent and the labor market remained very tight, contributing to continuing upward pressures on wages and prices. Against this backdrop, and in consideration of the lags with which monetary policy affects economic activity and inflation, almost all participants agreed that it was appropriate to raise the target range for the federal funds rate 25 basis points at this meeting. Many of these participants observed that a further slowing in the pace of rate increases would better allow them to assess the economy's progress toward the Committee's goals of maximum employment and price stability as they determine the extent of future policy tightening that will be required to attain a stance that is sufficiently restrictive to achieve these goals. A few participants stated that they favored raising the target range for the federal funds rate 50 basis points at this meeting or that they could have supported raising the target by that amount. The participants favoring a 50-basis point increase noted that a larger increase would more quickly bring the target range close to the levels they believed would achieve a sufficiently restrictive stance, taking into account their views of the risks to achieving price stability in a timely way. All participants agreed that it was appropriate to continue the process of reducing the Federal Reserve's securities holdings, as described in its previously announced Plans for Reducing the Size of the Federal Reserve's Balance Sheet.
In discussing the policy outlook, with inflation still well above the Committee's 2 percent goal and the labor market remaining very tight, all participants continued to anticipate that ongoing increases in the target range for the federal funds rate would be appropriate to achieve the Committee's objectives. Participants affirmed their strong commitment to returning inflation to the Committee's 2 percent objective. In determining the extent of future increases in the target range, participants judged that it would be appropriate to take into account the cumulative tightening of monetary policy, the lags with which monetary policy affects economic activity and inflation, and economic and financial developments. Participants observed that a restrictive policy stance would need to be maintained until the incoming data provided confidence that inflation was on a sustained downward path to 2 percent, which was likely to take some time.
emphasis added
AIA: Architecture Billings "Continue to Contract" in January
by Calculated Risk on 2/22/2023 12:00:00 PM
Note: This index is a leading indicator primarily for new Commercial Real Estate (CRE) investment.
From the AIA: Architectural billings continue to contract in 2023
Fewer architecture firms report declining billings in January compared to billing activity in December, according to a new report today from The American Institute of Architects (AIA).
AIA’s Architecture Billings Index (ABI) score for January was 49.3* compared to 48.4 in December (any score below 50 indicates a decline in firm billings). Last month’s score indicates overall revenue at U.S architecture firms continued to decline from December to January, however, the pace of decline slowed. Inquiries into new projects during January grew, with a score of 55.2 compared to 52.6 in December. The value of new design contracts also reflected an easing in the pace of decline, rising to a score of 53.4 in January from 50.0 the previous month.
“While the downturn in design activity extended to four months in January, there are signs of easing,” said AIA Chief Economist, Kermit Baker, Hon. AIA, PhD. “In particular, architecture firms reported that new project work has begun to increase, signifying that this decline in billings may reverse in the coming months.”
...
• Regional averages: Midwest (51.6); West (51.3); Northeast (50.9); South (46.9)
• Sector index breakdown: mixed practice (56.0); institutional (48.6); commercial/industrial (46.8); multi-family residential (45.9)
*Every January the AIA research department updates the seasonal factors used to calculate the ABI, resulting in a revision of recent ABI values.
emphasis added
 Click on graph for larger image.
This graph shows the Architecture Billings Index since 1996. The index was at 49.3 in January, up from 48.4 in December. Anything below 50 indicates contraction in demand for architects' services.
Note: This includes commercial and industrial facilities like hotels and office buildings, multi-family residential, as well as schools, hospitals and other institutions.
This index had been positive for 20 consecutive months but indicated a decline the last four months. This index usually leads CRE investment by 9 to 12 months, so this index suggests a pickup in CRE investment in early 2023, but a slowdown in CRE investment later in 2023.
Note that multi-family billing turned down in September and has been negative for five consecutive months. This suggests we will see a downturn in multi-family starts this year (multi-family starts probably have already peaked).
Final Look at Local Housing Markets in January
by Calculated Risk on 2/22/2023 09:45:00 AM
Today, in the Calculated Risk Real Estate Newsletter: Final Look at Local Housing Markets in January
A brief excerpt:
The big story for January existing home sales was the sharp year-over-year (YoY) decline in sales. Also, active inventory increased sharply YoY, but is still historically low.There is much more in the article. You can subscribe at https://calculatedrisk.substack.com/
This is the final look at local markets in January. I’m tracking about 40 local housing markets in the US. Some of the 40 markets are states, and some are metropolitan areas. I update these tables throughout each month as additional data is released
First, here is a table comparing the year-over-year Not Seasonally Adjusted (NSA) declines in sales this year from the National Association of Realtors® (NAR) with the local markets I track. So far, these measures have tracked closely. The NAR reported sales were down 34.4% NSA YoY in January.
...
More local data coming in February for activity in January!
Important: Closed sales in January were mostly for contracts signed in November and December. Mortgage rates, according to the Freddie Mac PMMS, decreased to around 6.4% in December and 6.3% in January, so that will likely provide a small boost to closed sales in February.
My early expectation is we will see a somewhat smaller YoY sales decline in February, than in January, due to the decrease in mortgage rates in December and January.
However, in the 2nd half of February, mortgage rates have spiked again, and the MBA purchase index fell to the lowest level since 1995!

MBA: Mortgage Purchase Applications Decreased Sharply, Lowest Since 1995
by Calculated Risk on 2/22/2023 07:00:00 AM
From the MBA: Mortgage Applications Decrease in Latest MBA Weekly Survey
Mortgage applications decreased 13.3 percent from one week earlier, according to data from the Mortgage Bankers Association’s (MBA) Weekly Mortgage Applications Survey for the week ending February 17, 2023.
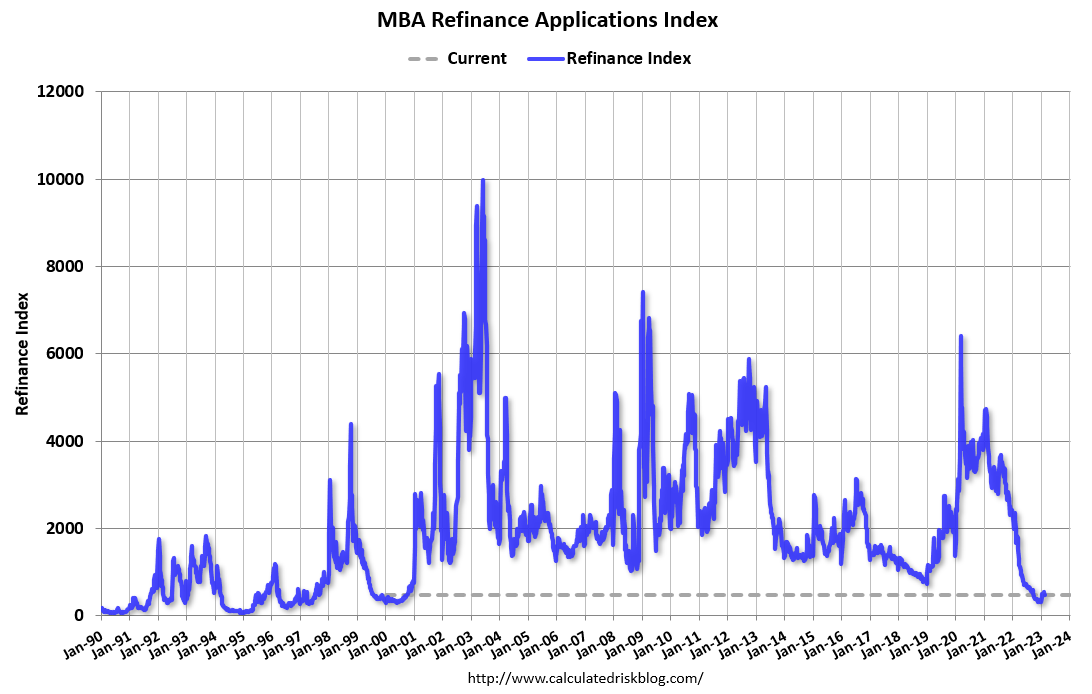
The Market Composite Index, a measure of mortgage loan application volume, decreased 13.3 percent on a seasonally adjusted basis from one week earlier. On an unadjusted basis, the Index decreased 4 percent compared with the previous week. The Refinance Index decreased 2 percent from the previous week and was 72 percent lower than the same week one year ago. The seasonally adjusted Purchase Index decreased 18 percent from one week earlier. The unadjusted Purchase Index decreased 4 percent compared with the previous week and was 41 percent lower than the same week one year ago.
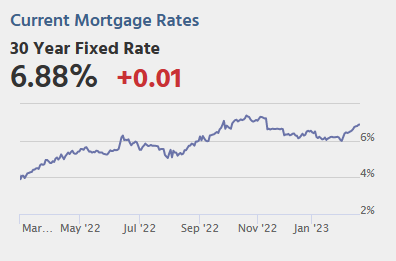
“Mortgage rates increased across all loan types last week, with the 30-year fixed rate jumping 23 basis points to 6.62 percent – the highest rate since November 2022. The jump led to the purchase applications index decreasing 18 percent to its lowest level since 1995,” said Joel Kan, MBA’s Vice President and Deputy Chief Economist. “This time of the year is typically when purchase activity ramps up, but over the past two weeks, rates have increased significantly as financial markets digest data on inflation cooling at a slower pace than expected. The increase in mortgages rates has put many homebuyers back on the sidelines once again, especially first-time homebuyers who are most sensitive to affordability challenges and the impact of higher rates.”
Added Kan, “Refinance applications declined last week and remained more than 70 percent behind last year’s pace. Given that rates are over 2.5 percentage points higher than a year ago, we expect that refinance activity will remain depressed for some time.”
emphasis added
 Click on graph for larger image.
The first graph shows the refinance index since 1990.
With higher mortgage rates, the refinance index declined sharply in 2022.
Other than the lows in Q4 of 2022 and early this year, the refinance index was at the lowest level since the year 2000.
The second graph shows the MBA mortgage purchase index.
 According to the MBA, purchase activity is down 41% year-over-year unadjusted.
 The purchase index is 19% below the pandemic low and at the lowest level since 1995!
Note: Red is a four-week average (blue is weekly).
Tuesday, February 21, 2023
Wednesday: FOMC Minutes
by Calculated Risk on 2/21/2023 08:24:00 PM
 Note: Mortgage rates are from MortgageNewsDaily.com and are for top tier scenarios.
Wednesday:
• At 7:00 AM ET, The Mortgage Bankers Association (MBA) will release the results for the mortgage purchase applications index.
• During the day, The AIA's Architecture Billings Index for January (a leading indicator for commercial real estate).
• At 2:00 PM, FOMC Minutes, Meeting of January 31-February 1, 2023
MBA Survey: "Share of Mortgage Loans in Forbearance Decreases to 0.64% in January"
by Calculated Risk on 2/21/2023 04:00:00 PM
Note: This is as of January 31st.
From the MBA: Share of Mortgage Loans in Forbearance Decreases to 0.64% in January
The Mortgage Bankers Association’s (MBA) monthly Loan Monitoring Survey revealed that the total number of loans now in forbearance decreased by 6 basis points from 0.70% of servicers’ portfolio volume in the prior month to 0.64% as of January 31, 2023. According to MBA’s estimate, 320,000 homeowners are in forbearance plans.
The share of Fannie Mae and Freddie Mac loans in forbearance decreased 1 basis point to 0.30%. Ginnie Mae loans in forbearance decreased 8 basis points to 1.37%, and the forbearance share for portfolio loans and private-label securities (PLS) decreased 17 basis points to 0.83%.
“The forbearance rate decreased across all investor types in January, as borrowers continued to recover from pandemic-related hardships,” said Marina Walsh, CMB, MBA’s Vice President of Industry Analysis. “With the national emergency set to end on May 11 of this year, many borrowers will no longer have the option to initiate COVID-19-related forbearance. Mortgage forbearance in other forms – whether due to natural disasters or life events – will continue, albeit with different requirements and parameters.
emphasis added
 Click on graph for larger image.
This graph shows the percent of portfolio in forbearance by investor type over time.
The share of forbearance plans has been generally decreasing.
At the end of January, there were about 320,000 homeowners in forbearance plans.
The Normal Seasonal Changes for Median House Prices
by Calculated Risk on 2/21/2023 02:17:00 PM
Earlier, in the CalculatedRisk Real Estate Newsletter on January existing home sales, NAR: Existing-Home Sales Decreased to 4.00 million SAAR in January, I mentioned that the median price was down more than normal seasonally.
Below is a table of the seasonal changes from annual peak to the following January over the last several years (all prices Not Seasonally Adjusted, NSA).
Seasonally prices typically peak in June (closed sales for contracts signed mostly in April and May).
And seasonally prices usually bottom the following January (contracts signed in November and December).
| 2018 | 2019 | 2020 | 2021 | 2022 | |
|---|---|---|---|---|---|
| Peak Month | June | June | Oct | June | June |
| To following Jan | -8.9% | -6.7% | -3.0% | -3.4% | -13.2% |
In 2020, prices increased late into the year and only declined slightly seasonally (the start of the pandemic buying boom), and in 2021, median prices only declined about 3% from peak to bottom.
But the decline from the 2022 peak to January 2023 of 13.2% is larger than in the pre-pandemic years. And we will probably see further price weaknesses, putting median prices down year-over-year soon.
Last year, closing median prices increased 2.7% in February, 4.3% in March, 4.3% in April and 3.3% in May, all NSA.
If median prices are up less than 1.3% month-to-month in February 2023, median prices will be down year-over-year!


