by Calculated Risk on 2/24/2023 12:59:00 PM
Friday, February 24, 2023
Q1 GDP Tracking: Close to 2%
From BofA:
Our GDP tracking estimate fell by two-tenths to 1.3% q/q saar since our last update [Feb 23rd estimate] (estimate before personal spending and New Home sales reports).From Goldman:
emphasis added
Following stronger-than-expected personal spending and new home sales in January, we boosted our Q1 GDP tracking estimate by 0.4pp to +1.8% (qoq ar) and our domestic final sales forecast by the same amount to +2.3%. [Feb 24th estimate]And from the Altanta Fed: GDPNow
The GDPNow model estimate for real GDP growth (seasonally adjusted annual rate) in the first quarter of 2023 is 2.7 percent on February 24, up from 2.5 percent on February 16. After recent releases from the US Census Bureau, the US Bureau of Economic Analysis, the US Bureau of Labor Statistics, and the National Association of Realtors, the nowcasts of first-quarter real personal consumption expenditures growth and first-quarter real gross private domestic investment growth increased from 3.6 percent and -6.0 percent, respectively, to 3.8 percent and -5.3 percent. [Feb 24th estimate]
New Home Sales Increase to 670,000 Annual Rate in January; New Home Average Prices Down 5.3% Year-over-year
by Calculated Risk on 2/24/2023 10:50:00 AM
Today, in the Calculated Risk Real Estate Newsletter: New Home Sales Increase to 670,000 Annual Rate in January
Brief excerpt:
And on prices, from the Census Bureau:You can subscribe at https://calculatedrisk.substack.com/.The median sales price of new houses sold in January 2023 was $427,500. The average sales price was $474,400.The following graph shows the median and average new home prices. The average price in January 2023 was $474,400 down 5.3% year-over-year. The median price was $427,500 down 0.7% year-over-year. This suggests a year-over-year decrease in prices, although both the median and the average are impacted by the mix of homes sold.
...
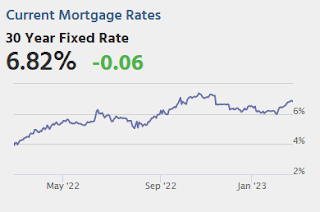
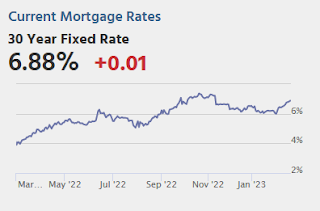
This was for contracts signed in January when mortgage rates were lower - and builders were buying down rates. Mortgage rates increased again in February, and that will likely impact sales.
As previously discussed, the Census Bureau overestimates sales, and underestimates inventory when cancellation rates are rising, see: New Home Sales and Cancellations: Net vs Gross Sales. So, take the headline sales number with a large grain of salt - the actual negative impact on the homebuilders is greater than the headline number suggests (until cancellations start declining)!
This will reverse when cancellation rates start declining. When a previously cancelled home is resold, the home builder counts it as a sale, but the Census Bureau does not (since it was already counted).
There are a large number of homes under construction, and this suggests we will see a further sharp increase in completed inventory over the next several months - and that will keep pressure on new home prices.
New Home Sales at 670,000 Annual Rate in January
by Calculated Risk on 2/24/2023 10:07:00 AM
The Census Bureau reports New Home Sales in January were at a seasonally adjusted annual rate (SAAR) of 670 thousand.
The previous three months were revised down, combined.
Sales of new single‐family houses in January 2023 were at a seasonally adjusted annual rate of 670,000, according to estimates released jointly today by the U.S. Census Bureau and the Department of Housing and Urban Development. This is 7.2 percent above the revised December rate of 625,000, but is 19.4 percent below the January 2022 estimate of 831,000.
emphasis added
 Click on graph for larger image.
The first graph shows New Home Sales vs. recessions since 1963. The dashed line is the current sales rate.
New home sales are close to pre-pandemic levels.
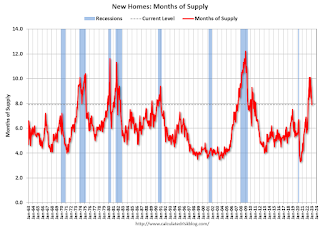
The second graph shows New Home Months of Supply.
 The months of supply decreased in January to 7.9 months from 8.7 months in December.
 The all-time record high was 12.1 months of supply in January 2009. The all-time record low was 3.5 months, most recently in October 2020.
This is well above the top of the normal range (about 4 to 6 months of supply is normal).
"The seasonally‐adjusted estimate of new houses for sale at the end of January was 439,000. This represents a supply of 7.9 months at the current sales rate."Sales were well above expectations of 620 thousand SAAR, however sales in the three previous months were revised down, combined. I'll have more later today.
Personal Income increased 0.6% in January; Spending increased 1.8%
by Calculated Risk on 2/24/2023 08:40:00 AM
The BEA released the Personal Income and Outlays report for January:
Personal income increased $131.1 billion (0.6 percent) in January, according to estimates released today by the Bureau of Economic Analysis. Disposable personal income (DPI) increased $387.4 billion (2.0 percent) and personal consumption expenditures (PCE) increased $312.5 billion (1.8 percent).The January PCE price index increased 5.4 percent year-over-year (YoY), up from 5.3 percent YoY in December, and down from the recent peak of 7.0 percent in June 2022.
The PCE price index increased 0.6 percent in January. Excluding food and energy, the PCE price index also increased 0.6 percent. Real DPI increased 1.4 percent and Real PCE increased 1.1 percent; goods increased 2.2 percent and services increased 0.6 percent.
emphasis added
The following graph shows real Personal Consumption Expenditures (PCE) through January 2023 (2012 dollars). Note that the y-axis doesn't start at zero to better show the change.
 Click on graph for larger image.
The dashed red lines are the quarterly levels for real PCE.
Personal income was below expectations, and the increase in PCE was above expectations.
Thursday, February 23, 2023
Friday: Personal Income & Outlays, New Home Sales
by Calculated Risk on 2/23/2023 08:47:00 PM

Friday:
• At 8:30 AM ET, Personal Income and Outlays for January. The consensus is for a 0.9% increase in personal income, and for a 1.3% increase in personal spending. And for the Core PCE price index to increase 0.4%. PCE prices are expected to be up 4.9% YoY, and core PCE prices up 4.3% YoY.
• At 10:00 AM, New Home Sales for January from the Census Bureau. The consensus is that new home sales increased to 620 thousand SAAR, down from 616 thousand in December.
• Also at 10:00 AM, University of Michigan's Consumer sentiment index (Final for February). The consensus is for a reading of 66.4.
Realtor.com Reports Weekly Active Inventory Up 67% YoY; New Listings Down 18% YoY
by Calculated Risk on 2/23/2023 02:57:00 PM
Realtor.com has monthly and weekly data on the existing home market. Here is their weekly report released today from economist Jiayi Xu: Weekly Housing Trends View — Data Week Ending Feb 18, 2023
• Active inventory growth continued to climb with for-sale homes up 67% above one year ago. Inventories of for-sale homes rose again, on par with the yearly gains we saw last week. With new listings declining, the growing number of homes for sale reflects still-low buyer interest amid high costs rather than an influx of sellers is driving this increase. Even after these huge gains, January data show that nationwide there are still more than 40% fewer homes for sale than were available pre-pandemic, helping to explain why neither sellers nor buyers feel particularly excited about this current housing market.
...
• New listings–a measure of sellers putting homes up for sale–were again down, this week by 18% from one year ago. . For 33 weeks now, fewer homeowners put their homes on the market for sale than at this time last year. After smaller declines in the first few weeks of the year, the gap has widened for a fourth week, indicating lower seller interest than we saw one year ago.
 Here is a graph of the year-over-year change in inventory according to realtor.com.
 Inventory is still up sharply year-over-year; however, the increase has slowed recently.
Hotels: Occupancy Rate Down 5.5% Compared to Same Week in 2019
by Calculated Risk on 2/23/2023 12:23:00 PM
U.S. hotel performance increased from the previous week, according to STR‘s latest data through Feb. 18.The following graph shows the seasonal pattern for the hotel occupancy rate using the four-week average.
Feb. 12-18, 2023 (percentage change from comparable week in 2019*):
• Occupancy: 60.8% (-5.5%)
• Average daily rate (ADR): $156.10 (+19.5%)
• Revenue per available room (RevPAR): $94.94 (+12.9%)
*Due to the pandemic impact, STR is measuring recovery against comparable time periods from 2019. Year-over-year comparisons will once again become standard after the first quarter.
emphasis added
 Click on graph for larger image.
The red line is for 2023, black is 2020, blue is the median, and dashed light blue is for 2022. Dashed purple is 2019 (STR is comparing to a strong year for hotels).
Q4 GDP Growth Revised Down to 2.7% Annual Rate
by Calculated Risk on 2/23/2023 08:42:00 AM
From the BEA: Gross Domestic Product, Fourth Quarter and Year 2022 (Second Estimate)
Real gross domestic product (GDP) increased at an annual rate of 2.7 percent in the fourth quarter of 2022, according to the "second" estimate released by the Bureau of Economic Analysis. In the third quarter, real GDP increased 3.2 percent.Here is a Comparison of Second and Advance Estimates. PCE growth was revised down from 2.1% to 1.4%. Residential investment was revised up from -26.7% to -25.9%.
The GDP estimate released today is based on more complete source data than were available for the "advance" estimate issued last month. In the advance estimate, the increase in real GDP was 2.9 percent. The updated estimates primarily reflected a downward revision to consumer spending that was partly offset by an upward revision to nonresidential fixed investment. Imports, which are a subtraction in the calculation of GDP, were revised up.
emphasis added
Weekly Initial Unemployment Claims decrease to 192,000
by Calculated Risk on 2/23/2023 08:34:00 AM
The DOL reported:
In the week ending February 18, the advance figure for seasonally adjusted initial claims was 192,000, a decrease of 3,000 from the previous week's revised level. The previous week's level was revised up by 1,000 from 194,000 to 195,000. The 4-week moving average was 191,250, an increase of 1,500 from the previous week's revised average. The previous week's average was revised up by 250 from 189,500 to 189,750.The following graph shows the 4-week moving average of weekly claims since 1971.
emphasis added
 Click on graph for larger image.
The dashed line on the graph is the current 4-week average. The four-week average of weekly unemployment claims increased to 191,250.
The previous week was revised up.
Weekly claims were below the consensus forecast.
Wednesday, February 22, 2023
Thursday: GDP, Unemployment Claims
by Calculated Risk on 2/22/2023 09:01:00 PM

Thursday:
• At 8:30 AM ET, The initial weekly unemployment claims report will be released. The consensus is for 200 thousand initial claims, up from 194 thousand last week.
• Also at 8:30 AM, Gross Domestic Product, 4th quarter 2022 (Second estimate). The consensus is that real GDP increased 2.9% annualized in Q4, unchanged from the advance estimate of 2.9%.
• Alsot at 8:30 AM, Chicago Fed National Activity Index for January. This is a composite index of other data.
• At 11:00 AM, the Kansas City Fed manufacturing survey for February.


