 RSS Feed
 by Calculated Risk on 2/27/2023 09:01:00 PM
Monday, February 27, 2023
Tuesday: Case-Shiller House Prices
 From Matthew Graham at Mortgage News Daily: Mortgage Rates a Bit Lower to Begin The Week
Mortgage rates began the new week on a modestly positive note. The average lender is now quoting conventional 30yr fixed loans at a slightly lower rate than last Friday afternoon.Tuesday:
That said, the changes are modest, to say the least. Some borrowers won't see any detectable difference from last week's rates. Others might see an eighth of a percent lower at best.
Even in those best cases, rates remain much higher than they were to begin the month with the average lender moving up from 5.99% to 6.78% since February 2nd. [30 year fixed 6.78%]
emphasis added
• At 9:00 AM ET, FHFA House Price Index for December 2022. This was originally a GSE only repeat sales, however there is also an expanded index.
• Also, at 9:00 AM, S&P/Case-Shiller House Price Index for December. The consensus is for a 6.0% year-over-year increase in the Comp 20 index for December, down from 6.8% in November.
• At 10:00 AM, Richmond Fed Survey of Manufacturing Activity for February.
Lawler: AMH Net Seller of Existing Single-Family Homes, “Investor” Home Purchases Plunged
by Calculated Risk on 2/27/2023 04:57:00 PM
Today, in the Calculated Risk Real Estate Newsletter: Lawler: AMH Net Seller of Existing Single-Family Homes, “Investor” Home Purchases Plunged
Brief excerpt:
Some interesting data from housing economist Tom Lawler:There is much more in the post. You can subscribe at https://calculatedrisk.substack.com/.
AMH Net Seller of Existing Single-Family Homes Last Quarter
AMH (American Homes 4 Rent), which rents single-family homes and which owned almost 59,000 single-family homes at the end of last year, reported that it was a net seller of existing single-family homes last quarter. The company acquired 489 homes last quarter, but 415 of those homes were “deliveries” from its own build-to-rent program, and “most” of the remaining 74 homes were acquired under its National Builder Program. The company sold 457 homes last quarter, well above the average quarterly sales of 161 in the previous four quarters. The company also increased its inventory of single-family homes held for sale to 1,115 in December from 1,057 in September and 659 in December 2021, and company officials suggested that additional home sales were likely this quarter.

Freddie Mac Mortgage Serious Delinquency Rate unchanged in January; Fannie Mae Decreased Slightly
by Calculated Risk on 2/27/2023 04:42:00 PM
Freddie Mac reported that the Single-Family serious delinquency rate in January was 0.66%, unchanged from 0.66% December. Freddie's rate is down year-over-year from 1.06% in January 2022.
Freddie's serious delinquency rate peaked in February 2010 at 4.20% following the housing bubble and peaked at 3.17% in August 2020 during the pandemic.
Fannie Mae reported that the Single-Family Serious Delinquency decreased to 0.64% in January from 0.65% in December. The serious delinquency rate is down from 1.17% in January 2022. This is at the pre-pandemic lows.
The Fannie Mae serious delinquency rate peaked in February 2010 at 5.59% following the housing bubble and peaked at 3.32% in August 2020 during the pandemic.
These are mortgage loans that are "three monthly payments or more past due or in foreclosure".
 Click on graph for larger image
Mortgages in forbearance are being counted as delinquent in this monthly report but are not reported to the credit bureaus.
For Freddie, note that multi-family delinquencies have been increased slightly and were at 0.12% in January, up from 0.07% in January 2022.
For loans made in 2005 through 2008 (1% of portfolio), 3.40% are seriously delinquent (down from 3.49%).
For recent loans, originated in 2009 through 2021 (98% of portfolio), 0.52% are seriously delinquent (down from 0.53%). So, Fannie is still working through a handful of poor performing loans from the bubble years.
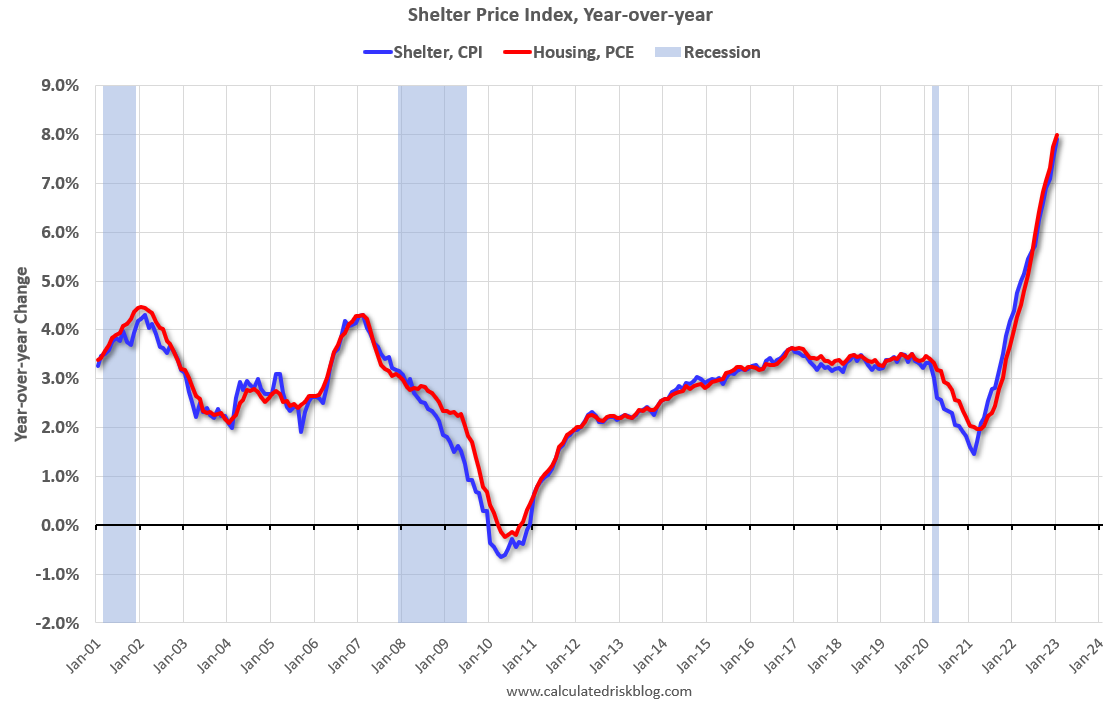
Measures of Shelter in the CPI and PCE price indexes Still Increasing
by Calculated Risk on 2/27/2023 12:15:00 PM
Today, in the Calculated Risk Real Estate Newsletter: Measures of Shelter in the CPI and PCE price indexes Still Increasing
Brief excerpt:
While asking rents are falling, the measures of shelter in the CPI and PCE price indexes keep rising. This is because these measures include renewals, whereas the various private measures of monthly rents are for new leases.You can subscribe at https://calculatedrisk.substack.com/.
Here is a graph of the year-over-year change in shelter from the CPI report and housing from the PCE report (both through January 2023):.
Shelter was up 7.9% year-over-year in January, and housing (PCE) was up 8.0% YoY in January.
However, there is more impacting rents than the normal lag between new leases and renewals.
NAR: Pending Home Sales Increased 8.1% in January; Down 24.1% Year-over-year
by Calculated Risk on 2/27/2023 10:05:00 AM
From the NAR: Pending Home Sales Improved for Second Straight Month, Up 8.1% in January
Pending home sales improved in January for the second consecutive month, according to the National Association of REALTORS®. All four U.S. regions posted monthly gains but saw year-over-year drops in transactions.Expectations had been for a 1.0% increase for this index. Note: Contract signings usually lead sales by about 45 to 60 days, so this would usually be for closed sales in February and March.
The Pending Home Sales Index (PHSI) — a forward-looking indicator of home sales based on contract signings — improved 8.1% to 82.5 in January. Year-over-year, pending transactions dropped by 24.1%. An index of 100 is equal to the level of contract activity in 2001.
“Buyers responded to better affordability from falling mortgage rates in December and January,” said NAR Chief Economist Lawrence Yun.
...
The Northeast PHSI rose 6.0% from last month to 68.7, a decline of 19.8% from January 2022. The Midwest index grew 7.9% to 83.3 in January, a drop of 21.1% from one year ago.
The South PHSI increased 8.3% to 99.2 in January, dipping 24.7% from the prior year. The West index elevated 10.1% in January to 66.2, diminishing 29.3% from January 2022.
emphasis added
Housing February 27th Weekly Update: Inventory Decreased 1.6% Week-over-week
by Calculated Risk on 2/27/2023 08:34:00 AM
Altos reports that active single-family inventory was down 1.6% week-over-week. Usually inventory bottoms in early February, so we'd expect inventory to bottom seasonally soon.
Here are the same week inventory changes for the last five years:
2023: -6.8K
2022: -3.5K
2021: -7.5K
2020: -3.8K
2019: +0.5K
 Click on graph for larger image.
This inventory graph is courtesy of Altos Research.
As of February 24th, inventory was at 430 thousand (7-day average), compared to 437 thousand the prior week.

The red line is for 2023. The black line is for 2019. Note that inventory is up from the previous two years (the record low was in 2022), but still well below normal levels.
Inventory was up 76.2% compared to the same week in 2022 (last week it was up 76.4%), and down 47.5% compared to the same week in 2019 (last week down 46.7%).
A key will be when inventory starts increasing in 2023 - so far inventory has declined about 12.4% over the first eight weeks of 2023.
Mike Simonsen discusses this data regularly on Youtube.
Sunday, February 26, 2023
Monday: Pending Home Sales, Durable Goods
by Calculated Risk on 2/26/2023 06:23:00 PM
Weekend:
• Schedule for Week of February 26, 2023
Monday:
• At 8:30 AM ET, Durable Goods Orders for January from the Census Bureau. The consensus is for a 4.0% decrease in durable goods orders.
• At 10:00 AM, Pending Home Sales Index for January. The consensus is for a 1.0% increase in the index.
• At 10:30 AM, Dallas Fed Survey of Manufacturing Activity for February.
From CNBC: Pre-Market Data and Bloomberg futures S&P 500 and DOW futures are down (fair value).
Oil prices were down over the last week with WTI futures at $76.32 per barrel and Brent at $83.16 per barrel. A year ago, WTI was at $92, and Brent was at $101 - so WTI oil prices are DOWN 17% year-over-year.
Here is a graph from Gasbuddy.com for nationwide gasoline prices. Nationally prices are at $3.32 per gallon. A year ago, prices were at $3.59 per gallon, so gasoline prices are down $0.27 per gallon year-over-year.
High Frequency Indicators: Airlines Back to Pre-Pandemic Levels, Movie Tickets Still Down
by Calculated Risk on 2/26/2023 11:24:00 AM
I stopped the weekly updates of high frequency indicators at the end of 2022. Here is a look at two indicators that were still below pre-recession levels as of last December.
The TSA is providing daily travel numbers.
This data is as of February 24th.
 Click on graph for larger image.
This data shows the 7-day average of daily total traveler throughput from the TSA for 2019 (Light Blue), 2020 (Black), 2021 (Blue), 2022 (Orange) and 2023 (Red).
The dashed line is the percent of 2019 for the seven-day average.
The 7-day average is at the same level as the same week in 2019 (99.7% of 2019). (Dashed line)
Air travel - as a percent of 2019 - is back to pre-pandemic levels.
----- Movie Tickets: Box Office Mojo -----
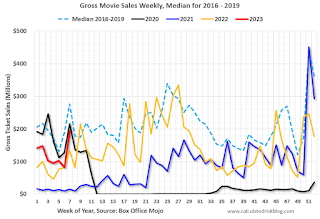 This data shows domestic box office for each week and the median for the years 2016 through 2019 (dashed light blue).
 This data shows domestic box office for each week and the median for the years 2016 through 2019 (dashed light blue).
 Black is 2020, Blue is 2021, Orange is 2022 and Red is 2023.
The data is from BoxOfficeMojo through February 23rd.
Note that the data is usually noisy week-to-week and depends on when blockbusters are released.
Movie ticket sales are running about 30% below the pre-pandemic levels.
Note that the data is usually noisy week-to-week and depends on when blockbusters are released.
Movie ticket sales are running about 30% below the pre-pandemic levels.
Saturday, February 25, 2023
Real Estate Newsletter Articles this Week: "New Home Average Prices Down 5.3% Year-over-year"
by Calculated Risk on 2/25/2023 02:11:00 PM
At the Calculated Risk Real Estate Newsletter this week:
• New Home Sales Increase to 670,000 Annual Rate in January New Home Average Prices Down 5.3% Year-over-year
• NAR: Existing-Home Sales Decreased to 4.00 million SAAR in January
• Final Look at Local Housing Markets in January
• First time ever more "Built-for-Rent" Units started Quarterly than "Built-for-Sale"
This is usually published 4 to 6 times a week and provides more in-depth analysis of the housing market.
You can subscribe at https://calculatedrisk.substack.com/
Most content is available for free (and no Ads), but please subscribe!
Schedule for Week of February 26, 2023
by Calculated Risk on 2/25/2023 08:11:00 AM
The key reports this week are Case-Shiller house prices and February vehicle sales.
For manufacturing, the January ISM Index, and the February Dallas and Richmond Fed manufacturing surveys will be released.
8:30 AM: Durable Goods Orders for January from the Census Bureau. The consensus is for a 4.0% decrease in durable goods orders.
10:00 AM: Pending Home Sales Index for January. The consensus is for a 1.0% increase in the index.
10:30 AM: Dallas Fed Survey of Manufacturing Activity for February.
9:00 AM: FHFA House Price Index for December 2022. This was originally a GSE only repeat sales, however there is also an expanded index.
 9:00 AM: S&P/Case-Shiller House Price Index for December.
This graph shows the year-over-year change for the Case-Shiller National, Composite 10 and Composite 20 indexes, through the most recent report (the Composite 20 was started in January 2000).
The consensus is for a 6.0% year-over-year increase in the Comp 20 index for December, down from 6.8% in November.
10:00 AM: Richmond Fed Survey of Manufacturing Activity for February.
7:00 AM ET: The Mortgage Bankers Association (MBA) will release the results for the mortgage purchase applications index.
10:00 AM: ISM Manufacturing Index for January. The consensus is for the ISM to be at 48.0, up from 47.4 in January.
10:00 AM: Construction Spending for December. The consensus is for a 0.2% increase in construction spending.
8:30 AM: The initial weekly unemployment claims report will be released. The consensus is for 197 thousand initial claims, up from 192 thousand last week.
 All day: Light vehicle sales for February. The consensus is for light vehicle sales to be 15.0 million SAAR in February, down from 15.7 million in January (Seasonally Adjusted Annual Rate).
This graph shows light vehicle sales since the BEA started keeping data in 1967. The dashed line is the January sales rate.
10:00 AM: the ISM Services Index for February.


