 RSS Feed
 by Calculated Risk on 3/07/2023 08:44:00 PM
Tuesday, March 07, 2023
Wednesday: Fed Chair Powell, Job Openings, ADP Employment, Beige Book
 Note: Mortgage rates are from MortgageNewsDaily.com and are for top tier scenarios.
Wednesday:
• At 7:00 AM ET, The Mortgage Bankers Association (MBA) will release the results for the mortgage purchase applications index.
• At 8:15 AM, The ADP Employment Report for February. This report is for private payrolls only (no government). The consensus is for 195,000 payroll jobs added in February, up from 106,000 added in January.
• At 10:00 AM, Job Openings and Labor Turnover Survey for January from the BLS.
• Also at 10:00 AM, Testimony, Fed Chair Jerome Powell, Semiannual Monetary Policy Report to the Congress, Before the U.S. House Financial Services Committee
• At 2:00 PM, the Federal Reserve Beige Book, an informal review by the Federal Reserve Banks of current economic conditions in their Districts.
Leading Index for Commercial Real Estate Increases in February
by Calculated Risk on 3/07/2023 02:40:00 PM
From Dodge Data Analytics: Dodge Momentum Index Gets a Boost in February
The Dodge Momentum Index (DMI), issued by Dodge Construction Network, advanced 1.9% in February to 203.0 (2000=100) from the revised January reading of 199.3. In February, the commercial component of the DMI rose 1.4%, and the institutional component increased 2.9%.
“The Dodge Momentum Index returned to growth in February after falling 9% last month,” stated Sarah Martin, associate director of forecasting for Dodge Construction Network. “The continued elevation in the DMI should provide hope that construction activity will grow in 2024. Owners and developers tend to put projects into planning until well after economic conditions weaken. During the Great Recession, for example, the DMI did not substantially decline until 2009. Therefore, the anticipated mild economic growth in 2023 could cause the DMI to moderate over the year, but it is unlikely to fall below historical norms.”
Commercial planning in February was bolstered by almost 20% growth in office planning activity, as data centers continued to steadily enter the planning queue. Institutional planning was driven higher by growth in education and healthcare projects, notably the continued investment in research laboratories. On a year-over-year basis, the DMI remains 43% higher than in February 2022. The commercial component was up 55%, and the institutional component was 22% higher.
...
The DMI is a monthly measure of the initial report for nonresidential building projects in planning, shown to lead construction spending for nonresidential buildings by a full year.
emphasis added
 Click on graph for larger image.
This graph shows the Dodge Momentum Index since 2002. The index was at 203.0 in February, up from 199.3 in December.
According to Dodge, this index leads "construction spending for nonresidential buildings by a full year". This index suggests a solid pickup in commercial real estate construction in 2023.
As Ms. Martin notes, commercial construction is a lagging economic indicator.
Pandemic Economics, Housing and Monetary Policy: Part I; The Economic Fireworks have been in Housing!
by Calculated Risk on 3/07/2023 10:23:00 AM
Today, in the Calculated Risk Real Estate Newsletter: Pandemic Economics, Housing and Monetary Policy: Part I
A brief excerpt:
Pandemic economic outcomes were frequently largely unexpected.There is much more in the article. You can subscribe at https://calculatedrisk.substack.com/
For example, early in the pandemic, there was a shortage of toilet paper. Since there are two supply chains for toilet paper - one residential and the other commercial - and many more people were using the bathroom at home instead of at the office, there was a shortage of residential toilet paper. ...
More generally, in 2020, we saw a surge in spending on goods as many services were shut down. With fiscal policy supporting incomes, the increase in demand for goods eventually led to an increase in prices as inventories were depleted.
The graph above shows that goods prices started to increase year-over-year (YoY) in 2020 and accelerated in 2021 due to both strong demand and supply chain disruptions. ...
In his testimony today, Fed Chair Powell clearly doesn’t see service inflation as transitory:That said, there is little sign of disinflation thus far in the category of core services excluding housing, which accounts for more than half of core consumer expenditures. To restore price stability, we will need to see lower inflation in this sector, and there will very likely be some softening in labor market conditions.Clearly Powell believes service-related price increases will not as transitory as goods and commodities and will require “some softening in labor market conditions”. The FOMC is clearly committed to further raising rates to curb inflation.
… the latest economic data have come in stronger than expected, which suggests that the ultimate level of interest rates is likely to be higher than previously anticipated. If the totality of the data were to indicate that faster tightening is warranted, we would be prepared to increase the pace of rate hikes. Restoring price stability will likely require that we maintain a restrictive stance of monetary policy for some time.
emphasis added
...
In Part II, I’ll discuss what I think will happen with housing going forward and - since housing is the key transmission mechanism for monetary policy - the implications for Fed policy. I’ll suggest some out of consensus possibilities!

Wholesale Used Car Prices Increased in February, Down 7.0% Year-over-year
by Calculated Risk on 3/07/2023 09:20:00 AM
From Manheim Consulting today: Wholesale Used-Vehicle Prices See Large Increase in February
Wholesale used-vehicle prices (on a mix, mileage, and seasonally adjusted basis) increased 4.3% in February from January. This was the largest increase for the full month of February since 2009’s 4.4% rise. The Manheim Used Vehicle Value Index (MUVVI) rose to 234.5, down 7.0% from a year ago. February’s increase was driven partially by the seasonal adjustment. The non-adjusted price change in February was an increase of 3.7% compared to January, moving the unadjusted average price down 5.6% year over year.
emphasis added
 Click on graph for larger image.
This index from Manheim Consulting is based on all completed sales transactions at Manheim’s U.S. auctions.
The Manheim index suggests used car prices increased in February (seasonally adjusted) and were down 7.0% year-over-year (YoY).
CoreLogic: House Prices up 5.5% YoY in January; Declined 0.2% MoM in January NSA
by Calculated Risk on 3/07/2023 08:00:00 AM
Notes: This CoreLogic House Price Index report is for January. The recent Case-Shiller index release was for December. The CoreLogic HPI is a three-month weighted average and is not seasonally adjusted (NSA).
From CoreLogic: CoreLogic: US Annual Home Price Growth Continues Single-Digit Slowdown in January
CoreLogic® ... today released the CoreLogic Home Price Index (HPI™) and HPI Forecast™ for January 2023.
U.S. home prices continued their gradual free fall in January, with the 5.5% annual gain down for the ninth straight month and the lowest recorded since June 2020. Deceleration was particularly noticeable in the Western U.S. and other states and metro areas that saw substantial appreciation over the past few years. Three Northwestern states (along with Washington, D.C.) posted at least slight annual declines as migration patterns that began during the pandemic shifted, slowing demand and driving price decreases.
"While 2023 kicked off on a more optimistic note for the U.S. housing market, recent mortgage rate volatility highlights how much uncertainty remains," said Selma Hepp, chief economist at CoreLogic. "Nevertheless, the continued shortage of for-sale homes is likely to keep price declines modest, which are projected to top out at 3% peak to trough."
"Home price depreciation and strong income growth are expected to boost affordability, which is particularly important for first-time buyers," Hepp continued. "This group has accounted for a higher share of mortgage applications since last summer, as first-time buyers don't need to surrender an extremely low mortgage rate like current homeowners."
...
U.S. home prices (including distressed sales) increased by 5.5% year over year in January 2023 compared to January 2022. On a month-over-month basis, home prices declined by 0.2% compared to December 2022.
emphasis added
Monday, March 06, 2023
Tuesday: Fed Chair Powell
by Calculated Risk on 3/06/2023 07:11:00 PM
 From Matthew Graham at Mortgage News Daily: Mortgage Rates Started Lower, But Rose Intraday
Mortgage rates have been hovering around the highest levels in months over the past 2 weeks, but had made a bit of progress by the end of last week. The improvement carried over into the early part of today. In other words, the average lender was offering just slightly lower rates this morning compared to the end of last week.Tuesday:
Unfortunately, as the day progressed, the bond market began losing ground. Bonds dictate day-to-day changes in rates. As such, the average mortgage lender was forced to recall their initial rate sheets and "reprice" to slightly higher rates.
This brings the average lender up to the 7% neighborhood for the average conventional conforming 30yr fixed scenario. [30 year fixed 6.95%]
emphasis added
• At 8:00 AM: CoreLogic House Price index for January.
• At 10:00 AM: Testimony, Fed Chair Jerome Powell, Semiannual Monetary Policy Report to the Congress, Before the U.S. Senate Committee on Banking, Housing, and Urban Affairs
Black Knight Mortgage Monitor: Home Prices Declined in January, "on pace to fall below 0% by March/April"
by Calculated Risk on 3/06/2023 09:55:00 AM
Today, in the Calculated Risk Real Estate Newsletter: Black Knight Mortgage Monitor: Home Prices Declined in January, "on pace to fall below 0% by March/April"
A brief excerpt:
Here is a graph of the Black Knight HPI. The index is still up 3.4% year-over-year but declined for the seventh consecutive month in January and is now 5.5% off the peak in June 2022.There is much more in the article. You can subscribe at https://calculatedrisk.substack.com/
• Home prices fell again in January, pulling back by 0.24% from December and a more modest 0.13% on a seasonally adjusted basis
• That’s the smallest monthly decline in seven months, as falling interest rates and improving affordability in late 2022/early 2023 ran into tightening supply
• All in, home prices are now 5.5% off their June peak and a more modest 2.9% off peak when adjusting for typical seasonal trends
• The annual home price growth rate fell to 3.43% in January – more than a full percentage point below the 30-year average – and is on pace to fall below 0% by March/April

Housing March 6th Weekly Update: Inventory Decreased 2.6% Week-over-week
by Calculated Risk on 3/06/2023 08:30:00 AM
Altos reports that active single-family inventory was down 2.6% week-over-week. Usually inventory bottoms in early February, so we'd expect inventory to bottom seasonally soon.
Here are the same week inventory changes for the last five years:
2023: -11.0K
2022: -3.7K
2021: -11.5K
2020: +1.0K
2019: -1.4K
 Click on graph for larger image.
This inventory graph is courtesy of Altos Research.
As of March 3rd, inventory was at 419 thousand (7-day average), compared to 430 thousand the prior week.
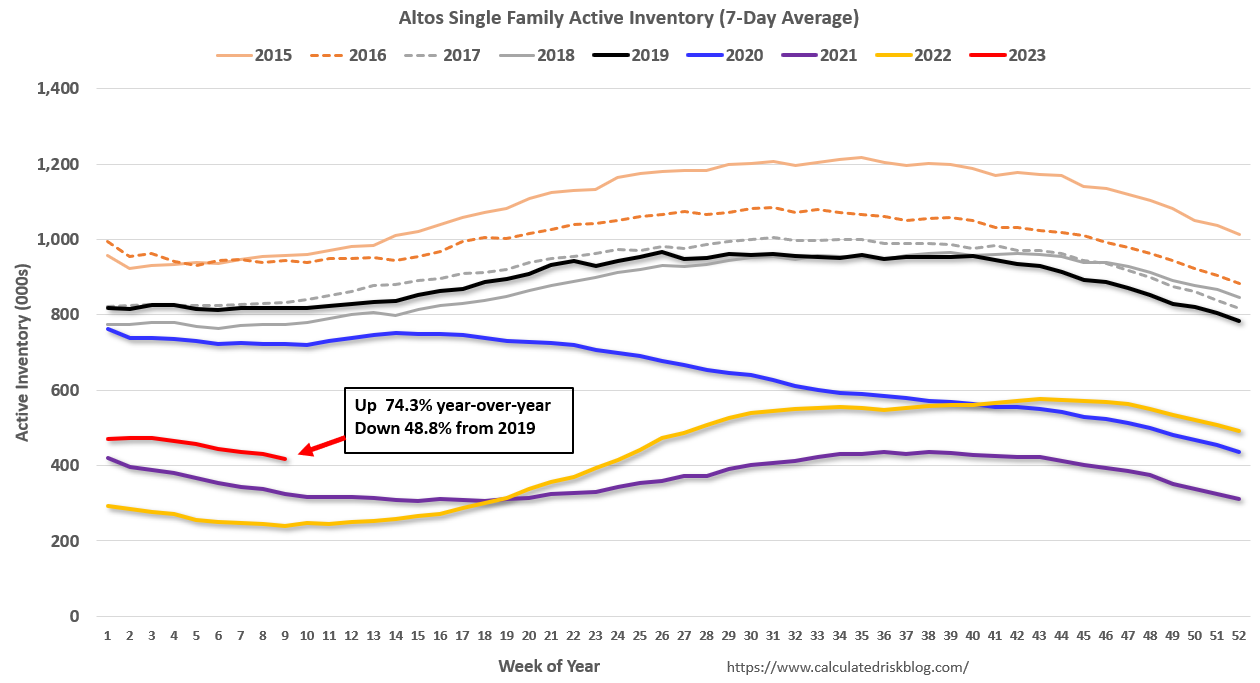
The red line is for 2023. The black line is for 2019. Note that inventory is up from the previous two years (the record low was in 2022), but still well below normal levels.
Inventory was up 74.3% compared to the same week in 2022 (last week it was up 76.2%), and down 48.8% compared to the same week in 2019 (last week down 47.5%).
A key will be when inventory starts increasing in 2023 - so far inventory has declined about 14.7% over the first nine weeks of 2023.
Mike Simonsen discusses this data regularly on Youtube.
Sunday, March 05, 2023
Sunday Night Futures
by Calculated Risk on 3/05/2023 07:38:00 PM
Weekend:
• Schedule for Week of March 5, 2023
Monday:
• No major economic releases scheduled.
From CNBC: Pre-Market Data and Bloomberg futures S&P 500 futures are down 4 and DOW futures are down 30 (fair value).
Oil prices were up over the last week with WTI futures at $79.68 per barrel and Brent at $85.83 per barrel. A year ago, WTI was at $116, and Brent was at $124 - so WTI oil prices are DOWN 30% year-over-year.
Here is a graph from Gasbuddy.com for nationwide gasoline prices. Nationally prices are at $3.36 per gallon. A year ago, prices were at $4.00 per gallon, so gasoline prices are down $0.64 per gallon year-over-year.
Update: Framing Lumber Prices Down 72% YoY, Below Pre-Pandemic Levels
by Calculated Risk on 3/05/2023 09:36:00 AM
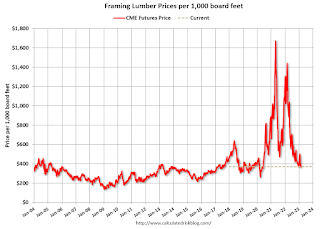
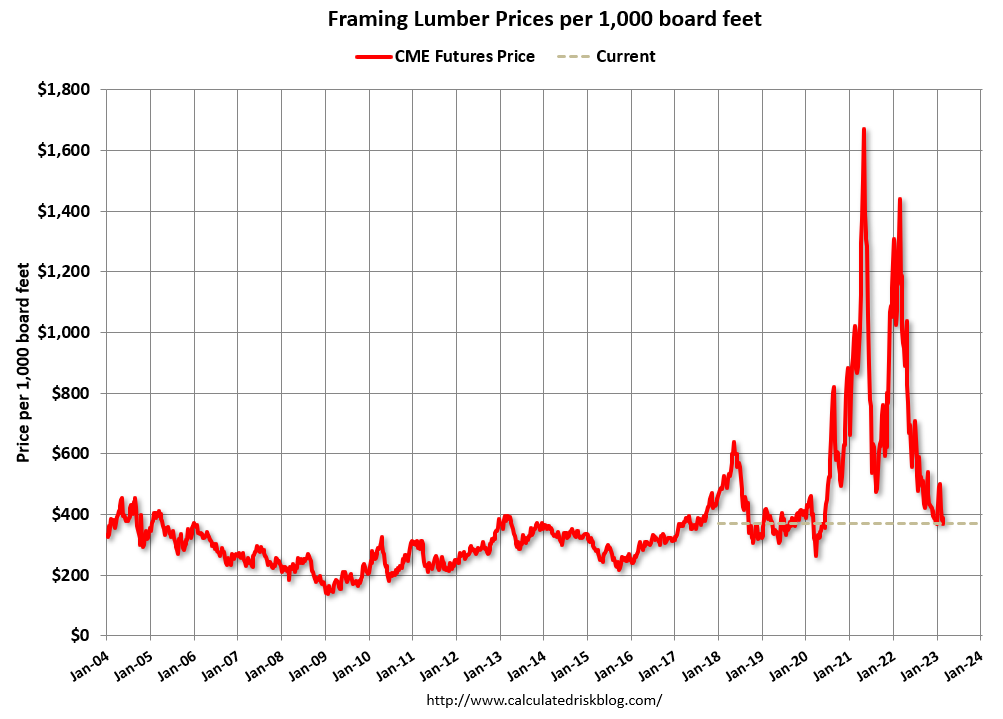
Here is another monthly update on framing lumber prices.
This graph shows CME random length framing futures through March 3rd.
Lumber is currently at $369 per 1000 board feet.
This is down from the peak of $1,733, and down 72% from $1,441 a year ago.
Prices are down 8% compared to the same week in 2019, and below the pre-pandemic levels of around $400.
 Click on graph for larger image.
It is unlikely we will see a significant runup in prices this Spring due to the housing slowdown.
Prices are down 8% compared to the same week in 2019, and below the pre-pandemic levels of around $400.
 Click on graph for larger image.
There is somewhat of a seasonal demand for lumber, and lumber prices usually peak in April or May.
It is unlikely we will see a significant runup in prices this Spring due to the housing slowdown.


