by Calculated Risk on 3/08/2023 02:16:00 PM
Wednesday, March 08, 2023
Fed's Beige Book: "Leasing rates for multifamily were starting to decrease"
Fed's Beige Book "This report was prepared at the Federal Reserve Bank of New York based on information collected on or before February 27, 2023. "
Overall economic activity increased slightly in early 2023. Six Districts reported little or no change in economic activity since the last report, while six indicated economic activity expanded at a modest pace. On balance, supply chain disruptions continued to ease. Consumer spending generally held steady, though a few Districts reported moderate to strong growth in retail sales during what is typically a slow period. Auto sales were little changed, on balance, though inventory levels continued to improve. Several Districts indicated that high inflation and higher interest rates continued to reduce consumers' discretionary income and purchasing power, and some concern was expressed about rising credit card debt. Travel and tourism activity remained fairly strong in most Districts. Manufacturing activity stabilized following a period of contraction. While housing markets remained subdued, restrained by exceptionally low inventory, an unexpected uptick in activity beyond the seasonal norm was seen in some Districts along the eastern seaboard. Commercial real estate activity was steady, with some growth in the industrial market but ongoing weakness in the office market. Demand for nonfinancial services was steady overall but picked up in a few Districts. On balance, loan demand declined, credit standards tightened, and delinquency rates edged up. Energy activity was flat to down slightly, and agricultural conditions were mixed. Amid heightened uncertainty, contacts did not expect economic conditions to improve much in the months ahead.And some regional comments on rents:
Labor market conditions remained solid. Employment continued to increase at a modest to moderate pace in most Districts despite hiring freezes by some firms and scattered reports of layoffs. Labor availability improved slightly, though finding workers with desired skills or experience remained challenging. Several Districts indicated that a lack of available childcare continued to impede labor force participation. While labor markets generally remained tight, a few Districts noted that firms are becoming less flexible with employees and beginning to reduce remote work options. Wages generally increased at a moderate pace, though some Districts noted that wage pressures had eased somewhat. Wage increases are expected to moderate further in the coming year.
emphasis added
Richmond: "Leasing rates for multifamily were starting to decrease, particularly for mid-priced units; high end apartment rents were unchanged."
...
Dallas: "Apartment leasing remained sluggish, and occupancy and rents were flat."
1st Look at Local Housing Markets in February
by Calculated Risk on 3/08/2023 12:26:00 PM
Today, in the Calculated Risk Real Estate Newsletter:
1st Look at Local Housing Markets in February
A brief excerpt:
This is the first look at local markets in February. I’m tracking about 40 local housing markets in the US. Some of the 40 markets are states, and some are metropolitan areas. I’ll update these tables throughout the month as additional data is released.There is much more in the article. You can subscribe at https://calculatedrisk.substack.com/
Closed sales in February were mostly for contracts signed in December and January. Since 30-year fixed mortgage rates were over 6% for all of December and January - compared to mid-3% range the previous year - closed sales were down significantly year-over-year in February. However, the impact was probably not as severe as for closed sales in December and January (rates were the highest in October and November 2022 when contracts were signed for closing in December and January.
...
Median sales prices for single family homes were down 5.6% year-over year (YoY) in Las Vegas, down 5.7% YoY in Denver, down 1.1% YoY in San Diego, and down 1.7% YoY in the Northwest (Seattle Area).
...
In February, sales in these markets were down 24.1%. In January, these same markets were down 36.3% YoY Not Seasonally Adjusted (NSA).
This is a smaller YoY decline NSA than in January for these early reporting markets. The early data suggests NAR reported sales will rebound in February. This will still be a significant YoY decline, and the 18th consecutive month with a YoY decline.
...
Many more local markets to come!
Trade Deficit increased to $68.3 Billion in January
by Calculated Risk on 3/08/2023 10:38:00 AM
From the Department of Commerce reported:
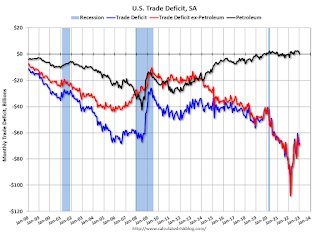
The U.S. Census Bureau and the U.S. Bureau of Economic Analysis announced today that the goods and services deficit was $68.3 billion in January, up $1.1 billion from $67.2 billion in December, revised.
January exports were $257.5 billion, $8.5 billion more than December exports. January imports were $325.8 billion, $9.6 billion more than December imports.
emphasis added
 Click on graph for larger image.
Both exports and imports increased in January.
Exports are up 13% year-over-year; imports are up 3% year-over-year.
Both imports and exports decreased sharply due to COVID-19 and then bounced back.
The second graph shows the U.S. trade deficit, with and without petroleum.
 The blue line is the total deficit, and the black line is the petroleum deficit, and the red line is the trade deficit ex-petroleum products.
Note that net, exports of petroleum products are positive.
The trade deficit with China decreased to $25.2 billion in January, from $36.4 billion a year ago.
BLS: Job Openings Decreased to 10.8 million in January
by Calculated Risk on 3/08/2023 10:08:00 AM
From the BLS: Job Openings and Labor Turnover Summary
The number of job openings decreased to 10.8 million on the last business day of January, the U.S. Bureau of Labor Statistics reported today. Over the month, the number of hires and total separations changed little at 6.4 million and 5.9 million, respectively. Within separations, quits (3.9 million) decreased, while layoffs and discharges (1.7 million) increased.The following graph shows job openings (black line), hires (dark blue), Layoff, Discharges and other (red column), and Quits (light blue column) from the JOLTS.
emphasis added
This series started in December 2000.
Note: The difference between JOLTS hires and separations is similar to the CES (payroll survey) net jobs headline numbers. This report is for January the employment report this Friday will be for February.
 Click on graph for larger image.
Note that hires (dark blue) and total separations (red and light blue columns stacked) are usually pretty close each month. This is a measure of labor market turnover. When the blue line is above the two stacked columns, the economy is adding net jobs - when it is below the columns, the economy is losing jobs.
The spike in layoffs and discharges in March 2020 is labeled, but off the chart to better show the usual data.
Jobs openings decreased in January to 10.8 million from 11.2 million in December.
The number of job openings (black) were down 6% year-over-year.
Quits were down 12% year-over-year. These are voluntary separations. (See light blue columns at bottom of graph for trend for "quits").
ADP: Private Employment Increased 242,000 in February
by Calculated Risk on 3/08/2023 08:21:00 AM
Private sector employment increased by 242,000 jobs in February and annual pay was up 7.2 percent year-over-year, according to the February ADP® National Employment ReportTM produced by the ADP Research Institute® in collaboration with the Stanford Digital Economy Lab (“Stanford Lab”)This was well above the consensus forecast of 195,000. The BLS report will be released Friday, and the consensus is for 200 thousand non-farm payroll jobs added in February.
...
“There is a tradeoff in the labor market right now,” said Nela Richardson, chief economist, ADP. "We're seeing robust hiring, which is good for the economy and workers, but pay growth is still quite elevated. The modest slowdown in pay increases, on its own, is unlikely to drive down inflation rapidly in the near-term.”
emphasis added
MBA: Mortgage Purchase Applications Increased in Weekly Survey
by Calculated Risk on 3/08/2023 07:00:00 AM
From the MBA: Mortgage Applications Increase in Latest MBA Weekly Survey
Mortgage applications increased 7.4 percent from one week earlier, according to data from the Mortgage Bankers Association’s (MBA) Weekly Mortgage Applications Survey for the week ending March 3, 2023.
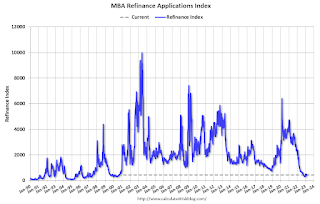
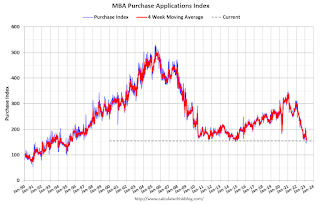
The Market Composite Index, a measure of mortgage loan application volume, increased 7.4 percent on a seasonally adjusted basis from one week earlier. On an unadjusted basis, the Index increased 9 percent compared with the previous week. The Refinance Index increased 9 percent from the previous week and was 76 percent lower than the same week one year ago. The seasonally adjusted Purchase Index increased 7 percent from one week earlier. The unadjusted Purchase Index increased 9 percent compared with the previous week and was 42 percent lower than the same week one year ago.
“Mortgage rates continued to increase last week. The 30-year fixed rate rose to 6.79 percent – the highest level since November 2022 and 270 basis points higher than a year ago,” said Joel Kan, MBA’s Vice President and Deputy Chief Economist. “Even with higher rates, there was an uptick in applications last week, but this was in comparison to two weeks of declines to very low levels, including a holiday week. Comparing the application indices from a year ago, purchase applications were still down 42 percent, and refinance activity was down 76 percent. Many borrowers are waiting on the sidelines for rates to come back down.”
..
The average contract interest rate for 30-year fixed-rate mortgages with conforming loan balances ($726,200 or less) increased to 6.79 percent from 6.71 percent, with points increasing to 0.80 from 0.77 (including the origination fee) for 80 percent loan-to-value ratio (LTV) loans.
emphasis added
 Click on graph for larger image.
The first graph shows the refinance index since 1990.
Tuesday, March 07, 2023
Wednesday: Fed Chair Powell, Job Openings, ADP Employment, Beige Book
by Calculated Risk on 3/07/2023 08:44:00 PM

Wednesday:
• At 7:00 AM ET, The Mortgage Bankers Association (MBA) will release the results for the mortgage purchase applications index.
• At 8:15 AM, The ADP Employment Report for February. This report is for private payrolls only (no government). The consensus is for 195,000 payroll jobs added in February, up from 106,000 added in January.
• At 10:00 AM, Job Openings and Labor Turnover Survey for January from the BLS.
• Also at 10:00 AM, Testimony, Fed Chair Jerome Powell, Semiannual Monetary Policy Report to the Congress, Before the U.S. House Financial Services Committee
• At 2:00 PM, the Federal Reserve Beige Book, an informal review by the Federal Reserve Banks of current economic conditions in their Districts.
Leading Index for Commercial Real Estate Increases in February
by Calculated Risk on 3/07/2023 02:40:00 PM
From Dodge Data Analytics: Dodge Momentum Index Gets a Boost in February
The Dodge Momentum Index (DMI), issued by Dodge Construction Network, advanced 1.9% in February to 203.0 (2000=100) from the revised January reading of 199.3. In February, the commercial component of the DMI rose 1.4%, and the institutional component increased 2.9%.
“The Dodge Momentum Index returned to growth in February after falling 9% last month,” stated Sarah Martin, associate director of forecasting for Dodge Construction Network. “The continued elevation in the DMI should provide hope that construction activity will grow in 2024. Owners and developers tend to put projects into planning until well after economic conditions weaken. During the Great Recession, for example, the DMI did not substantially decline until 2009. Therefore, the anticipated mild economic growth in 2023 could cause the DMI to moderate over the year, but it is unlikely to fall below historical norms.”
Commercial planning in February was bolstered by almost 20% growth in office planning activity, as data centers continued to steadily enter the planning queue. Institutional planning was driven higher by growth in education and healthcare projects, notably the continued investment in research laboratories. On a year-over-year basis, the DMI remains 43% higher than in February 2022. The commercial component was up 55%, and the institutional component was 22% higher.
...
The DMI is a monthly measure of the initial report for nonresidential building projects in planning, shown to lead construction spending for nonresidential buildings by a full year.
emphasis added
 Click on graph for larger image.
This graph shows the Dodge Momentum Index since 2002. The index was at 203.0 in February, up from 199.3 in December.
According to Dodge, this index leads "construction spending for nonresidential buildings by a full year". This index suggests a solid pickup in commercial real estate construction in 2023.
Pandemic Economics, Housing and Monetary Policy: Part I; The Economic Fireworks have been in Housing!
by Calculated Risk on 3/07/2023 10:23:00 AM
Today, in the Calculated Risk Real Estate Newsletter: Pandemic Economics, Housing and Monetary Policy: Part I
A brief excerpt:
Pandemic economic outcomes were frequently largely unexpected.There is much more in the article. You can subscribe at https://calculatedrisk.substack.com/
For example, early in the pandemic, there was a shortage of toilet paper. Since there are two supply chains for toilet paper - one residential and the other commercial - and many more people were using the bathroom at home instead of at the office, there was a shortage of residential toilet paper. ...
More generally, in 2020, we saw a surge in spending on goods as many services were shut down. With fiscal policy supporting incomes, the increase in demand for goods eventually led to an increase in prices as inventories were depleted.
The graph above shows that goods prices started to increase year-over-year (YoY) in 2020 and accelerated in 2021 due to both strong demand and supply chain disruptions. ...
In his testimony today, Fed Chair Powell clearly doesn’t see service inflation as transitory:That said, there is little sign of disinflation thus far in the category of core services excluding housing, which accounts for more than half of core consumer expenditures. To restore price stability, we will need to see lower inflation in this sector, and there will very likely be some softening in labor market conditions.Clearly Powell believes service-related price increases will not as transitory as goods and commodities and will require “some softening in labor market conditions”. The FOMC is clearly committed to further raising rates to curb inflation.
… the latest economic data have come in stronger than expected, which suggests that the ultimate level of interest rates is likely to be higher than previously anticipated. If the totality of the data were to indicate that faster tightening is warranted, we would be prepared to increase the pace of rate hikes. Restoring price stability will likely require that we maintain a restrictive stance of monetary policy for some time.
emphasis added
...
In Part II, I’ll discuss what I think will happen with housing going forward and - since housing is the key transmission mechanism for monetary policy - the implications for Fed policy. I’ll suggest some out of consensus possibilities!
Wholesale Used Car Prices Increased in February, Down 7.0% Year-over-year
by Calculated Risk on 3/07/2023 09:20:00 AM
From Manheim Consulting today: Wholesale Used-Vehicle Prices See Large Increase in February
Wholesale used-vehicle prices (on a mix, mileage, and seasonally adjusted basis) increased 4.3% in February from January. This was the largest increase for the full month of February since 2009’s 4.4% rise. The Manheim Used Vehicle Value Index (MUVVI) rose to 234.5, down 7.0% from a year ago. February’s increase was driven partially by the seasonal adjustment. The non-adjusted price change in February was an increase of 3.7% compared to January, moving the unadjusted average price down 5.6% year over year.
emphasis added
 Click on graph for larger image.
This index from Manheim Consulting is based on all completed sales transactions at Manheim’s U.S. auctions.


