 RSS Feed
 by Calculated Risk on 3/10/2023 12:25:00 PM
Friday, March 10, 2023
Bank Failure #1 in 2023: Silicon Valley Bank
Silicon Valley Bank, Santa Clara, California, was closed today by the California Department of Financial Protection and Innovation, which appointed the Federal Deposit Insurance Corporation (FDIC) as receiver. To protect insured depositors, the FDIC created the Deposit Insurance National Bank of Santa Clara (DINB). At the time of closing, the FDIC as receiver immediately transferred to the DINB all insured deposits of Silicon Valley Bank. ... As of December 31, 2022, Silicon Valley Bank had approximately $209.0 billion in total assets and about $175.4 billion in total deposits. At the time of closing, the amount of deposits in excess of the insurance limits was undetermined. The amount of uninsured deposits will be determined once the FDIC obtains additional information from the bank and customers.As of the December 2022, Silicon Valley Bank was the 16th largest US bank in terms of assets.
Comments on February Employment Report
by Calculated Risk on 3/10/2023 09:21:00 AM
The headline jobs number in the February employment report was above expectations, however employment for the previous two months was revised down by 34,000, combined. The participation rate increased, and the unemployment rate increased to 3.6%.
Leisure and hospitality gained 105 thousand jobs in February. At the beginning of the pandemic, in March and April of 2020, leisure and hospitality lost 8.2 million jobs, and are now down 410 thousand jobs since February 2020. So, leisure and hospitality has now added back about 95% all of the jobs lost in March and April 2020.
Construction employment increased 24 thousand and is now 310 thousand above the pre-pandemic level.
Manufacturing lost 4 thousand jobs and is now 198 thousand above the pre-pandemic level.
In February, the year-over-year employment change was 4.34 million jobs.
Prime (25 to 54 Years Old) Participation
 Since the overall participation rate is impacted by both cyclical (recession) and demographic (aging population, younger people staying in school) reasons, here is the employment-population ratio for the key working age group: 25 to 54 years old.
The 25 to 54 participation rate increased in February to 83.1% from 82.7% in January, and the 25 to 54 employment population ratio increased to 80.5% from 80.2% the previous month.
Both are at the pre-pandemic levels and suggest essentially all of the prime age workers have returned to the labor force.
Average Hourly Wages
 The graph shows the nominal year-over-year change in "Average Hourly Earnings" for all private employees from the Current Employment Statistics (CES).
Average Hourly Wages
 The graph shows the nominal year-over-year change in "Average Hourly Earnings" for all private employees from the Current Employment Statistics (CES).
 There was a huge increase at the beginning of the pandemic as lower paid employees were let go, and then the pandemic related spike reversed a year later.
Wage growth has trended down after peaking at 5.9% YoY in March 2022 and was at 4.6% YoY in February.
Wage growth has trended down after peaking at 5.9% YoY in March 2022 and was at 4.6% YoY in February.
Wages growth was strong last year in the March through July period, so year-over-year wage growth will likely slow over the next few months.
Part Time for Economic Reasons
 From the BLS report:
These workers are included in the alternate measure of labor underutilization (U-6) that increased to 6.8% from 6.6% in the previous month. This is down from the record high in April 22.9% and up from the lowest level on record (seasonally adjusted) in December 2022 (6.5%). (This series started in 1994). This measure is below the level in February 2020 (pre-pandemic).
Unemployed over 26 Weeks
 This graph shows the number of workers unemployed for 27 weeks or more.
According to the BLS, there are 1.057 million workers who have been unemployed for more than 26 weeks and still want a job, down from 1.111 million the previous month.
This is at pre-pandemic levels.
Summary:
The headline monthly jobs number was above expectations; however, employment for the previous two months was revised down by 34,000, combined. The headline unemployment rate increased to 3.6%.
Part Time for Economic Reasons
 From the BLS report:
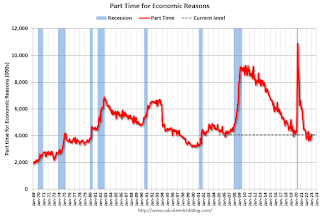
"The number of persons employed part time for economic reasons, at 4.1 million, was essentially unchanged in February. These individuals, who would have preferred full-time employment, were working part time because their hours had been reduced or they were unable to find full-time jobs."The number of persons working part time for economic reasons increased in February to 4.067 million from 4.050 million in January. This is at pre-recession levels.
These workers are included in the alternate measure of labor underutilization (U-6) that increased to 6.8% from 6.6% in the previous month. This is down from the record high in April 22.9% and up from the lowest level on record (seasonally adjusted) in December 2022 (6.5%). (This series started in 1994). This measure is below the level in February 2020 (pre-pandemic).
Unemployed over 26 Weeks
 This graph shows the number of workers unemployed for 27 weeks or more.
 According to the BLS, there are 1.057 million workers who have been unemployed for more than 26 weeks and still want a job, down from 1.111 million the previous month.
This is at pre-pandemic levels.
Summary:
The headline monthly jobs number was above expectations; however, employment for the previous two months was revised down by 34,000, combined. The headline unemployment rate increased to 3.6%.
Overall, this was a solid employment report.
February Employment Report: 311 thousand Jobs, 3.6% Unemployment Rate
by Calculated Risk on 3/10/2023 08:42:00 AM
From the BLS:
Total nonfarm payroll employment rose by 311,000 in February, and the unemployment rate edged up to 3.6 percent, the U.S. Bureau of Labor Statistics reported today. Notable job gains occurred in leisure and hospitality, retail trade, government, and health care. Employment declined in information and in transportation and warehousing.
...
The change in total nonfarm payroll employment for December was revised down by 21,000, from +260,000 to +239,000, and the change for January was revised down by 13,000, from +517,000 to +504,000. With these revisions, employment gains in December and January combined were 34,000 lower than previously reported.
emphasis added
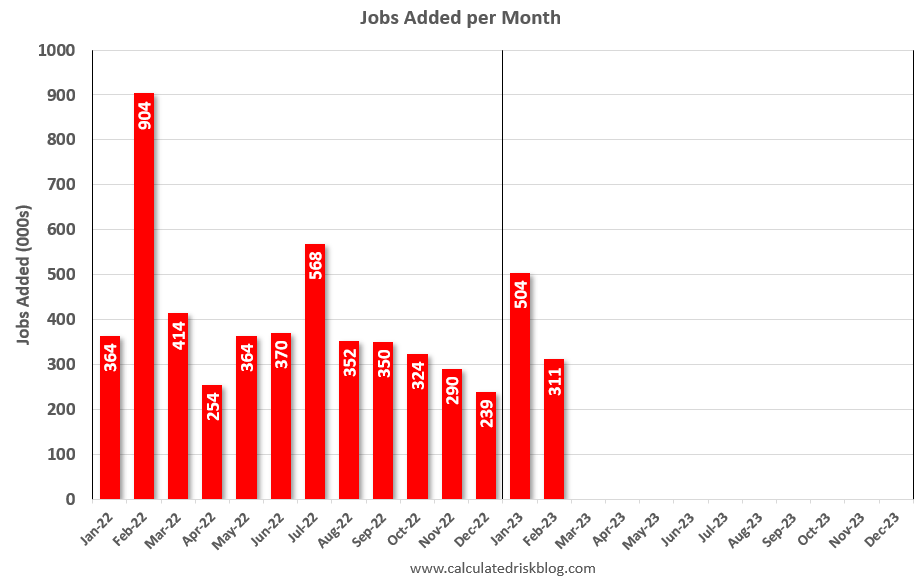 Click on graph for larger image.
The first graph shows the jobs added per month since January 2022.
Total payrolls increased by 311 thousand in February. Private payrolls increased by 265 thousand, and public payrolls increased 46 thousand.
Payrolls for December and January were revised down 34 thousand, combined.
Payrolls for December and January were revised down 34 thousand, combined.
 The second graph shows the year-over-year change in total non-farm employment since 1968.
In February, the year-over-year change was 4.34 million jobs. Employment was up significantly year-over-year.
The third graph shows the employment population ratio and the participation rate.
 The Labor Force Participation Rate increased to 62.5% in February, from 62.4% in January. This is the percentage of the working age population in the labor force.
 The Employment-Population ratio was unchanged at 60.2% (blue line).
I'll post the 25 to 54 age group employment-population ratio graph later.
 The fourth graph shows the unemployment rate.
 The unemployment rate increased in February to 3.6% from 3.4% in January.
This was above consensus expectations; however, December and January payrolls were revised down by 34,000 combined.
Thursday, March 09, 2023
Friday: Employment Report
by Calculated Risk on 3/09/2023 09:01:00 PM
 Note: Mortgage rates are from MortgageNewsDaily.com and are for top tier scenarios.
Friday:
• At 8:30 AM ET, Employment Report for February. The consensus is for 200,000 jobs added, and for the unemployment rate to be unchanged at 3.4%.
"Home ATM" is Closing; Mortgage Equity Withdrawal (MEW) Declines in Q4
by Calculated Risk on 3/09/2023 02:29:00 PM
Today, in the Real Estate Newsletter: "Home ATM" is Closing
Excerpt:
Here is the quarterly increase in mortgage debt from the Federal Reserve’s Financial Accounts of the United States - Z.1 (sometimes called the Flow of Funds report) released today. In the mid ‘00s, there was a large increase in mortgage debt associated with the housing bubble.There is much more in the article. You can subscribe at https://calculatedrisk.substack.com/ (All ad free).
In Q4 2022, mortgage debt increased $155 billion, down from $210 billion in Q3, and down from the cycle peak of $258 billion in Q2 2022. Note the almost 7 years of declining mortgage debt as distressed sales (foreclosures and short sales) wiped out a significant amount of debt.
However, some of this debt is being used to increase the housing stock (purchase new homes), so this isn’t all Mortgage Equity Withdrawal (MEW).
...
The bottom line is, the “Home ATM” is now closing with refinance activity off sharply and HELOC borrowing declining.

Fed's Flow of Funds: Household Net Worth Increased $2.9 Trillion in Q4
by Calculated Risk on 3/09/2023 01:52:00 PM
The Federal Reserve released the Q4 2022 Flow of Funds report today: Financial Accounts of the United States.
The net worth of households and nonprofits rose to $147.7 trillion during the fourth quarter of 2022. The value of directly and indirectly held corporate equities increased $2.7 trillion and the value of real estate decreased $0.1 trillion.
...
Household debt increased 2.3 percent at an annual rate in the fourth quarter of 2022. Consumer credit grew at an annual rate of 7 percent, while mortgage debt (excluding charge-offs) grew at an annual rate of 4.4 percent.
 Click on graph for larger image.
The first graph shows Households and Nonprofit net worth as a percent of GDP.
Net worth as a percent of GDP is down $4.2 trillion from the all-time high in Q1 2022.
This includes real estate and financial assets (stocks, bonds, pension reserves, deposits, etc) net of liabilities (mostly mortgages). Note that this does NOT include public debt obligations.
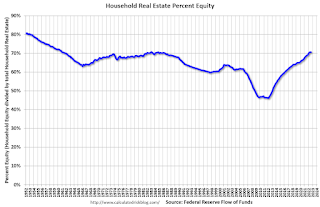 The second graph shows homeowner percent equity since 1952.
Household percent equity (as measured by the Fed) collapsed when house prices fell sharply in 2007 and 2008.
In Q4 2022, household percent equity (of household real estate) was at 71.2% - down slightly from 71.6% in Q3, 2022. This is close to the highest percent equity since the early 1980s.
Note: This includes households with no mortgage debt.
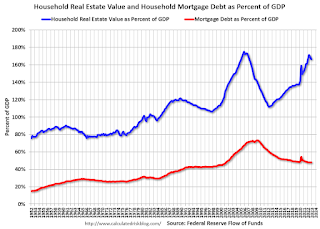 The third graph shows household real estate assets and mortgage debt as a percent of GDP. Note this graph was impacted by the sharp decline in Q2 2020 GDP.
Mortgage debt increased by $155 billion in Q4.
Mortgage debt is up $1.82 trillion from the peak during the housing bubble, but, as a percent of GDP is at 47.9% - down from Q3 - and down from a peak of 73.3% of GDP during the housing bust.
The value of real estate, as a percent of GDP, decreased in Q4 - after peaking in Q2 2022 - and is well above the average of the last 30 years.
 The second graph shows homeowner percent equity since 1952.
 Household percent equity (as measured by the Fed) collapsed when house prices fell sharply in 2007 and 2008.
In Q4 2022, household percent equity (of household real estate) was at 71.2% - down slightly from 71.6% in Q3, 2022. This is close to the highest percent equity since the early 1980s.
Note: This includes households with no mortgage debt.
 The third graph shows household real estate assets and mortgage debt as a percent of GDP. Note this graph was impacted by the sharp decline in Q2 2020 GDP.
Mortgage debt increased by $155 billion in Q4.
Mortgage debt is up $1.82 trillion from the peak during the housing bubble, but, as a percent of GDP is at 47.9% - down from Q3 - and down from a peak of 73.3% of GDP during the housing bust.
The value of real estate, as a percent of GDP, decreased in Q4 - after peaking in Q2 2022 - and is well above the average of the last 30 years.
Realtor.com Reports Weekly Active Inventory Up 61% YoY; New Listings Down 26% YoY
by Calculated Risk on 3/09/2023 11:26:00 AM
Realtor.com has monthly and weekly data on the existing home market. Here is their weekly report released today from Chief economist Danielle Hale: Weekly Housing Trends View — Data Week Ending Mar 4, 2023
• Active inventory growth continued to climb with for-sale homes up 61% above one year ago. Inventories of for-sale homes rose again, but the gain was the lowest we’ve seen since December. With new listings lagging behind year-ago pace, the growing number of homes for sale reflects longer time on market rather than an influx of sellers.
...
• New listings–a measure of sellers putting homes up for sale–were again down, this week by 26% from one year ago. For 35 weeks now, fewer homeowners put their homes on the market for sale than at this time one year ago. Until this week, the gap was slightly smaller than we saw in the last quarter of 2022. In February, attitudes toward housing worsened among both potential buyers and potential sellers as mortgage rates began to climb again and respondents reported lower job security. These attitudes could mean ongoing weakness in the number of homeowners deciding to sell.
 Here is a graph of the year-over-year change in inventory according to realtor.com.
 Inventory is still up sharply year-over-year; however, the YoY increase has slowed recently.
February Employment Preview
by Calculated Risk on 3/09/2023 11:15:00 AM
On Friday at 8:30 AM ET, the BLS will release the employment report for February. The consensus is for 200,000 jobs added, and for the unemployment rate to be unchanged at 3.4%.
From BofA economists:
"[W]e expect nonfarm payroll growth moderated to 230k, reversing much of the acceleration seen in January. This should still be enough to put downward pressure on the unemployment rate since we expect the labor force participation rate to be unchanged at 62.4%. As a result, we look for the unemployment rate to remain unchanged at 3.4%, but there is a meaningful risk that it rounds down to 3.3%."From Goldman Sachs:
"We left our nonfarm payroll forecast unchanged at +250k (mom sa)."
 Click on graph for larger image.
• First, as of January there were 2.70 million more jobs than in February 2020 (the month before the pandemic).
This graph shows the job losses from the start of the employment recession, in percentage terms. As of June 2022, the total number of jobs had exceeded pre-pandemic levels.
• ADP Report: The ADP employment report showed 242,000 private sector jobs were added in February. This suggests job gains slightly above consensus expectations, however, in general, ADP hasn't been very useful in forecasting the BLS report.
• ISM Surveys: Note that the ISM services are diffusion indexes based on the number of firms hiring (not the number of hires). The ISM® manufacturing employment index decreased in February to 49.1%, down from 50.6% last month. This would suggest 25,000 jobs lost in manufacturing. The ADP report indicated 43,000 manufacturing jobs added in February.
The ISM® services employment index increased in February to 54.0%, from 50.0% last month. This would suggest service employment increased 180,000 in February.
Combined, the ISM surveys suggest 155,000 jobs added in February (below the consensus forecast).
• Unemployment Claims: The weekly claims report showed no change in the number of initial unemployment claims during the reference week (includes the 12th of the month) from 192,000 in January to 192,000 in February. This would usually a similar number of layoffs in February as in January. In general, weekly claims were below expectations in February.
• COVID: As far as the pandemic, the number of weekly cases during the reference week in January was around 262,000, down from 317,000 in January.
• Weather: In January, the San Francisco Fed estimated that weather adjusted employment gains added 125 thousand to the employment report, and there should be some payback in February.
• Other Factors: The settlement of a labor dispute at the University of California boosted payrolls by about 40 thousand in January. Seasonal factors could also impact this report. In February 2022, the consensus was for 400 thousand jobs added, and the BLS reported 678 thousand jobs gained (since revised up to 904 thousand). And in February 2021, the consensus was for 148 thousand jobs added, and the BLS reported 379 thousand jobs added (since revised up to 575 thousand). Although the consensus has been way too low in February for the last two years, the new seasonal adjustments might negatively impact job gains in the February 2023 report.
• Conclusion: Accounting for weather and the end of the labor dispute, January employment gains were around 350 thousand - close to the gains for the previous 5 months. Reversing the January special factors, my guess is the employment report will be close to the consensus forecast.
Weekly Initial Unemployment Claims increase to 211,000
by Calculated Risk on 3/09/2023 08:33:00 AM
The DOL reported:
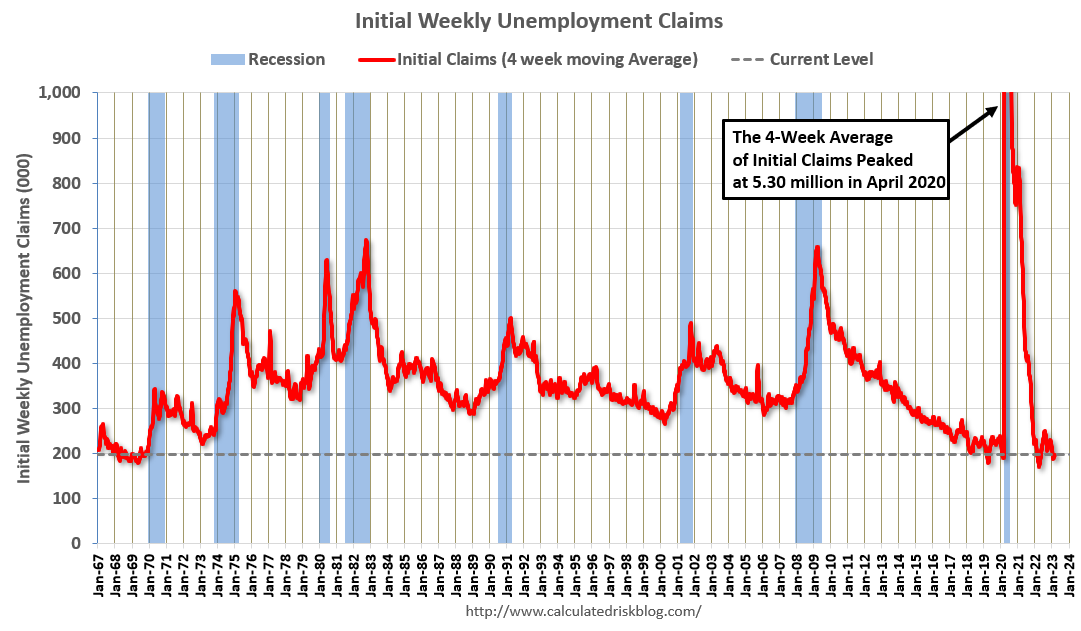
In the week ending March 4, the advance figure for seasonally adjusted initial claims was 211,000, an increase of 21,000 from the previous week's unrevised level of 190,000. The 4-week moving average was 197,000, an increase of 4,000 from the previous week's unrevised average of 193,000.The following graph shows the 4-week moving average of weekly claims since 1971.
emphasis added
 Click on graph for larger image.
The dashed line on the graph is the current 4-week average. The four-week average of weekly unemployment claims increased to 197,000.
The previous week was unrevised.
Weekly claims were above the consensus forecast.
Wednesday, March 08, 2023
Thursday: Unemployment Claims, Q4 Flow of Funds
by Calculated Risk on 3/08/2023 08:30:00 PM
 Note: Mortgage rates are from MortgageNewsDaily.com and are for top tier scenarios.
Thursday:
• At 8:30 AM ET, The initial weekly unemployment claims report will be released. The consensus is for 195 thousand initial claims, up from 190 thousand last week.
• At 12:00 PM, Q4 Flow of Funds Accounts of the United States from the Federal Reserve.


